AUTOMATIC SINGLE PALM TREE DETECTION IN PLANTATIONS USING UAV-BASED
PHOTOGRAMMETRIC POINT CLOUDS
T. Kattenborna, , M. Sperlicha, K. Batauab, B. Kocha
a
FeLis, Chair of Remote Sensing and Landscape Information Systems, University Freiburg, Tennenbacherstr. 4, 79106 Freiburg, Germany - [email protected] b
SOPAC, Applied Geoscience and Technology Division of Secretariat of the Pacific Community - SPC, 241 Mead Road, Nabua Suva, Fiji Islands - [email protected]
Commission VI, WG VI/4
KEY WORDS:Single Tree Detection, UAV, Palm plantation, Structure From Motion, Point Clouds, Segmentation, Terrain Models
ABSTRACT:
For reasons of documentation, management and certification there is a high interest in efficient inventories of palm plantations on the single plant level. Recent developments in unmanned aerial vehicle (UAV) technology facilitate spatial and temporal flexible acquisition of high resolution 3D data. Common single tree detection approaches are based on Very High Resolution (VHR) satellite or Airborne Laser Scanning (ALS) data. However, VHR data is often limited to clouds and does commonly not allow for height measurements. VHR and in particualar ALS data are characterized by high relatively high acquisition costs. Sperlich et al. (2013) already demonstrated the high potential of UAV-based photogrammetric point clouds for single tree detection using pouring algorithms. This approach was adjusted and improved for an application on palm plantation. The 9.4ha test site on Tarawa, Kiribati, comprised densely scattered growing palms, as well as abundant undergrowth and trees. Using a standard consumer grade camera mounted on an octocopter two flight campaigns at 70m and 100m altitude were performed to evaluate the effect Ground Sampling Distance (GSD) and image overlap. To avoid comission errors and improve the terrain interpolation the point clouds were classified based on the geometric characteristics of the classes, i.e. (1) palm, (2) other vegetation (3) and ground. The mapping accuracy amounts for 86.1% for the entire study area and 98.2% for dense growing palm stands. We conclude that this flexible and automatic approach has high capabilities for operational use.
1. INTRODUCTION 1.1 Palm plantation in the global context
Rising global demands for natural ressources induce an increase in intensive land use forms such as palm plantations (Mekhilef et al. 2011, Koh & Wilcove 2007). The latter, e.g. oil or co-conut plantations supply a wide variatey of products, ranging from food, biofuels, construction timber, firewood, cosmetics or textile fabric (Koh & Wilcove 2007; Ohler, 1999). For reasons of planning and documentation there is a high interest in efficient inventories on the individual tree level (Shafri et al. 2011). Fur-thermore, due to rising concerns about sustainability and global change industrial players and stakeholders aim for a traceable cer-tification of the production (Basiron 2007). However, with re-spect to the large extents of those plantations terrestrial inventory methods are time consuming and therefore expensive.
1.2 Remote Sensing for Plantation Management
Thus, for plantation inventories remote sensing data and analy-sis techniques are valuable tools. A few studies have used op-tical very high resolution (VHR) satellite imagery to manually count palms or automatically segment palms crowns based on their spectral and textural characteristics (Shafri et al. 2011; Ko-rom et al. 2014; Kamiran & Sarker 2014). These studies achieved high classification accuracies (75-95%). However, VHR data is characterized by relatively high acquisition costs, and data ac-quisiton on a regular basis is often limited by cloud cover. Fur-thermore, conventional VHR imagery does not allow for height measurements of palm individuals or surrounding vegetation as shrubs or trees. LIDAR offers precise and dense 3D data and is therefore widely and commercially used in forest inventories
(Hyyppa et al. 2008). Shafri et al. (2012) analyzed the poten-tial for airborne LIDAR and optical data for plantation planning and inventory. Despite the highly accurate 3D and optical data this technology is relatively expensive for inventories with a high temporal resolution, especially with regard to plantations in re-mote regions or islands.
Recent developments in Unmanned Aerial Vehicle (UAV) tech-nology facilitate spatial and temporal flexible acquisition of high resolution optical data. Costs and required expert knowledge are constantly decreasing due to fast advancements in the develop-ment of hard- and software (Colomina & Molina 2014). By ap-plying photogrammetric processing techniques, such as structure from motion algorithms, UAVs also allow for a hypertemporal and hyperspatial data acquistion of 3D point clouds (Lucieer et al. 2012).
2. METHODOLOGY
2.1 Study Site and UAV Data Acquisition
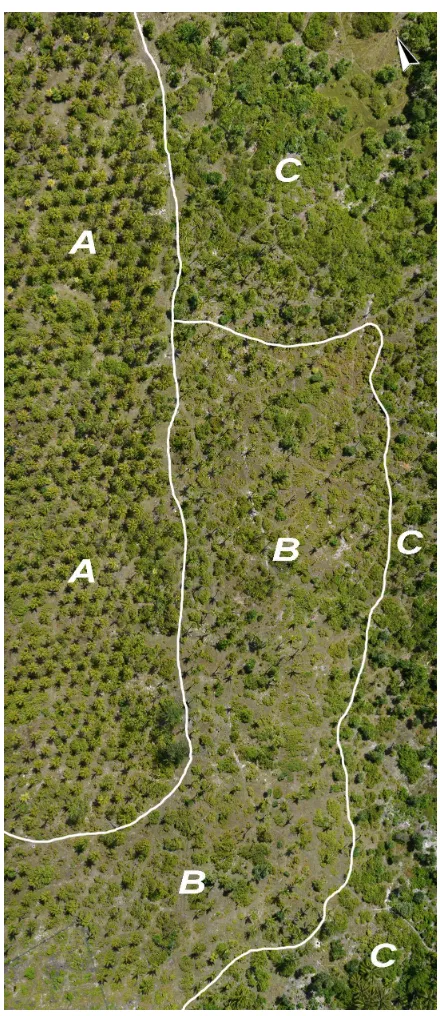
The test area is situated on Tarawa, an atoll in the Republic of Kiribati, in the central Pacific Ocean. The test site, with a size of approximately 470*200m, was chosen, since it comprises dense and sparse coconut palm cover as well as abundant varieties of undergrowth and other trees (see fig.1). Using this composition we aim to evaluate the detection accuracy of the reference palms as well as the robustness of palm detection in presence of other vegetation.
As UAV-plattform an octocopter, MK Okto2 (Highsystems), was chosen. In contrast to fixed-wing UAV-plattforms multicopters allow for a high image overlaps and carriage of high quality cam-eras. As sensor a consumer camera (Panasonic Lumix G3), with a 20mm lens was mounted on the UAV using a gimbal. In or-der to estimate the effects of ground sampling distance (GSD) and image overlap, two flights were carried out at different alti-tudes of 70m and 100m. The autonomous UAV-flights were pre-configured using 4 parallel stripes. The camera direction was to nadir, recording single frames (ISO 400, shutter speed 1/1200s) at a frequency of 1.4Hz. The two data sets were acquired consecu-tively to ensure nearly equal illumination and wind conditions. A summary of the photogrammetric characteristics of the two data sets is given in Table 2.
Alt. GSD forward overl. side overl. images
70 m 1.3 cm 89% 32% 519
100 m 1.9 cm 93% 58% 501
Table 1: Average ground sampling distance (GSD), forward and side overlap as well as the total number of images for both data sets.
2.2 Point Cloud Generation and Reference data Collection The cleaned set of images was processed with a structure from motion tool chain usingVisualSFM(V0.5.24, Furukawa & Ponce 2010). In order to increase reconstruction completeness and qual-ity we calculated the internal camera parameters using the cal-ibration software 3DF Lapyx (3DFlow). Accordingly a fixed camera calibration was used during the VisualSFM image match-ing step. The 70m and 100m datasets were co-registered usmatch-ing 8 checker boards as artifical ground control points , which were evenly spread within the study site during the flight campaigns. To ensure the comparability of the two data sets the resulting point clouds were clipped to a joint spatial extend.
In respect to the size of the test area, and in order to include as many individuals as possible the reference data was collected from the point clouds itself. Reference palm positions were iden-tified visually aided by the respective image frames. This pro-cedure also allowed to simultaneously check the local quality of the reconstruction. In the rare case of incomplete reconstructions the presence of apparent palm cast shadows and the single image frames allowed for an accurate identification of the palm posi-tion. Furthermore the height of each individual was measured using the top elevation of the palm crown within a normalized Digital Surface Model (nDSM, see chapter 3).
After Co-registration and reference data collection we decided to reduce the point cloud density for further processing and analy-sis. A voxel-grid filter with a minumum distance of 0.1m was applied to both datasets (70m and 100m).
2.2.1 Thematic Point Cloud Classification
To exclude non-palm vegetation during the delineation process the point cloud was classified into three classes: (1) Palm (2)
Figure 1: Orthophoto of the study site with a schematical rep-resentation of the different compositions. A: Densely grow-ing palms, B: Scattered and senile palms, C: Scattered palms and abundant presence of shrubs and trees. The Orthophoto was generated from the 100m nadir-images site (centered at Lat 1.367812, Long. 173.160384)
other vegetation including shrubs and trees and (3) ground in-cluding bare soil and grass. Besides reducing comission errors during the palm tree detection this approach is also meant to en-able the mapping of undergrowth and other vegetation to evaluate the accessibility and assist cultivation management. Furthermore a segmentation of ground points is likely improve the interpola-tion of a Digital Terrain Model (DTM), required for the applica-tion of the pouring algorithm
each class to separate the single points. The classification was carried out using the multi-scale dimensionality criterion classi-fication developed by Brodu & Lague (2012), which was origi-nally designed for Terrestrial Laser Scanning (TLS) data. In brief, the algorithm identifies the local dimensionality characteristics of the point cloud using neighborhood balls at different scales, i.e. search radii. On this basis a classifier is constructed, which de-scribes the best combination of scales to separate the user-defined categories on the basis of their geometric difference.
For the training of the classifiers we manually segmented 30 palm individuals of the 3D-reconstruction and approximately 200m2of both other vegetation and bare ground. For both data sets training and application of the classifiers was carried out separately. The classifiers were trained using 43 different scale factors re-spectively diameters between 0.1m - 6m. Initially the upper limit of 6 m was set as the processing time exponentially increases with larger scale factors. Accordingly we performed a step-wise exclusion of the largest scales in order to evaluate the potential accuracy gain of the latter.
2.3 Palm Individual Detection and Accuracy Assessment The palm detection was performed using the softwareTreesVis (Weinacker et al. 2004) through the implemented pouring algo-rithm. First, on the basis of the processed point clouds DTM and DSM were calculated in order to generate a nDSM, i.e. vegeta-tion heights.
Then, using the pouring algorithm palm tops and the according crown boundaries were estimated in the nDSM. Similar to a wa-tershed algorithm the pouring algorithm calculates local maxima of the nDSM aided by a gaussian filter. The maxima are the start-ing point for a downhill directed sequence, searchstart-ing for the min-ima surrounding the maxmin-ima. However, as these minmin-ima do not always correspond to the edge of the crown a ray algorithm ad-justs the crown border for a more realistic delineation. Thereby crown border points are corrected, if distances and angles of vir-tual rays between the tree tops end the surrounding minima ex-ceed predefined thresholds.
Different parameters, i.e. Gaussian Filter size, DSM and DTM interpolation methods, as well as height constraints were adjusted to palms on a heuristic basis.
For accuracy assessment and validation a 2m search radius was applied to the reference tree positions. A modeled palm was con-sidered as detected, if it was within the specified radius of a ref-erence tree. As a primary quality criterion of the palm detection we calculated the overall Mapping Accuracy (MA), based on de-tected reference palms, non dede-tected palms (omission error) and falsely detected palms (comission error):
M A= detected
detected+omission+comission (1)
For further evaluation of the modeled palms, we measured the eu-clidean distances between reference and modeled palm position (x,y) as well as the height deviations (z) for each individual.
3. RESULTS
3.1 3D Reconstruction Quality
Bare ground and other vegetation show highest point densities and completeness. Since the images were recorded in nadir-direction most of the densely growing palms lack stem points due to occlu-sion by the overlaying crown. The reconstructed palm crowns of the 70m data set tend to be slightly less noisy. In contrast the 100m data set shows a higher degree of reconstruction com-pleteness in terms of crown representation and total number of
reconstructed palms. Out of 615 palms within the study area the number of reconstructed palms sums up to 479 (77.9%) for the 70m data set and 597 (97.1%) for the 100m data set. Thereby a palm was defined as not reconstructed, if only a few points of the crown or only the parts of the stem were reconstructed.
3.2 Thematic Point Cloud Classification
The multi-scale dimensionality criterion classification produced unexpectedly good results and allowed for a clear separation of the point clouds into the three classes. Only negible portions of the reconstructed palms were classified as other vegetation see (see fig. 4). Very few points of other trees or tall growing shrubs were classified as palms. We assumed that these few points would either be ignored during DSM interpolation or would not meet the geometric characteristics to be delineated as a palm during the application of the pouring algorithm. Falsely classified ground points were aggregated in relatively small patches. A subsequent clustering of the ground point cloud allowed for a removal of clusters with spatial extend lower than a manual selected thresh-old (0.5 m).
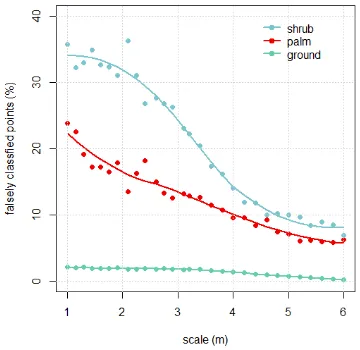
The stepwise exclusion of the largest scales (see fig.2) revealed that the classification accuracy of palms and other vegetation in-creases with larger scales. The proportion of falsely classified palm points decreases almost linear with larger scale factors. Falsely classified shrub points show a significantly stronger decrease of falsely classified points with larger scales. Both the shrub and palm classification accuracy show a tendency to converge at scales larger than 6m. Based on the described relationship we did not expect major classification accuracy gains adding larger scales (>6m), which would significantly increase computation
dura-tions. The classification of the ground class showed the overall highest accuracy. For all scales the classification accuracy ex-ceeds 95%.
Figure 2: Proportion of falsely classified palm and shrub points (%) for different scale ranges. For each of the classifications a step-wise exclusion of the largest scales was performed. For vi-sual interpretation a loess fit was calculated for both the palm and shrub classification results. The shown graph is based on the 100m dataset.
3.3 Tree detection
in chapter 3 neither within the 70m nor the 100m point cloud all reference trees were defined as reconstructed. Thus, we analyzed the detection results based on all reference trees in order to in-clude both the photogrammetric reconstruction and pouring al-gorithm inaccuracies.
Corresponding to the total number of reconstructed palms the overall mapping accuracy (MA) amounts for 68.6% for the 70m and 86.1% for the 100m data set respectively (see table 2). In-dicated by the high omission errors (27.6%) the low MA of the 70m data set is caused by its lower number of total reconstructed palms.
Parameter data set
70m 100m
No. Palms 615 615
No. Palms reconstructed 479 597 No. Palms Modelled 499 589 No. Palms Detected 445 557 Omission Error (%) 27.6 9.4 Comission Error (%) 10.8 5.4 Mapping Accuracy (%) 68.6 86.1
Table 2: Palm Tree Detection results for the two datasets (70m and 100m) based on all reference palms.
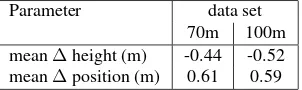
Each model included the estimated crown margins, the position (x,y) and the height (z) of the palm (see fig.4). The averaged po-sition and height deviations of the reference and modeled palms are listed in table 3. Both deviations of the estimated parameters are almost equal for both data sets. In general the heights are underestimated due to the filtering of single vertically exposed palm leaves (measured palm height) by the pouring algorithm. Although most of the palms in the study area show a tilted growth habit the average position deviation is clearly below the specified tolerance radius of 2 m.
Parameter data set
70m 100m
mean∆height (m) -0.44 -0.52 mean∆position (m) 0.61 0.59
Table 3: Averaged height and position deviations between refer-ence and modeled palms for both data sets (70m and 100m).
Reference trees and detection results were mapped in order to an-alyze the detection accuracy spatially (see fig. 3). Fewest omis-sion and comisomis-sion errors are present in the dense palm areas, where only 6 individuals could not be detected. The correspond-ing MA in this area is 98.2%. More frequent omissions occur at rather isolated palm individuals. Most comission errors occur in the presence of abundant shrub and tree cover, where small frag-ments of the point cloud remained after the classification process.
4. DISCUSSION
Within the present study we developed a work flow for an auto-matic palm plantation inventory, based on UAV-based photogram-metric point clouds. The processing of these point clouds in-cludes a geometric classification in order to ensure the detection of the target class, i.e. palm individuals. The following sections will discuss the results and findings with regard to the compo-nents of the presented methodology.
4.1 Data acquisition and 3D reconstruction
The results indicate that an increased forward and side-overlap (at higher altitudes) improves the overall 3D reconstruction of the
!
! Modeled Palm
A Reference Palm
! Detected Palm
±
Figure 3: Mapped distribution of reference palms and detection results (100m data set).
palm plantation in terms of reconstruction completeness. More frequent overlaps increase the probability of 3D reconstruction of detected features, such as palm leaves. This was even pronounced within the present study, as palm leaves are easily displaced by wind and gusts, which compounds the feature matching. Accord-ingly the more frequent overlapping of the 100m data set raised the chance of acquiring multiple images of a palm leave in the same position. We assume that there are optimization capabilities within the structure from motion processing. Accordingly differ-ent matching and reconstruction parameters have to be adjusted to palm vegetation. Further campaigns have to be conducted to identify the best ratio of GSD and side-overlap. In general flight campaigns should be performed in preferably calm wind condi-tions.
Using an UAV-based LIDAR could most likely overcome effects of wind and gusts. Yet, these systems are costlier and have a shorter operating duration due to heavier weight of the payload.
4.2 Thematic Classification
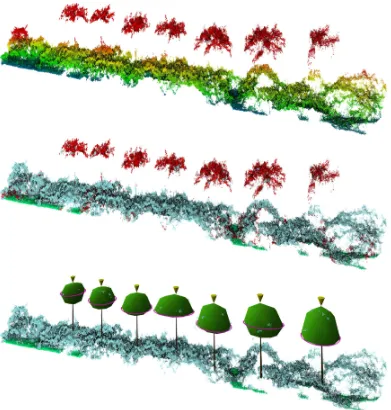
Figure 4: Transects (100m data set) of the point cloud with height color gradient (top); with classification results, palm = red, other vegetation = blue, ground = green (center) and with modeled palms (bottom). Green shapes represent the convex hull of the crown, vertically surrounded by crown margins (purple). Yellow cones represent the top (z) and the position (x,y).
intensity. The latter could ease cultivation activities such as regu-lar clearances or for maintainance of the road network. Third, the classification of ground pixels ensures that only the latter were in-cluded during the DTM interpolation. We assume that especially dense and extended shrubs would have impaired the interpolation results.
As shown in figure 3, depending on the geometric characteris-tics of the class, the classification accuracy strongly depends on the value range of the scales. The overall highest accuracy of the ground class is a result of the simple and distinct geometry, where points adjoin in a relatively flat and almost 2D-plane. Therefore larger search radii of the neighbourhood ball do strongly enhance the classification results. In contrast the geometric characteris-tics of palms and shrubs are explained and separated at a broader range of scales. Hence, not only the geomtric structure of adja-cent points is important, but also the overall form of leaves and branches. We assume that the beginning of the classification ac-curacy convergence (<4.5m) is linked with the diameter of the palm crowns. At this scale also visual interpretation is most likely
to differentiate between the geometric pattern of shrubs and palm crowns. Furthermore, larger neighbourhood balls and respec-tively larger search radii, would include large proportions of both shrub and palm points without explaining the geometric charac-teristics of a single class.
Due to the overall unexpectedly robust classification results we also expect a high potential of the multi-scale criterion classifica-tion of UAV-based photogrammetric point clouds in other disci-plines, such as archaeology, forestry or land-cover mapping.
4.3 Single Tree Detection
featured a relatively high proportion of omission errors. Fritz et al. (2013) presented a methodology using UAV derived pho-togrammetric point clouds in which a RANSAC-based cylinder fit is used to detect single tree stems. This will most likely feature a valuable extension of the present approach, since the outlying trees are also more likely to having their stems reproduced in the point cloud.
As our study site comprises other vegetation, such as dense un-dergrowth and abundant trees the results are not readily compa-rable to other methods. However, with an overall MA of 86.1% within the 100m data set the proposed methodology features a high detection performance. With regard to the automatic proce-dure the MA of 98.1% in dense growing palm stands is unexpect-edly high.
The overall position of the modeled palm trees show a very high correspondence with the reference trees. To a certain extend height deviations are indispensable, since the absolute height of an individual often relies on a single palm leaf. The general un-derestimation of the palm tree height is caused by the filtering of the pouring algorithm, which filters vertically protruding points, e.g. single top leafs. Yet, we assume that a palm height measure-ment is only possible to decimeter accuracy, since the defined top palm leaf height can possibly fluctuate according to the wa-ter status and therefore vigor. With an adjustment of the pouring algorithm the measured heights will enable a valuable predictor for classifying age classes or estimate biomass as well as carbon stocks using available allometric functions (Asari et al. 2013).
5. CONCLUSION
Within this study we could confirm the a high potential of UAV-based photogrammtric point clouds for single tree detection on plantations. Overall, the proposed approach can be regarded as a highly competitive remote sensing solution for palm planta-tion inventories. The cost effective, flexible and mobile UAV-technology and the highly automatized processing chain can be considered as available for operational use.
ACKNOWLEDGEMENTS
The authors would like to thank Prof. M. Petterson and Dr. W. Forstreuter (SOPAC - Applied Geoscience and Technology Divi-sion of Secretariat of the Pacific Community) for technical sup-port, Dr. G. Kattenborn (Gecopter.eu) for providing the UAV and equipment, the Ministry of Environment, Lands and Agriculture Development, Kiribati as well as the Ministry of Fisheries, Min-erals and Resources, Kiribati for on site assistance.
REFERENCES
Asari, N., Suratman, M.N., Jaafar, J., Khalid, M.M., (2013). Esti-mation of Above Ground Biomass for Oil Palm Plantations using Allometric Equations. 4th International Conference on Biology, Environment and Chemistry (IPCBEE), 58, pp. 110-114.
Basiron, Y., 2007. Palm oil production through sustainable plan-tations.European Journal of Lipid Science and Technology, 109(4), pp. 289-295.
Brodu, N. and Lague, D., 2012. 3D Terrestrial LiDAR data classi-fication of complex natural scenes using a multi-scale dimension-ality criterion : applications in geomorphology,ISPRS Journal of Photogrammmetry and Remote Sensing, 68, pp. 121-134.
Colomina, I., Molina, P. (2014). Unmanned aerial systems for photogrammetry and remote sensing: A review. ISPRS ISPRS Journal of Photogrammetry and Remote Sensing, 92, pp. 79-97.
Fritz, A., Kattenborn, T., and Koch, B. 2013. UAV-Based Pho-togammetric Point Clouds Tree Stem Mapping in Open Stands in Comparison to Terrestrial Laser Scanner Point Clouds. Int. Arch. Photogramm. Remote Sens. Spatial Inf. Sci., XL-1/W2, pp. 141-146.
Furukawa, Y. and Ponce, J., 2010. Accurate, dense, and robust multiview stereopsis. , IEEE Transactions on Pattern Analysis and Machine Intelligence32(8), pp. 13621376.
Kaartinen, H., Hyypp, J., Yu, X., Vastaranta, M., Hyypp, H., Kukko, A., ... Wu, J. C., 2012. An international comparison of individual tree detection and extraction using airborne laser scanning.MDPI Remote Sensing, 4(4), pp. 950-974.
Kamiran , N., Starker, M.L.R., (2014). Exploring the Potential of High Resolution Remote Sensing Data for Mapping Vegeta-tion and the Age Groups of Oil Palm PlantaVegeta-tion.OP Conference Series: Earth and Environmental Science, 18, 012181.
Koh, L. P. and Wilcove, D. S. (2007). Cashing in palm oil for conservation.Nature, 448(7157), pp. 993-994.
Korom, A., Phua, M. H., Hirata, Y., Matsuura, T., 2014. Extract-ing oil palm crown from WorldView-2 satellite image.IOP Con-ference Series: Earth and Environmental Science18 (1), 012188.
Lucieer, A., Robinson, S., Turner, D., Harwin, S. and Kelcey, J., 2012. Using a micro-uav for ultra-high resolution multi-sensor observations of antarctic moss beds.International Archives of the Photogrammetry, Remote Sensing and Spatial Information Sci-ences, XXXIX-B1, pp. 429433.
Mekhilef, S., Siga, S., Saidur, R., 2011. A review on palm oil biodiesel as a source of renewable fuel.Renewable and Sustain-able Energy Reviews, 15(4), pp. 1937-1949.
Ohler, J. G., 1999. Modern coconut management: palm cultiva-tion and products. ITDG Publishing,Warwickshire, 458 p.
Shafri, H. Z., Hamdan, N., Saripan, M. I. (2011). Semi-automatic detection and counting of oil palm trees from high spatial resolu-tion airborne imagery.International Journal of Remote Sensing, 32(8), pp. 2095-2115.
Shafri, H. Z., Ismail, M. H., Razi, M. K. M., Anuar, M. I., Ah-mad, A. R. (2012, November). Application of LiDAR and optical data for oil palm plantation management in Malaysia.SPIE Asia-Pacific Remote Sensing, 85(2), 608. 852608-852608).
Sperlich, M., Kattenborn, T., Koch, B., Kattenborn, G., 2014. Potential of Unmanned Aerial Vehicle Based Photogrammetric Point Clouds for Automatic Single Tree Detection.Publikationen der DGPF, 23, 270.
Vauhkonen, J., Ene, L., Gupta, S., Heinzel, J., Holmgren, J., Pitk-nen, J., ... Maltamo, M., 2012. Comparative testing of single-tree detection algorithms under different types of forest.Forestry, 85(1), pp. 27-40.