A VOXEL-BASED TECHNIQUE TO ESTIMATE THE VOLUME OF TREES FROM
TERRESTRIAL LASER SCANNER DATA
A. Bienert a, *, C. Hess b, H.-G. Maas a, G. von Oheimb b
a
Technische Universität Dresden, Institute of Photogrammetry and Remote Sensing, 01062 Dresden, Germany (anne.bienert, hans-gerd.maas)@tu-dresden.de
b Leuphana Universität Lüneburg, Institute of Ecology, 21335 Lüneburg, Germany (hess, vonoheimb)@leuphana.de
Commission V, WG V/5
KEY WORDS: Terrestrial Laser Scanning, Point Cloud, Tree, Volume Estimation, Voxel
ABSTRACT:
The precise determination of the volume of standing trees is very important for ecological and economical considerations in forestry. If terrestrial laser scanner data are available, a simple approach for volume determination is given by allocating points into a voxel structure and subsequently counting the filled voxels. Generally, this method will overestimate the volume. The paper presents an improved algorithm to estimate the wood volume of trees using a voxel-based method which will correct for the overestimation. After voxel space transformation, each voxel which contains points is reduced to the volume of its surrounding bounding box. In a next step, occluded (inner stem) voxels are identified by a neighbourhood analysis sweeping in the X and Y direction of each filled voxel. Finally, the wood volume of the tree is composed by the sum of the bounding box volumes of the outer voxels and the volume of all occluded inner voxels. Scan data sets from several young Norway maple trees (Acer platanoides) were used to analyse the algorithm. Therefore, the scanned trees as well as their representing point clouds were separated in different components (stem, branches) to make a meaningful comparison. Two reference measurements were performed for validation: A direct wood volume measurement by placing the tree components into a water tank, and a frustum calculation of small trunk segments by measuring the radii along the trunk. Overall, the results show slightly underestimated volumes (-0.3% for a probe of 13 trees) with a RMSE of 11.6% for the individual tree volume calculated with the new approach.
* Corresponding author.
1. INTRODUCTION
The trunk is the economically most important part of a forest tree, and the determination of the stem volume is a main task in forestry. Besides the value of the standing timber to predict the harvesting profit, the volume (or its temporal change) may also give information about the success of silvicultural methods. A very accurate direct measurement of the trunk volume can be done with xylometry methods (i.e. water displacement methods). However, this results in a time consuming process and a destroyed tree. Alternatively, non-destructive methods preserve the stand structure, but at the expense of the accuracy of volume determination. Usually, these methods are based on prediction models making use of different stem diameters measured along the trunk. A simple volume calculation of the tree trunk is achieved by adding up the volumes of different rotationally symmetrical bodies along the stem axes. Beyond this, terrestrial laser scanning offers an efficient, accurate and non-destructive way to estimate tree volume of standing trees. Terrestrial laser scanning is a fast and efficient tool to capture 3D-information of complex object structures. The interest on terrestrial laser scanning for the use in forestry applications has increased in recent years. A common field of application for terrestrial laser scanners is the determination of forest inventory parameters (e.g. Hopkinson et al., 2004; Thies & Spiecker 2004; Watt et al., 2005; Maas et al., 2008). The two important tree parameters, tree height (h) and stem diameter at breast height (dbh), are further used in prediction models to estimate
the volume or biomass of a tree in a non-destructive way (e.g. Kankare et al., 2012). Dassot et al. (2012) calculate the tree volume by modelling the stem and branch structure with fitted cylinders. Biomass can also be estimated by analyzing data in a voxel space structure (e.g. Moskal & Zheng, 2011; Hosoi et al., 2013). Hosoi et al. (2013) use multiple-scans and obtain an averaged error of 6.8% of the volume. A simple approach is summing up all filled voxels after allocating points into a voxel structure. Obviously, the estimated wood volume depends on the size of the utilized voxels. On the one hand, a large voxel size will lead to a large overestimation of the tree volume (Figure 7). On the other hand, an underestimation is given if the voxel size falls below the stem or branch diameter and empty voxels located inside the stem or branch are missed. The later may be compensated by filling those empty voxels by 3D-mathematical morphology operations. Moskal & Zheng (2011) use a voxel-based method to calculate the tree volume by summing up the filled voxels and adding an adjustment factor, which represents the trunk volume calculated by h and dbh, obtained from the point cloud. The authors present volumes derived from single-scans, which match only 18% of the total tree volume because of scan shadows. Regarding the stem volume, diameter profiles along a tree stem can also be used to model conical frustums (Pueschel et al., 2013).
The goal of this paper is the development of a novel voxel-based algorithm to precisely determine the wood volume of standing trees. The quality of the results of the presented method should be comparable to those of conventional
methods. The outline is as follows: section 2 introduces the data sets used. Afterwards, section 3 presents the new-developed voxel-based algorithm for volume determination. Extensive tests on different point clouds are presented in section 4. Results from processing a total of 13 trees will be presented and will be compared to volume values obtained by the water displacement method, which was applied after harvesting the trees. Finally, a discussion will be given, and a summary closes the article.
2. DATA SETS
All trees were scanned on an almost windless day in May 2013 under leaf-off conditions with a FARO Photon 120 laser scanner. The trees were scanned with an horizontal and vertical angular step size of 0.036°, which leads in a point spacing of 2.5 mm at 4 m distance. Up to 244,000 points per second were measured, and the scanner had a clear view without occlusions to the trees and a mean distance between 3 m and 4 m. Consequently, the point clouds have 10,000 ≤ n ≤ 200,000 points, depending on the tree size and branch structure. After scanning, all point clouds were filtered with the filter tool Statistical Outliers Remover of the open-source point cloud editing software CloudCompare to reduce typical stray points.
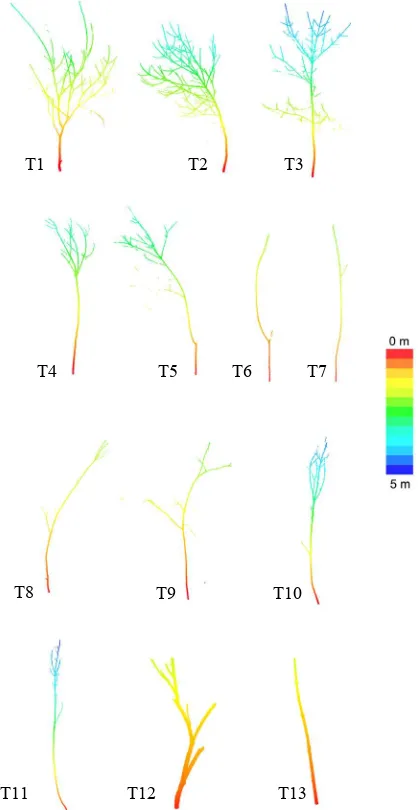
Figure 1. Tree point clouds of data set A.
In this study, the scanned trees are young trees (h < 5) with a very fine structure, motivated by research in young mixed-species tree plantations of the BEF-China project (Li et al., 2014).
Data set A is a sample set of 13 young Norway maple (Acer platanoides) trees, each one scanned from four nearly rectangular scanner positions. Afterwards, the trees were destructively harvested for a direct volume analysis. Furthermore, all scanned trees as well as their representing point clouds were separated in different components (stem, branches) to make a meaningful comparison. The point clouds were separated interactively using the software CloudCompare, to ensure the same size to the cut components. Data set B is a subset of two trees (Figure 1 - T2 and T6) of data set A, which were scanned twice from almost the same viewing directions for a repeatability analysis.
3. METHODS
The processing scheme consists of three processing steps. A similar algorithm was presented by Hosoi et al. (2013) to estimate the wood volume by considering the empty space inside a point contour. For an optimized result, the algorithm is applied to a filtered tree point cloud without stray points (as they frequently occur in the data of certain scanners). If a leaf-off scanning cannot be performed, the leaves may be filtered out analysing the point density and distribution inside a medium scale voxel size, making use of the fact that the voxels including stem and large branches are characterized by a high point density and a spatial arrangement which describes a curved area.
3.1 Voxel-based algorithm
3.1.1 Bounding box generation
At first, a voxel space with a voxel size svoxel smaller than the
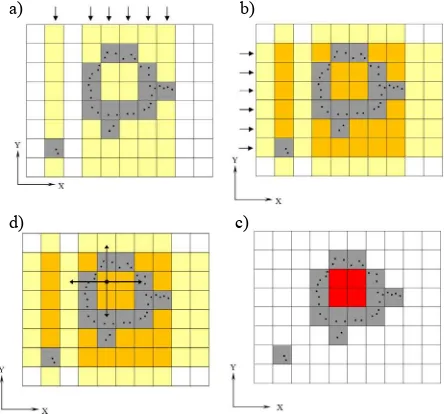
maximum stem diameter is calculated using the method outlined by Bienert et al. (2010). All points are allocated to an individual voxel ci. As one can see in Figure 2a, the use of the
voxel volume of the outer hull will lead to an overestimation, caused by volumes of voxels only partly filled with points. Therefore the voxel volume has to be adjusted to the actual point distribution. For that purpose, an axis-parallel bounding box is determined for each voxel (Figure 2b), given that enough points are included and a 3D-volume is spanned. This step is crucial to adjust the volume to the space which is actually filled.
Figure 2. a) Voxel space with filled voxels containing at least one point; b) Axis-parallel bounding boxes of the filled voxels.
a) b)
T1 T2 T3
T4 T5 T6 T7
T8 T9 T10
T11 T12 T13
3.1.2 Identification of occluded voxels
The second step addresses the identification of the occluded (inner) voxels (Figure 4a). These occluded cells are identified by sweeping in horizontal layers X- and Y-direction of each filled voxel, similar to the method of Hosoi et al. (2013). Starting with the first filled voxel ci(X,Y,Z), the Y-direction is
analysed, running through the complete range (Ymin≤ Y ≤ Ymax).
Passing an empty voxel increases its counter l inside the column (yellow voxels in Figure 3a). Afterwards, the X-direction for the remaining filled voxels is checked. The same procedure is repeated for filled voxels in the X-direction (Figure 3b). Hereafter the next horizontal layer is processed.
Those voxels that have been labelled twice and have a counter l=2 (orange voxels in Figure 3c) are regarded as potentially occluded voxels. A second check is performed, analysing the neighbourhood of the potential candidates (Figure 3d). Inside a preset radius r, which depends on the largest stem radius of the tree, the neighbouring voxels are checked. Starting with a voxel candidate the X- and Y-direction is checked. The cell is occluded if the neighbouring cells are labelled with the counter l=2 and/or a filled voxel is noted in each direction. If one empty voxel (l=0 or l=1) is recognized, the candidate is not occluded. In comparison to a classical 3D mathematical morphology, this approach is insensitive for grouped or single voxels next to the stem contour (due to branches or noisy points).
Figure 3. Identification of the occluded voxels: a) Scanning in Y-direction; b) Scanning in X-direction; c) Checking of the candidates; d) Occluded voxels.
3.1.3 Bounding box expansion
Finally, the bounding boxes have to be expanded to the side-face of a recognized neighbouring shadowed or filled voxel, as the bounding box method will lead to gaps between bounding boxes in neighbouring voxels. By checking the nearest neighbours of all filled voxels (white voxels in Figure 4a), the sides to the adjacent filled or shadowed neighbor voxels are identified. As soon as a filled or occluded voxel is recognized, the size of the bounding box is enlarged to the side-face. Thus, the bounding boxes join each other without empty space between the cells.
Figure 4. a) Bounding boxes with gaps and occluded voxels; b) Expanded bounding boxes with occluded voxels (red).
3.2 Volume estimation via voxels
3.2.1 Voxel volume method VVox
As mentioned above, the simplest way to estimate a tree volume is adding up the volume of all filled voxels, independent on the number of points therein. The determined volume VVox (Eq. 1)
depends on the utilized voxel size svoxel. Generally, an
overestimation with the volume has to be assumed.
)
3.2.2 Bounding box and occluded voxel volume Vtotal
The total volume Vtotal represents the wood volume of the tree
(Eq. 2). It composes the sum of all bounding box volumes VBB
of the filled voxels (Eq. 2a, 2b) and the sum of all occluded voxel volumes VShadow (Eq. 2c).
... unit voxel volume no ... number of occluded voxels
3.3 Reference volume estimation via xylometry methods
The direct volume measurement (in the following referred to as VRef) was performed by cutting the tree into pieces and placing
the branch and trunk components into a water tank (Figure 5). The displaced water ran off via an overflow pipe and was collected. By measuring the weight of the collected water, VRef
was determined. This method is very precise because trunk and branch discontinuities (knots, grooves etc.) are considered. For both trees (T2 and T6), the reference volume VRef was
obtained separately for the trunk, the branches and the complete tree.
Figure 5. Experimental set-up. (C. Hess, Leuphana University Lüneburg)
3.4 Volume estimation via frustum segments
For the reference volume estimation via frustum segments (Figure 6), diameter measurements along the trunk were taken with a calliper at 20 cm intervals. The trunk is represented by a number of frustums with a height hf= 20 cm. Using the radius
of the bottom area R1 and top area R2 of the frustum, the volume
VFru is determined (Eq. 3). The frustum modelling comprises
only the trunk without branches.
) (
3
/ R12 R1R2 R22 h
VFru f Eq. 3
where: hf ... frustum height
R1 ... radius of bottom area
R2 ... radius of top area
Figure 6. Frustum of a cone.
4. RESULTS
A first test was performed with different voxel sizes. Figure 7 shows the steps of voxel generalisation using the example of tree T3 under leaf-off conditions. Due to the size of the stem diameter, a small voxel size (i.e., 0.5 cm or 1 cm) visually suits best to represent the tree volume.
Figure 7. Steps of generalisation with missing laser scanner points due to filtering. From left to right: Point cloud of a tree; voxel spaces overlaid with point cloud (voxel size: 0.5 cm, 2 cm, 4 cm).
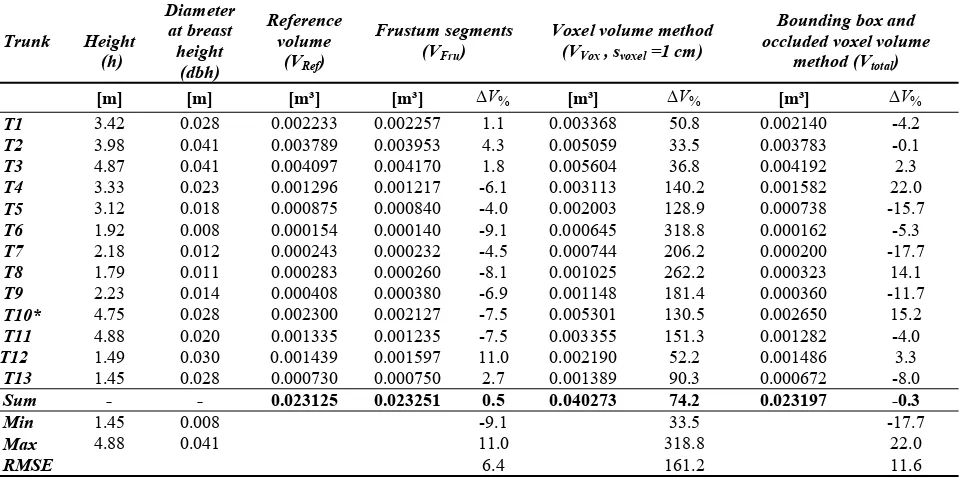
The results of the analysed trunks of data set A are shown in Table 1. The table lists h, dbh and the four volume determinations (VRef, VFru, VVox, Vtotal) for all scanned trees with
the minimum and maximum differences and a root mean squared error (RMSE) compared to the reference volume. The deviation V% = VMethod -VRef is also depicted. It was found
that VFru matches VRef well with slight over- and
underestimations ranging from -9.1% to 11.0% (RMSE = 6.4%).
As expected, an extreme overestimation (47% up to 383%) was obtained for the VVox with a small voxel size of svoxel= 1 cm.
% V
strongly increases with decreasing dbh. The volume VVox
of the trunks are always overestimated, even when occluded inner stem voxels are not considered.
A more accurate volume determination was determined by using the expanded bounding boxes and occluded voxel volumes compared to the reference volume (V% from -17.7% up to 22.0% with a RMSE of 11.6%). With an approximately normal distribution of the deviations, the sum of the Vtotal of all
13 trunks deviates from VRef by only -0.3%.
Figure 8. Percentage deviations ΔV% of the trees Ref
Ref
total V V
V
V%100( )/
.
Figure 8 presents the results of the volume determination of the complete tree point clouds compared to VRef. The error of the
sum of the total volume of all trees, obtained by summing the volumes Vtotal of each tree and compared with the sum VRef of
all trees, is 6.8% with a RMSE of 18.5%.
The results of the direct volume measurements (via xylometry and via calliper measurements) for data set B are depicted in Table 2. It is shown, that VFru of the trunk T2 is slightly
overestimated (4.3%) and the trunk T6 is underestimated (-9.1%) in comparison with VRef.
Method Volume
Data set B1 Tree T2
[m³]
Data set B2 Tree T6
[m³]
VFru Trunk 0.003953 0.000140 VRef Trunk 0.003789 0.000154 VRef Branches 0.001854 0.000018 VRef Tree 0.005643 0.000172
Table 2. Direct volume measurements of data set B; VRef =
volume determination via xylometry, VFru= volume
determination via frustum modelling.
The following tests are divided in volume analyses regarding the different tree components (trunk, branches, complete tree) separately to assess the quality of the results. Table 3 presents the percentage volume differences (V% = Vtotal-VRef) of the
trees T2 and T6 for two scan epochs. The volume determination of the trunks shows high congruence between the two scan epochs. In contrast, the volume determinations of the branches yields large deviations. In general, an overestimation would be expected, but the two trees have very thin branches, and some of the laser scanning points were eliminated in the point cloud filtering to eliminate the scanner specific stray points (see Figure 7, arrows). This results in an underestimation of the volume. The determination of the total tree volume yields differences of -12% up to 20% for T2 and -12% up to 8 % for T6. It has to be noted that Vtotal of the tree was obtained by
processing the whole point cloud, i.e., it is not the sum of the trunk and the branch volume. Summarizing, the test showed a repeatability of about 10% for wood volume.
Tree parts Volume differences
T2_a T2_b T6_a T6_b
[%]
[%]
[%]
[%]
Trunk Vtotal -VRef -0.1 -8.1 5.3 -5.5 Branches Vtotal -VRef 70.1 -21.5 -61.1 -80.2 Tree Vtotal -VRef 19.8 -12.5 8.0 -12.6Table 3. Volume differences of data set B for Vtotal -VRef split
into trunk, branches and tree. _a indicates scan epoch 1 and _b indicates scan epoch 2.
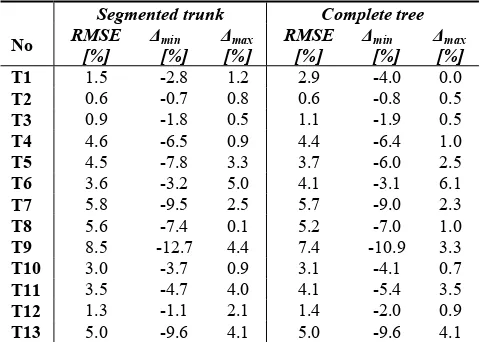
Another test was performed to show the dependency of the results on the orientation of the voxel structure in the point cloud. Using an axis-parallel bounding box to determine the contour of a point cloud slice does not always present the minimum volume depending on the orientation of the points inside the coordinate system. To estimate the effect of this, a stepwise rotation (Δα = 15°) of the point cloud around the Z-axis was performed to simulate different point distributions inside a voxel and its obtained volumes. The average V% (Eq. 4) of all rotated volumes n (23 per tree) to the initial volume (α = 0°) was calculated. The RMSE, the minimum and maximum volume differences are shown for each trunk and tree in Table 4.
As shown in Table 4, the influence of the orientation of the scan data show average volume values with a maximum RMSE of 8.5% for trunk T9 and 7.4% for tree T9. Analysing the minimum and maximum deviations show that the determined volumes vary up to 13% (disregarding tree T9) . The analysis shows a dependency on the data set orientation, which is recognizable, but significantly smaller than the overall accuracy of the method.
* due to tree movement the tree structure was mapped twice
Table 1. Volume determinations of the trunks of data set A via frustum segments (VFru), voxels (VVox) and bounding boxes with
occluded voxels
(
Vtotal)
of the trunks of young Norway maple trees compared with the reference measurements (VRef). The International Archives of the Photogrammetry, Remote Sensing and Spatial Information Sciences, Volume XL-5, 2014Table 4. RMSE and the minimum and maximum deviations of the average rotated volume differences to the initial volume (α = 0°) per trunk and tree.
5. DISCUSSION
This non-destructive method allows for an automatic volume determination of wooden parts of a tree. It is an objective technique without errors made by humans during measuring. As stated in Hosoi et al. (2013), a major advantage can be seen in the fact that the stem shape is not approximated by symmetrical bodies, allowing to take account of the real stem shapes with irregularities.
For identifying the occluded voxels accurately, the method needs closed contours of stems and branches as input data. That means that a complete 360° scan of the tree has to be captured, i.e. multiple scans and a data registration have to be performed. At least at one position the scanner has to be levelled during recording. Concerning the weather conditions, it has to be windless (always necessary when scanning in forests). Preferably, the trees should be recorded under leaf-off conditions to avoid occlusion by the leaves. In leaf-on conditions there will be a total loss of information in scanning especially of fine branches due to massive occlusion by leaves. The results in Table 3 demonstrate a good repeatability of the method of about 10% for the trunk volumes. After separating the point cloud in trunk and branches, holes remain at the location of the branch. This results in an underestimation because of lacking wood structure. A variable object size results in different voxel spaces (voxel space definition via bounding box of the complete point cloud) with different filled voxels and volumes. That is a reason why the volume of the processed tree point cloud differs from to the sum of the partially processing (Table 3). Nevertheless, a sample set of only two point clouds per tree for testing the repeatability is very definitive. The number has to be enlarged in future studies. It was shown, that the orientation of the point cloud influences the volume determination. Maybe a transformed bounding box instead of an axis-parallel orientation, along the principal components suits better for the volume results of the outer voxels. Also the scan registration affects the accuracy. Open stem contours, due to registration errors, may affect the number of the occluded voxels.
Finally, the results show a good agreement with the total wood volume, despite that some candidates show large deviations. It has to be noted that a very precise method was chosen as reference. When comparing the method with conventional methods (calliper measurements, taper equations), which also show deviations from the reference, the results become even
better. Overall, the method is suitable for a relative volume analysis of wooden structure to determine the vegetation growth over several years. Thus, the error has not much impact during the usage of volume differences.
6. SUMMARY
The paper presents an algorithm to estimate the wood volume of trees using a voxel-based method which avoids overestimation of the volume. The method works with a (filtered) tree point cloud in a horizontal coordinate system. The results show good agreements with the reference measurements via xylometry methods. A sum of all trunk volumes of -0.3% with a RMSE of 11.6% indicates a slight underestimation of the method. In general, the results are influenced by the scan registration, the tree structure and tree orientation. Under good scan conditions, the laser scanner derived volume accuracy is comparable with frustum segments measurements, which are established in forestry. Future work should evaluate the potential of alpha shapes or other 3D convex hull techniques applied to the segmented point clouds. Practical tests will also apply the method to other tree species, tree sizes and voxel sizes.
REFERENCES
Dassot, M.; Colin, A.; Santenoise, P.; Fournier, M. & Constant, T., 2012. Terrestrial laser scanning for measuring the solid wood volume, including branches, of adult standing trees in the forest environment. Computers and Electronics in Agriculture, 89, pp. 86–93.
Hosoi, F.; Nakai, Y. & Omasa, K., 2013. Voxel tree modeling for estimating leaf area density and woody material volume using 3-D lidar data. In: IAPRS, Antalya, Turkey, Vol. II-5/W2, pp. 115–120.
Hopkinson, C.; Chasmer, L.; Young-Pow, C. & Treitz, P., 2004. Assessing forest metrics with a ground-based scanning lidar.
Canadian Journal of Forest Research, 34, pp. 573–583.
Kankare, V.; Holopainen, M.; Vastaranta, M.; Puttonen, E.; Yu, X.; Hyyppä, J.; Vaaja, M.; Hyyppä, H. & Alho, P., 2012. Individual tree biomass estimation using terrestrial laser scanning. ISPRS
Journal of Photogrammetry and Remote Sensing, 75, pp. 64–75.
Li, Y.; Hess, C.; von Wehrden, H.; Härdtle, W. & von Oheimb, G., 2014. Assessing tree dendrometrics in young regenerating plantations using terrestrial laser scanning. Annals of Forest
Science, INRA and Springer-Verlag France 2014.
Maas, H.-G.; Bienert, A.; Scheller, S. & Keane, E., 2008. Automatic forest inventory parameter determination from terrestrial laserscanner data. International Journal of Remote Sensing, 29(5), pp. 1579–1593.
Moskal, M. & Zheng, G., 2011. Retrieving Forest Inventory Variables with Terrestrial Laser Scanning (TLS) in Urban Heterogeneous Forest. Remote Sensing, 2012, 4, pp. 1–20.
Pueschel, P.; Newnham, G.; Rock, G.; Udelhoven, T.; Werner, W. & Hill, J., 2013. The influence of scan mode and circle fitting on tree stem detection, stem diameter and volume extraction from terrestrial laser scans. ISPRS Journal of Photogrammetry and
Remote Sensing, 77, pp. 44–56.
Thies, M. & Spiecker, H., 2004. Evaluation and future prospects of terrestrial laser scanning for standardized forest inventories. In:
IAPRS, Freiburg, Germany, Vol. 36, Part 8/W2, pp.192–197.
Watt, P.J.; Donoghue, D.N.M. & Dunford, R.W., 2005. Measuring forest structure with terrestrial laser scanning. International Journal
of Remote Sensing, 26(7), pp. 1437–1446
Segmented trunk Complete tree No RMSE