TOWARDS AUTOMATIC SEMANTIC LABELLING OF 3D CITY MODELS
M. Rook∗, F. Biljecki, A. A. Diakit´e
3D Geoinformation, Delft University of Technology, Delft, The Netherlands
KEY WORDS:3D city model, semantics, classification, CityGML, 3D GIS
ABSTRACT:
The lack of semantic information in many 3D city models is a considerable limiting factor in their use, as a lot of applications rely on semantics. Such information is not always available, since it is not collected at all times, it might be lost due to data transformation, or its lack may be caused by non-interoperability in data integration from other sources. This research is a first step in creating an automatic workflow that semantically labels plain 3D city model represented by a soup of polygons, with semantic and thematic information, as defined in the CityGML standard. The first step involves the reconstruction of the topology, which is used in a region growing algorithm that clusters upward facing adjacent triangles. Heuristic rules, embedded in a decision tree, are used to compute a likeliness score for these regions that either represent the ground (terrain) or a RoofSurface. Regions with a high likeliness score, to one of the two classes, are used to create a decision space, which is used in a support vector machine (SVM). Next, topological relations are utilised to select seeds that function as a start in a region growing algorithm, to create regions of triangles of other semantic classes. The topological relationships of the regions are used in the aggregation of the thematic building features. Finally, the level of detail is detected to generate the correct output in CityGML. The results show an accuracy between 85% and 99% in the automatic semantic labelling on four different test datasets. The paper is concluded by indicating problems and difficulties implying the next steps in the research.
1. INTRODUCTION
To carry out several 3D GIS analyses, semantic information is re-quired. Semantics is information about what a surface represents in the real world. For example, a surface may be attached the information that it represents a wall, a terrain, or a roof surface. This information is useful in different domains and applications, such as flood modelling or disaster management (van Oosterom et al., 2006; Biljecki et al., 2015), data harmonisation (van Oost-erom and Zlatanova, 2008) and real estate evaluation and taxation (Vosselman et al., 2001; Boeters et al., 2015).
Currently, many 3D city models are available as a collection of polygons representing unstructured geometry and lacking seman-tic meaning. While such models may still be valuable for visu-alisation and other purposes, their full potential in 3D GIS anal-yses is hindered by the lack of semantics (Brodeur, 2012). For example, in such datasets the geometry of a building is not differ-entiable from the geometry of a road, hence it is not possible to identify the surfaces of interest, e.g. roof surfaces to estimate the solar irradiation, or walls to calculate the total facade area.
Some 3D model generation techniques allow straightforward se-mantic enrichment of data. However, in many cases models do not have semantic information because it is simply not stored, it is lost due to data transformation, or it is absent due to the lack of additional information. Therefore, semantic enrichment, i.e. adding of semantic information to the geometry, is necessary to create models that meet the requirements of relevant applications (Henn et al., 2012). As nowadays many 3D models are already available but do not contain semantics, the proposed methods can help to make these models useful in an additional range of ap-plications. As a result of that, the added semantic information brings new possibilities for leveraging their usability (Stadler and Kolbe, 2007).
This research aims to solve the problem of missing semantic and thematic information in 3D city models, by developing a method
∗Corresponding author at [email protected]
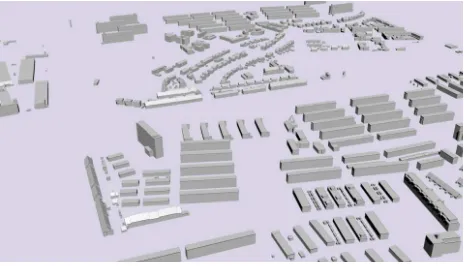
Figure 1: 3D city model of Rotterdam without semantic informa-tion.
to automatically enrich 3D city models with semantic and the-matic information, as defined by the CityGML standard. In this labelling process, a polygon mesh or a soup of polygons (Fig-ure 1) serves as input and generates a model, whereby the dif-ferent spatial features (walls, terrain, roofs and building ground) are recognised, distinguished, and structured in such a way that serves the creation of a semantically rich, 3D city model stored in CityGML. The goal is to infer the different semantic classes together into single building entities and creating the thematic building class entities, following their CityGML definitions.
2. RELATED WORK AND BACKGROUND
detect openings of buildings to enrich CityGML models. While the work focuses on detecting the features in imagery rather than from the geometry of 3D models, it is relevant to mention because it involves CityGML models.
This section elaborates on papers that focus on semantically en-riching 3D city models. Next, it introduces the parts of CityGML relevant for this paper, as the standard serves as a guide in defin-ing the semantic classes.
2.1 Semantic enrichment of vector data
Verdie et al. (2015) create a workflow that produces a semanti-cally rich 3D city model from a triangular mesh. The classifi-cation step relies on a Markov Random Field, in order to distin-guish between four classes: ground, trees, facade and roof. The method is unsupervised and only uses geometric attributes. In the research, no isolated triangles are used in the classification process. Instead, super-facets are used, that are sets of connected triangles with the same characteristics, also referred to as regions. The ground class is characterized by locally planar surfaces, that are located below the other classes. Trees have curved surfaces. Facades are vertical surfaces, that are adjacent to roofs and are composed of planar surfaces.
Diakit´e et al. (2014) propose an approach that is based on a prop-agation method, directed by heuristic rules, in order to retrieve semantics of the building components. The approach takes vec-tor data as input. The C-Map data structure is used to reconstruct the topological relations. The process entirely relies on heuris-tic rules, which combines topological and geometrical criteria, which gives the flexibility to define as much rules as desired, whereby only geometry is initially required. The different se-mantic classes are: fac¸ade, wall, ground floor and roof.
2.2 CityGML
CityGML is a standard for storing and exchanging 3D geographi-cal data and its semantics. The standard specifies the geometrigeographi-cal and semantic aspects of 3D city models. The objects are speci-fied by a thematic class (Gr¨oger and Pl¨umer, 2012). The thematic class taxonomy distinguishes between different objects, such as: buildings and other man-made objects, waterbodies and vege-tation. The most detailed thematic class is the building model, which has a central thematic class: the AbstractBuilding, which is specified to either a Building or to a BuildingPart, which again are part of the class AbstractBuilding (OGC, 2012).
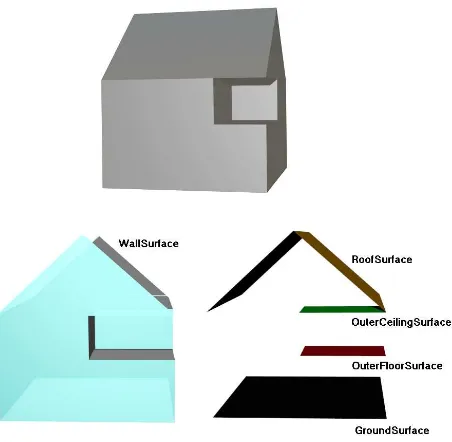
The building class comprises different semantic classes: Ground-Surface, WallGround-Surface, RoofGround-Surface, OuterFloorGround-Surface, Outer-CeilingSurface, and so on (SIG3D, 2015). These classes are de-picted in Figure 2, and their granularity depends on the level of detail (LoD) of the model.
The spatio-semantic properties of buildings are tied to five differ-ent LoDs (Kolbe et al., 2005; Gr¨oger and Pl¨umer, 2012), which reflect the degree of the model’s adherence to its corresponding subset of reality (Biljecki et al., 2014). In other words, LoD describes how close the virtual representation reflects the actual real-world scene, and this notion includes also the spatio-semantic coherence (Stadler and Kolbe, 2007). Five LODs are defined in the CityGML standard:
LoD0:2.5D building footprints with optionally roof edge
poly-gons.
LoD1: Extruded footprints (prismatic models), represented as
block models. In other words, a vertical extruded solid, with-out semantic boundary surfaces.
Figure 2: Semantic BoundarySurfaces classes of an LoD2 model in the CityGML standard.
LoD2: Simple models with differentiated WallSurface, RoofSur-face, GroundSurRoofSur-face, OuterFloorSurRoofSur-face, and OuterCeilingSur-face.
LoD3: Detailed architectural models with, additionally to LoD2, openings such as windows and doors.
LoD4: Basically an LoD3 model with indoor features.
2.3 Research goals
As elaborated on in the previous section, CityGML gives a com-prehensive framework for the semantic classes which we use in our labelling process. Besides the semantic structuring of bound-ary surfaces, we also consider the thematic classification (e.g. a set of surfaces is a building or a bridge). However, this work defines a simplification of the CityGML semantic class taxon-omy (OGC, 2012), where the earlier described classes (Figure 2) OuterCeilingSurface and OuterFloorSurface are labelled as Roof-Surface or GroundRoof-Surface, depending on the height of these re-gions. This is due to the complexity of distinguishing the afore-mentioned classes in the inferring process. Thereby, this research aims at recomposing the different semantic classes into single buildings, composing thematic building class entities. The se-mantic labels of the thematic building class depend on the LoD of the 3D city model:
LoD1: In models with LoD1, the labelling process will aim at
adding thematic information to Buildings only. This means clus-tering the different BuildingParts together, forming a CityGML feature with class AbstractBuilding and Building. The Building-Parts will not be labelled separately. Thereby, the terrain is the-matically labelled.
LoD2: In models with LoD2, the labelling process will aim at
adding thematic information to Buildings and BuildingParts. This means clustering the different BuildingParts together, forming a CityGML feature with class AbstractBuilding and/or Building. Thereby, semantic information to the RoofSurface, WallSurface and GroundSurface are stored (the latter should not be confused with the surfaces representing ground/terrain). Separately, the terrain is thematically labelled.
research, and are a subject of future work. However, the method can be used to at least partially infer their semantics.
2.4 Challenges
In the course of this research, a number of challenges are identi-fied, partially from the work of related researchers and from our preliminary experiments:
Complexity of the semantic classesThe normal of the surfaces
in the 3D city model plays an important role in the classification of 3D data, as a fair share of semantic information can be inferred just by analysing the orientation of the surface. However, classi-fication solely based on the normals of the triangles is not robust. Figure 2 demonstrates that the classes GroundSurface, RoofSur-face, OuterFloorSurRoofSur-face, and OuterCeilingSurface cannot be dis-tinguished by only considering the surface normals. Therefore, a method has to be devised where a class assignment depends on the relationship with surrounding spatial features. Furthermore, there is a conflict across different thematic classes: a RoofSurface of a flat roof may have the same orientation as the flat ground sur-rounding the building.
TopologyTherefore, the topological relations have to be
recov-ered to obtain additional insights that may hint at the semantic of a surface. After inspecting the test models (to be introduced later), it turned out that these topological relations are not al-ways directly retrievable. Some models contain double vertices, where others hold gaps between adjacent triangles. Other cases which cause missing topological relationships are floating roofs, or roofs that are not connected to a wall. This topic is researched by Ledoux (2013), investigating the validation of solids, and giv-ing different examples of (in)valid primitives. For example, a solid is invalid when it overlaps with another solid. Another ex-ample of a case relevant to ours is when two adjacent triangles do not share the same points and edge, hindering the creation of the topology. These aspects cannot be avoided since real-world models are virtually never error-free.
Semantic content and LoD detectionTo correctly classify all
the semantic classes in the 3D city model, the algorithm must first recognise the content of the different semantic classes. This scanis required because the labelling process should automati-cally realise what classes it has to classify. For instance, among the different selected models that are used to test the algorithm, some models have a terrain, while others do not. Therefore, some buildings in the different models have a BuildingInstalla-tion which represent dormers or chimneys, while other models only contain roofs, walls, together forming a Building. These features have to be recognised, in order to make a valid classifi-cation. The generated output also depends on the LoD of the 3D city model, i.e. it makes no sense to classify semantic boundary surfaces in an LoD1 dataset. Therefore, the LoD of the model should also be detected. However, automatically detecting the LoD of the model is also one of the main challenges in this prob-lem, due to different reasons such as the ambiguity of the defini-tions (Benner et al., 2013; Biljecki et al., 2016).
Lack of thematic definition Building and AbstractBuilding
The datasets which are used share no consistency in the geo-metric aggregation of the classes Building and AbstractBuilding. Or, as explained in the OGC CityGML standard (OGC, 2012): “CityGML allows many different alternatives for modeling. This is an obstacle in the validation process, because it is not unam-biguously defined what validity actually means without further specification”. For example, the elements Building and Building-Part can be modelled in three different ways: as a single solid, a composite solid or as one single multi surface geometry. All the
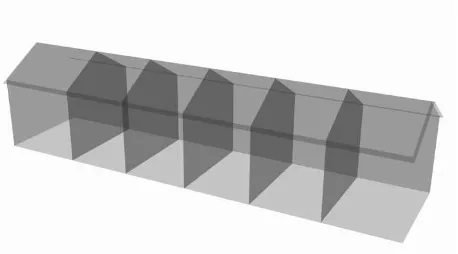
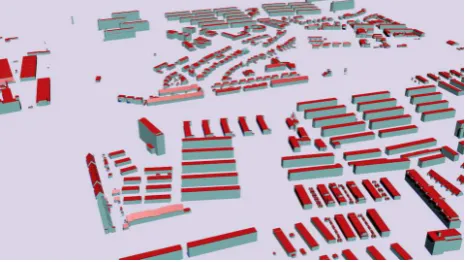
three options are valid in the CityGML standard (OGC, 2012). Thereby, the aggregation of Buildings and BuildingParts is not only based on geometrical properties and can therefore not be ag-gregated by geometrical properties only. Figure 3 depicts a case which shows the challenge of recognizing and aggregating dif-ferent Buildings into one AbstractBuilding. The Buildings in this single model can be aggregated as one AbstractBuilding, but can also be stored separately. Both approaches are correct.
Figure 3: Aggregation of Buildings and AbstractBuilding (case of terraced houses).
This obstacle makes it hard, or impossible, to reconstruct the thematic aggregations and information from the original 3D city model.
Machine learning and the lack of training dataThis automatic
labelling (classification) process falls under the umbrella of ma-chine learning, i.e. automated detection of meaningful patterns in data (Shalev-Shwartz and Ben-David, 2014). Machine learn-ing can roughly be categorised in supervised and unsupervised classification. The idea behind supervised classification is to au-tomatically derive classification rules from a training dataset, so that the classification can be performed automatically. The term reference data, or training data, refers to data that is manually classified by humans, and it is used as input to set up the classi-fication. In unsupervised learning there is no distinction between training and test data, or training data is not available (Waldhauser et al., 2014). The goal of fully automating the labelling process means that training data is not available. This demands a two step approach where, in the first place, the algorithm independently recognises, selects and processes the training data, and secondly, the classification process uses the training data to classify the ex-amples.
3. SEMANTIC ENRICHMENT PROCESS
This section describes the methodology. First, the architecture of the algorithm is presented. Second, the main concepts are ex-plained, followed up by the heuristic rules that the method uses to come to a classification. Finally, the labelling process and the LoD detection are described.
ArchitectureThe labelling process takes a triangulated polygon
X : loat Y : loat Z : loat Neighbours : list
Vertex
Vertex_1 : Vertex Vertex_2 : Vertex Vertex_3 : Vertex Centroid : Vertex Normal_X : loat Normal_Y : loat Normal_Z : loat Neighbours : list Hypotenuse : Boolean Upward : Boolean Ground : Boolean Roof : Boolean Wall : Boolean Building_ground : Boolean
Triangle
Centroid : Vertex Collection : list Class : string
Region
Parts : list Roof_parts : list Wall_parts : list Ground_parts : list
Object
A Region is a Collection of Triangles
An Object is a Collection of Regions,
together forming a building
Figure 4: UML diagram or our structure. The list in Vertices contains the neighbours—the vertices that are within the distance range of the set threshold.
Region growingA region is a cluster of adjacent triangles that
have a similar orientation and height. Using regions instead of individual triangles has some benefits. First, it gives way to ex-ploit the topological relations, in order to aggregate the different semantic classes into single AbstractBuilding entities. For exam-ple, recognising the WallSurfaces, by exploiting their adjacency to a roof surface, facilitates the storage of this relationship. This relationship can later be used to create the individual thematic AbstractBuilding entities. Second, by using regions instead of individual triangles, more information can be extracted, for ex-ample: the number of triangles in one region or deviations in height or curvature. This additional information is used in the semantic classification.
Decision tree learningThe semantic classification is based on
classification decisions. These decisions are embedded in a de-cision tree. Dede-cision tree learning is a widely used and practi-cal method that works best for classification problems with con-clusive and decisive classes (Mitchell, 1997). The classification problem in this research satisfies this condition, as the classes are well defined and explicit. A decision tree classifies instances by sorting these instances down a tree, where the end node, a leaf, assigns a semantic class (Mitchell, 1997).
Heuristic rulesThe decision tree is based on a logic that is
de-fined through heuristic rules, ordered in the decision tree. Heuris-tics stands for strategies that use available and accessible infor-mation to control or improve problem-solving processes or deci-sions by humans or in man-machine interaction (Pearl, 1984). In heuristics, the use of the general knowledge, or knowledge gained by experience, is used to do a classification. In our approach we relied on mainly on the five following heuristic rules:
1. A roof is an exterior region and is the upper boundary sur-face of a building, building part or building installation (SIG3D, 2015). Roofs are always situated above all ground regions in its local neighbourhood.
2. The terrain region is always situated below the roof region in its local neighbourhood.
3. A wall surface is an exterior, lateral boundary surface of a building, building part or building installation (SIG3D, 2015). Walls are always situated between the terrain region and a roof region.
4. A building ground surface is always aligned under a building roof surface and is connected to at least one wall region. The building ground surface is always horizontally planar.
5. A building always exist out of at least one roof region and one wall region.
These conditions and heuristic rules are embedded in the decision tree that is visualised in Figure 5, wherein the outcomes of the decisions are illustrated.
Figure 5: Decision tree of our method.
3.1 Labelling process
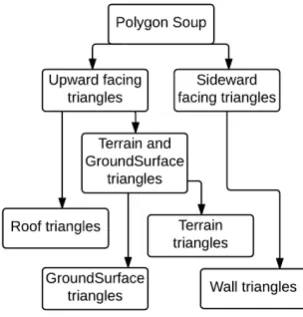
This section describes the workflow of the labelling process (Fig-ure 6). This workflow functions as a guideline in this section, wherein every step in the labelling process is explained sepa-rately.
Figure 6: Workflow of the labelling process.
Recreating the topologyBecause the 3D city model is created
out of triangles, a recovery of the topological relations is re-quired. After inspecting the models, as earlier described in the challenges, the topology of the different triangles in the model is not always stored, inconsistent or incomplete. To handle all these different cases, a one fits all method has to be devised. The proposed method reconstructs the topology through the use of a kd-tree (van Oosterom, 1999). This kd-tree takes all vertices coordinates as input, and returns a list for every vertex with its k nearest neighbours and the distance to those neighbours. In cases where the distance is zero, or close to zero, a double stored vertex gets amended. The problem of gaps is overcome through setting a threshold, where all k nearest neighbours of vertexX
than the threshold. The chosen threshold is set as 1/10 of the stan-dard deviation of the height of all vertices in the 3D city model. Next, for every triangle, all the neighbours of all three individual vertices are added to the list of neighbours.
Region growing of upward facing trianglesAfter
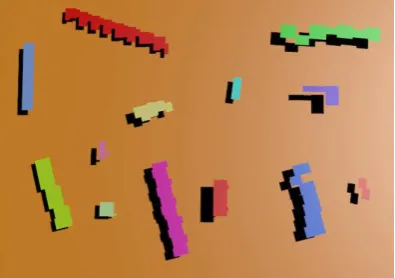
reconstruct-ing a topology, regions of triangles that face upwards are created. The constraints on which the region growing is based are the sur-face normal and the height difference of the vertices of the trian-gles, which should not exceed a set threshold. Figure 7 illustrates the grown regions.
Figure 7: The grown regions, where every region is assigned a different colour.
The decision to first recognise roofs and terrain is based on the possibility to add more constraints to the region growing or in se-lecting the regions to be either classified as terrain or roof. These additional constraints in selecting the triangles could be added to filter out other classes such as trees.
Distinguishing between ground and roof regionsThe regions
which consist of upward facing triangles can either represent a RoofSurface, the terrain or a GroundSurface. Mostly, the terrain and GroundSurfaces are grown as one single region, from now referred to as the ground, and will be differentiated later on in the process. This step differentiates between the ground and the RoofSurfaces.
In some models, the whole ground is grown as one region, while in other models this was not the case. Therefore a distinction is made that is based on the relative size of the ground region, compared with the total number of all upward looking triangles. More concrete, if the biggest region contains more than 30 per-cent of all upward looking triangles, it is automatically defined as the terrain surface.
To further classify the regions, the heuristic rule that roofs are always situated above all ground regions in its local neighbour-hood is used. In order to get correct results in flat as well in mountainous environments, the absolute height cannot be used. This is depicted in Figure 8, where classification on the abso-lute height would lead to misclassifications. Therefore, the local neighbourhood is used to come to a classification, where a local height threshold is used to come to a likeliness score.
This score is reckoned by analysing if a region is more likely to represent a ground surface or a roof surface by setting a thresh-old. This threshold is calculated by computing the average height of the ten highest and the ten lowest vertices in the local neigh-bourhood. Next, a score of one is added if the triangles centroid height is higher than the threshold and zero is the triangle centroid height is lower than the threshold. Every time a region is part of another regions local neighbourhood, a score is added to the score
Figure 8: 3D city model with large elevation differences.
list. These scores represent a probability for every region that in-dicates if a region is more likely to represent a RoofSurface or ground.
To retrieve a local neighbourhood, a centre point is assigned to all regions. These centre points, the centroids, form a simplification of the region and are used to find the k-nearest neighbours, or the local neighbourhood of the region. Here fore a kd-tree is used. This kd-tree only takes the x and y coordinates of the regions centres, creating a 2D local neighbourhood where the height is neglected.
In all models, the scores varied between 0 and 100 percent likeli-ness to both classes, and did, in most cases, not give a conclusive result to assign a class to the region. Therefore, a Support Vector Machine (SVM) classifier is used.
Support vector machineA SVM is a supervised learning
algo-rithm, whereby the aim is to automatically find regularities and patterns in data (Henn et al., 2012). The SVM uses training sam-ples to assign a class to a feature. These training samsam-ples are mapped to a high dimensional feature space. The SVM com-putes a hyper-plane, or a linear decision surface, which divides the set of training data in a way where all the points with the same label are on the same side of the hyper-plane. The basic principle is that the SVM finds the most optimal hyper-plane in a high dimensional feature space (Cortes and Vapnik, 1995). In this approach, the just computed likeliness score is used to create the training data and a set of examples, which will be classified with the training data. In the selection of the training data, a score higher than 70 percent likeliness is used as training data for roofs, while a score lower than 30 percent likeliness represents a terrain or BuildingGround surface. The SVM takes vectors as input from the training data, creating a non-linear decision space and maps the examples to assign them either the class roof or ground. The classification process in the RBF kernel makes use of the distance function (Pedregosa et al., 2011):
K(x, x′) = exp(−γkx−x′k2) (1)
A number of five region properties are tested and selected to cre-ate the vectors that are used to calculcre-ate the decision space. These properties are: the standard deviation of all height values in the region, the height of the regions centre and the total number of polygons in the region, as used by Verdie et al. (2015). Thereby, the sum of all normals in the height direction, divided by the total number of polygons in the region and the percentage of triangles with a 90 degree angle in the region, which are stored as a triangle attribute, are used.
Exploit topological relations for seed recognition: labelling
the WallSurfacesNext, the WallSurface regions are grown. The
Table 1: 3D city models used for testing the performance of the method.
Dataset Size (triangles) Size (Buildings) LoD
Rotterdam 57 581 1 544 2
Waldbruecke 12 157 606 2
New York 103 552 1 082 015 1
Switzerland 135 389 3 151 2
regions that represent a wall. A wall triangle always faces side-ways. The selected Wall triangle functions as a seed for region growing the Wall surfaces. In this first explorative approach, the Wall regions are grown without any constraints, adding all neigh-bours of the seed to the same region.
Exploit topological relations for seed recognition: labelling
the BuildingGroundFinally, after the classification of the Wall
regions, a new distinction is made in the earlier classified terrain polygons: BuildingGround surfaces are extracted, which form the floor in buildings. The recognition of these polygons is based on the heuristic rule that the building ground polygons are aligned under the roof triangles and can therefore only be done after a cor-rect classification of the roof polygons. The seeds which are used in extracting the building ground are recognized by iterating over the neighbours of the Wall triangles which are classified as ter-rain. For every vertex of this seed triangle, a point on point, point on line and point in triangle calculation is done with every trian-gle of the roof region. All three calculations are in 2D, netrian-glecting the height of the triangles.
Reconstructing the thematic featuresThe described seed
de-tection for the region growing approach allows the storage of the topological relationships of the different regions. These relations are used to aggregate the semantic classes into single buildings, creating the thematic AbstractBuilding class instances.
Detecting the LoD of the modelIn order to generate correct
output, the LoD of the model must be recognised. The LoD de-termines if semantic classes or only the thematic aggregations should be returned and stored. To recognise the LoD, the nor-malised surface normal of the roof triangles is used. Where a random triangle of every roof region is used as a threshold, next a deviation of the surface normal of all the other triangles in that re-gion, which is bigger than 0.02, leads to a classification of LoD2 for the complete model.
4. RESULTS AND ANALYSIS
In order to test the performance of the developed method, we have used a few datasets freely available as open data. The models used to test the methods are stored in CityGML. These models contain semantics, which are later used to validate the labelling process. In order to test the proposed methods, the models were stripped of semantic information and have been converted to OBJ, which contains only unstructured geometry (triangles).
We have used four datasets: the first model is a subset of Rotter-dam and contains houses and apartment buildings in LoD2. The second model is from the village of Waldbruecke in Germany, which contains small houses in LoD1 and LoD2. Third, the 3D model of Manhattan in New York City is used. This datasets in-cludes both high and low rise buildings in LoD1. Finally, a model of a city in a mountainous environment in Switzerland was used. Table 1 gives additional information about the number of trian-gles and buildings in the 3D city models for an overview. The sources of the models are mentioned in the Acknowledgements.
Table 2: Classification matrix: the total number of triangles, the number of classified and the number of unclassified triangles.
Dataset Triangles Classified Unclassified
Rotterdam 57 581 57 656 75
Waldbruecke 12 157 12 077 80
New York 103 552 103 479 73
Switzerland 135 389 134 578 811
In the continuation we elaborate on the results of the classification algorithm.
LoD detectionIn all models, the correct LoD was detected. The
proposed method is therefore a successful measure to distinguish between LoD1 and LoD2 in the selected models.
Semantic classificationTable 2 gives the number of total
classi-fied and unclassiclassi-fied triangles. Because selecting a triangle that operates as a seed in the wall region growing algorithm is based on a topological relationship with a roof triangle, a misclassifi-cation of a roof region leads to wall regions not being grown, because of non-selected and missed seeds. This leads to unclas-sified triangles and incomplete buildings. The total classification accuracy and the Kappa coefficient of the semantic classification for the different test models can be found in Table 3. This table shows a classification accuracy between 85 and 99%. This vari-ation can be explained by height devivari-ations in the models, which strongly affect the setting of the threshold in the topology recre-ating, causing multiple roofs and terrain regions being grown as one.
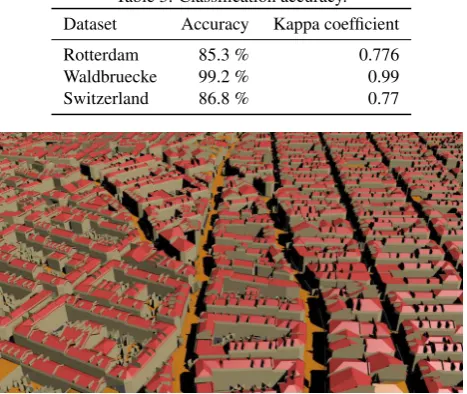
In some of the selected models, such as the 3D city model of Rot-terdam (Figure 9), which holds big height deviations, the higher buildings are mainly apartment buildings. These buildings usu-ally have a flat roof, while smaller houses have a sloped roof. Such difference leads roof regions being classified as ground by the SVM classifier, that in this case classifies the roofs of the houses, based on training data that originates from the apartment buildings.
Figure 9: Automatically semantically labelled 3D city model of Rotterdam.
Figure 10 shows a visualisation of a semantically enriched model of Paris, originating from a format other than CityGML. This model does not originally contain semantics and therefore it can-not be automatically validated. However, it serves as an illustra-tion of the successful classificaillustra-tion of terrain surfaces, and it hints at the core value of the work: taking a 3D model without seman-tics, enrich it with semantics using our automated approach, and produce a CityGML dataset increasing its usability.
Thematic aggregationThe number of Buildings and
Table 3: Classification accuracy.
Dataset Accuracy Kappa coefficient
Rotterdam 85.3 % 0.776
Waldbruecke 99.2 % 0.99
Switzerland 86.8 % 0.77
Figure 10: Semantically labelled 3D city model of Paris. The ter-rain polygons (orange) are thematically distinguished from build-ing surfaces.
proposed classification methods. Although the validity of the ag-gregations of Buildings and BuildingParts is not bound to abstract modelling rules, the proposed methods do not aggregate the dif-ferent features correctly. This is caused by the recreated topology, that, in some models, leads to multiple Buildings being aggre-gated as one AbstractBuilding, while the features do not share any adjacent spatial features (Figure 11). This particular error mainly appears in models with a big height variations, which leads to a too large threshold in the recovery of the topology.
Figure 11: Wrong aggregation of Buildings into one Abstract-Building.
5. CONCLUSIONS AND FUTURE WORK
We presented in this paper an approach enabling to thematically and semantically enrich a 3D city model, initially represented as a set of unstructured polygons, commonly found in 3D city mod-els stored in a format other than CityGML. This research is an initial step towards enhancing presently available 3D city mod-els without semantics in order to leverage them for an extended range of spatial analyses. While previous work mainly focuses on independently identifying structural elements of buildings, our methods follows the CityGML standard and elaborates semantic and thematic labelling of the buildings’ features with respect to the LoD of the input model. Our implementation was tested on several 3D city models and shows a satisfying accuracy, ranging from 85 up to 99%. We have thus shown that to some reasonable extent it is possible to automatically detect the theme of features
Table 4: Total number of aggregated AbstractBuildings.
Dataset Original dataset Classification algorithm
Rotterdam 1 544 618
Waldbruecke 606 248
New York 1 082 015 245
Switzerland 3 151 1 361
in a 3D city model and label their geometries with semantic infor-mation. Nevertheless, the research is at its early stage and several challenges have been exposed so several improvements can still be brought to considerably improve it. We discuss a few of them here as directions for future work:
LoD detectionAnalysing the normals of the roof (i.e. top surface
of buildings) is a simple but effective measure in the determina-tion of the LoD of the data. However, a model of LoD2 that holds buildings with only flat roofs will not be assigned the cor-rect class. Therefore, more measures need to be found to catch more cases and make the LoD classification more robust. Rec-ognizing details in the wall surfaces and measures to evaluate the complexity of the models can be valuable additions. Also, a higher density of geometric properties, vertices and triangles, could help in determining the LoD, even in higher levels of de-tail.
Topology recreationThe topology recreation gave good results
for the reconstruction of the missing topological relationships, the setting of the threshold needs improvement or a smarter ap-proach. Some experiments have been done, and show that taking a number of random triangles from the model, and use the small-estxlengths of these triangles to calculate the threshold gave better results.
Thematic aggregationThe approach of using region growing in
te reconstruction of the thematic entities is promising. To fur-ther improve this method, the available topological information should be utilised in order to increase the accuracy of the the-matic aggregation of the BuildingParts, forming the aggregations Buildings and the AbstractBuilding. The exploitation of this in-formation, if available, should also allow the reconstruction of the thematic aggregations from the original dataset.
Semantic classificationIn order to improve the semantic
classi-fication accuracy, a different order in which the different classes are labelled should be tested. The approach of first recognising the WallSurfaces seems to be a good alternative. In such way, the relative height of the different adjacent classes RoofSurface, GroundSurface and additionally OuterCeilingSurface and Outer-FloorSurface can be used to perform the classification.
ACKNOWLEDGEMENTS
The authors gratefully acknowledge the availability of the datasets used for testing the method: the Rotterdam3D dataset is freely available on the data portal of the City of Rotterdam (Gemeente Rotterdam, 2015). The 3D city model of Waldbruecke was ob-tained from the CityGML website (CityGML, 2015). The CityGML LoD1 data of New York City was made by Kolbe et al. (2015) and it can be downloaded from the website of the Chair of Geoinfor-matics of the TU Munich. The Switzerland dataset was obtained as sample data from the website of the Swiss Federal Office of Topography (Swisstopo, 2015).
References
models. ISPRS Ann. Photogramm. Remote Sens. Spatial Inf. Sci. II-2/W1, pp. 51–61.
Biljecki, F. and Arroyo Ohori, K., 2015. Automatic Semantic-preserving Conversion Between OBJ and CityGML. In: Eu-rographics Workshop on Urban Data Modelling and Visual-isation 2015, Delft, Netherlands, pp. 25–30.
Biljecki, F., Ledoux, H. and Stoter, J., 2016. An improved LOD specification for 3D building models. Computers, Environ-ment and Urban Systems 59, pp. 25–37.
Biljecki, F., Ledoux, H., Stoter, J. and Zhao, J., 2014. Formalisa-tion of the level of detail in 3D city modelling. Computers, Environment and Urban Systems 48, pp. 1–15.
Biljecki, F., Stoter, J., Ledoux, H., Zlatanova, S. and C¸ ¨oltekin, A., 2015. Applications of 3D City Models: State of the Art Review. ISPRS International Journal of Geo-Information 4(4), pp. 2842–2889.
Boeters, R., Arroyo Ohori, K., Biljecki, F. and Zlatanova, S., 2015. Automatically enhancing CityGML LOD2 models with a corresponding indoor geometry. International Jour-nal of Geographical Information Science 29(12), pp. 2248– 2268.
Brodeur, J., 2012. Geosemantic interoperability and the geospa-tial semantic web. In: Springer Handbook of Geographic Information, Springer, pp. 291–310.
CityGML, 2015. CityGML datasets. http://www.citygml. org/?id=1539.
Cortes, C. and Vapnik, V., 1995. Support-vector networks. Ma-chine learning 20(3), pp. 273–297.
Diakit´e, A. A., Damiand, G. and Gesqui`ere, G., 2014. Automatic Semantic Labelling of 3D Buildings Based on Geometric and Topological Information. In: Proceedings of the 9th 3DGeoInfo Conference 2014, pp. 49–63.
D¨orschlag, D., Gr¨oger, G. and Pl¨umer, L., 2007. Semantically enhanced prototypes for building reconstruction. Int. Arch. Photogramm. Remote Sens. Spatial Inf. Sci. 36(3/W49A), pp. 111–116.
Gemeente Rotterdam, 2015. Rotterdam 3D. http://www. rotterdam.nl/links_rotterdam_3d.
Gr¨oger, G. and Pl¨umer, L., 2012. Citygml–interoperable seman-tic 3d city models. ISPRS Journal of Photogrammetry and Remote Sensing 71, pp. 12–33.
Henn, A., R¨omer, C., Gr¨oger, G. and Pl¨umer, L., 2012. Automatic classification of building types in 3D city models. GeoInfor-matica 16(2), pp. 281–306.
Kolbe, T. H., Burger, B. and Cantzler, B., 2015. CityGML goes to Broadway. In: Photogrammetric Week ’15, Stuttgart, Ger-many, pp. 343–356.
Kolbe, T. H., Gr¨oger, G. and Pl¨umer, L., 2005. CityGML: Inter-operable access to 3D city models. In: Geo-information for disaster management, Springer, pp. 883–899.
Ledoux, H., 2013. On the validation of solids represented with the international standards for geographic informa-tion. Computer-Aided Civil and Infrastructure Engineering 28(9), pp. 693–706.
Mitchell, T. M., 1997. Machine learning. McGraw-Hill.
OGC, 2012. OGC City Geography Markup Language (CityGML) Encoding Standard 2.0. Technical Report OGC 12-019, Open Geospatial Consortium.
Pearl, J., 1984. Heuristics: intelligent search strategies for com-puter problem solving. Addison-Wesley Pub., Reading, MA.
Pedregosa, F., Varoquaux, G., Gramfort, A., Michel, V., Thirion, B., Grisel, O., Blondel, M., Prettenhofer, P., Weiss, R., Dubourg, V., Vanderplas, J., Passos, A., Cournapeau, D., Brucher, M., Perrot, M. and Duchesnay, E., 2011. Scikit-learn: Machine learning in Python. Journal of Machine Learning Research 12, pp. 2825–2830.
Pittarello, F. and De Faveri, A., 2006. Semantic description of 3D environments: a proposal based on web standards. In: Proceedings of the eleventh international conference on 3D web technology, ACM, pp. 85–95.
Shalev-Shwartz, S. and Ben-David, S., 2014. Understanding ma-chine learning: From theory to algorithms. Cambridge Uni-versity Press.
SIG3D, 2015. Modeling Guide for 3D Objects - Part 2: Model-ing of BuildModel-ings (LoD1, LoD2, LoD3).http://en.wiki. quality.sig3d.org/.
Slade, J. D., Jones, C. B. and Rosin, P. L., 2017. Automatic semantic and geometric enrichment of CityGML building models using HoG-based template matching. Vol. In press, Springer.
Stadler, A. and Kolbe, T. H., 2007. Spatio-semantic coherence in the integration of 3D city models. Int. Arch. Photogramm. Remote Sens. Spatial Inf. Sci. XXXVI-2/C43, pp. 8.
Swisstopo, 2015. swissBUILDINGS3D 2.0; Swiss Fed-eral Office of Topography. http://www.swisstopo. admin.ch/internet/swisstopo/en/home/products/ landscape/swissBUILDINGS3D_V2.html.
van Oosterom, P., 1999. Spatial access methods. Geographical information systems 1, pp. 385–400.
van Oosterom, P. and Zlatanova, S., 2008. Creating Spatial Infor-mation Infrastructures: Towards the Spatial Semantic Web. CRC Press.
van Oosterom, P., Zlatanova, S. and Fendel, E., 2006. Geo-information for disaster management. Springer Science & Business Media.
Verdie, Y., Lafarge, F. and Alliez, P., 2015. LOD Generation for Urban Scenes. ACM Transactions on Graphics 34(3), pp. 1– 14.
Vosselman, G., Dijkman, S. et al., 2001. 3D building model re-construction from point clouds and ground plans. Int. Arch. Photogramm. Remote Sens. Spatial Inf. Sci. 34(3/W4), pp. 37–44.
Waldhauser, C., Hochreiter, R., Otepka, J., Pfeifer, N., Ghuffar, S., Korzeniowska, K. and Wagner, G., 2014. Automated classification of airborne laser scanning point clouds. In: Solving Computationally Expensive Engineering Problems, Springer, pp. 269–292.