TRUE ORTHO GENERATION OF URBAN AREA
USING HIGH RESOLUTION AERIAL PHOTOS
Yong Hu, David Stanley, Yubin Xin*
PCI Geomatics, 90 Allstate Parkway, Markham, Canada – (hu, stanley, xin)@pcigeomatics.com
Commission IV, WG IV/1
KEY WORDS: Orthorectification, Elevation buffer, Visibility Analysis, Segment, Occlusion Compensation
ABSTRACT:
The pros and cons of existing methods for true ortho generation are analyzed based on a critical literature review for its two major processing stages: visibility analysis and occlusion compensation. They process frame and pushbroom images using different algorithms for visibility analysis due to the need of perspective centers used by the z-buffer (or alike) techniques. For occlusion compensation, the pixel-based approach likely results in excessive seamlines in the ortho-rectified images due to the use of a quality measure on the pixel-by-pixel rating basis. In this paper, we proposed innovative solutions to tackle the aforementioned problems. For visibility analysis, an elevation buffer technique is introduced to employ the plain elevations instead of the distances from perspective centers by z-buffer, and has the advantage of sensor independency. A segment oriented strategy is developed to evaluate a plain cost measure per segment for occlusion compensation instead of the tedious quality rating per pixel. The cost measure directly evaluates the imaging geometry characteristics in ground space, and is also sensor independent. Experimental results are demonstrated using aerial photos acquired by UltraCam camera.
* Corresponding author
1. INTRODUCTION
1.1 Background
On traditional orthoimage rectified using digital terrain models (DTMs), buildings appear to lean when they are not directly under the camera. The two adverse effects are that the building roofs are portrayed in an erroneous location, and the ground features are occluded by buildings. While using digital surface models (DSMs) that include buildings and other aboveground objects, the orthorectified images show unpleasant ghost effects in terms of double mapping in the place of occluded areas.
Amhar et al. (1998) firstly proposed to generate orthoimages using raw images captured by frame cameras by removing the geometric distortions originated from the terrain relief as well as the building effects. They try to correct the aforementioned effects by moving the pixels corresponding to building rooftops to their proper position and then by filling any obscured areas with pixels from overlapping images. On the resulting orthoimages, all pixels are taken as if from nadir. This new technique is called true orthorectification in the Geomatics community. In one word, the true orthoimage is an ortho-rectified image with geometric corrections properly applied to both bare Earth surfaces and aboveground objects (such as buildings, bridges etc.) in their exact planimetric locations. Because of the higher cost of collecting digital building models (DBMs) or high quality DSMs, true ortho generation can be limited to urban areas with tall structures presenting significant height changes.
True ortho generation involves a series of procedures. From the point of view of geometric correction, the two key stages are the visibility analysis and the occlusion compensation (Braun, 2003). In this paper, we will present new concepts and
innovative methods for both stages of true orthorectification. Section 1.2 recapitulates and compares exiting true ortho generation algorithms. Their pros and cons are analyzed, focusing on the problems that we intend to solve. In Section 2, we will propose a new methodology and discuss a six-step workflow. In Section 3, the algorithms are evaluated from the accuracy and performance aspects using high-resolution serial photos. Finally, we draw a conclusion in Section 4.
1.2 Literature Review
1.2.1 Visibility Analysis: True ortho generation needs to do a thorough hidden/occlusion detection. The purpose of visibility analysis is to detect such occluded areas to avoid the double mapping issue appeared on orthoimages when performing ortho correction using DSMs or a combination of DTMs and DBMs.
The z-buffer (aka depth buffer in computer graphics), is a well-defined and popular technique used to decide which elements of a rendered scene are visible and which are hidden. It is arranged as a 2D array with one element for each pixel, and records the distances between the perspective centre and the object points corresponding to individual image pixels. Among multiple object points along the same line of sight competing for a single image pixel, the point closest to the perspective centre has the minimum distance value and is judged to be visible, while the other further points are considered invisible. Some modified variants of z-buffer have been proposed to conquer its drawbacks or to extend to rectify images taken by pushbroom sensors (Amhar et al., 1998; Rau et al., 2000; Nielsen, 2004; Oda et al., 2004; Bang et al., 2007; Habib et al., 2007; Chen et al., 2007; Antequera et., 2008; Bang and Kim, 2010).
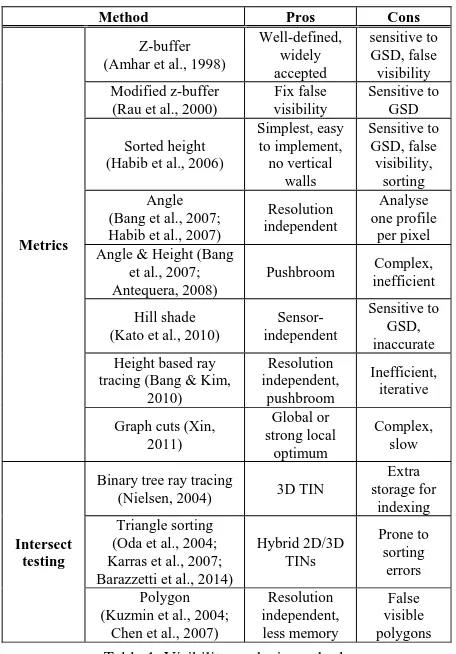
The visibility analysis methods discussed in literature may be divided into the metrics and the intersection testing categories
(Table 1). The metrics approaches use some quantitative measures, such as distance, height, angle, slope, aspect and cost, to detect the occlusion. The distance based approaches are z-buffer (Amhar et al., 1998; Ettarid et. al., 2005) and modified z-buffer (Rau et al., 2000). Qin et al. (2003) proposed to detect occlusion by comparing distances to image centre for corresponding roof and root points, but it is not clear how the low building obscured by tall buildings are detected as being occluded. The height based approaches are sorted height (Habib et al., 2006) and height based ray tracing (Bang & Kim, 2010). The angle based approaches are presented in (Bang et al., 2007; Antequera et al., 2008). In Kato et al. (2010), a hill shade function derived from the slope and the aspect angles are used to determine the visible and the obscured sides of the surface. Xin (2011) used graph cuts to minimize a pixel based energy cost with geometry, smoothness and visibility terms. The intersection testing based approaches are binary tree based ray tracing (Nielsen, 2004), triangle based visibility sorting (Oda et al., 2004; Karras et al., 2007; Barazzetti et al. 2014), and polygon based solutions (Kuzmin et al. 2004; Chen et al. 2007). In Wang and Xie (2012), the corners of polygons describing roofs and walls are projected to a horizontal plane along the perspective direction by an iteration procedure, and the occluded region is decided by calculating the intersection points of projecting lines and the entire DSM. To reduce the number of triangles for visibility analysis, Barazzetti et al. (2014) use the view frustum culling procedure based on the preliminary identification of triangles outside the camera view frustum.
Method Pros Cons Angle & Height (Bang
et al., 2007;
tracing (Bang & Kim, 2010)
Binary tree ray tracing
(Nielsen, 2004) 3D TIN Barazzetti et al., 2014)
Hybrid 2D/3D Table 1. Visibility analysis methods
However, these approaches require using different algorithms to locate the perspective centres and/or nadir points for different
imaging sensors, and also assume that the imaging ray from the ground surface to the sensor is a straight line. The determination of perspective centre positions is an iterative procedure for pushbroom and rolling-shutter sensors, and the straight line of sight is not obvious, considering atmospheric refraction. Especially for the replacement sensor models such as RPC, it is hard or in-feasible to derive the perspective centre and the nadir point needed by existing methods.
1.3 Occlusion Compensation
The role of occlusion compensation is to recover the obscured areas detected by visibility analysis in each orthoimage from multiple images taken at different positions and attitudes nearby, and to generate an orthoimage with holes being filled.
To resolve the redundancy in multiple neighbouring images and to choose the best images for a pixel in the final orthoimage, Schickler (1998) proposed to calculate a quality measure on a pixel-by-pixel rating basis for individual orthoimages. The quality measure is defined as a combination of a few criteria:
Nearest to nadir: a smaller relief displacement for points closing to the nadir.
Far from blind spots: in-harmonic for points closing to occluded segments.
Smearing problem: large view angles for points deviated from the imaging rays.
Nielsen (2004) used a measure combining the first two criteria (i.e., distance to nadir and distance from blind spots) and got results better than applying them separately. However, it also shows that the pixel based scoring method involves heavy distance calculations. Kato et al. (2010) compared the hill shade values among the images with overlapped areas and select the larger or largest values to make a composite image from the respective orthophotos.
This pixel based compensation method does not explicitly exploit the relationship among neighbouring pixels, and may result in over-fragmented pieces that mix pixels from different images. If the raw images have different illumination conditions and are not block adjusted perfectly, the compensated pixels may show a bad smear. That is, choosing pixels visible from multiple images on a pixel by pixel evaluation may result in excessive number of seamlines in between small pieces and increase the chance of cutting through un-rectified objects or objects that have moved between images (e.g., vehicles).
Moreover, Schickler (1998)’s criteria are only defined for images taken by frame cameras, and no suitable well-defined solutions are reported in literature for compensating images taken by pushbroom or rolling-shutter sensors or described by generic sensor geometry models. That is because the above criteria require computing the nadir point per pixel on the ortho image, and this is a complex and computationally prohibited procedure for the line scanning sensors, and is hard especially for replacement sensor models. In this case, the occlusion compensation is often deferred to the mosaicking stage.
2. THE PROPOSED METHODOLOGY
For the convenience of further discussion, a few concepts are explained first. The pixel in the raw image is called a raw pixel, and the pixel in the visibility index array, the e-buffer image
and the ortho image is called accordingly an index pixel, an e-buffer pixel and an ortho pixel. In literature, the term “hole” usually refers to the areas occluded by buildings. Those occluded areas are filled at different stages and by different operations in this paper, and are classified into two categories: segment and hole. The term “segment” is used to represent the occluded area that could be recovered from adjacent images; while the term “hole” is limited to the occluded area that is not visible from all the raw images and thus could not be filled directly using raw pixels.
2.1 The Overall Workflow
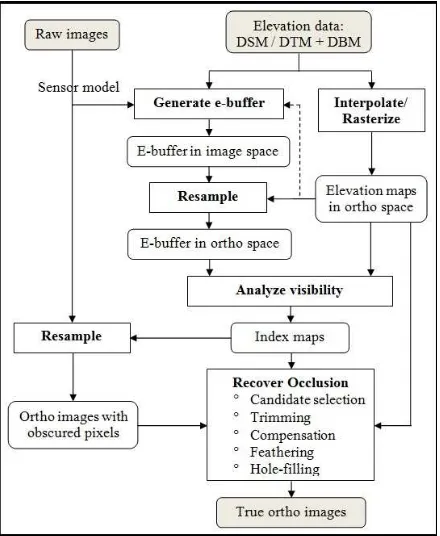
Fig. 1 depicts our methodology consisting of six steps. Steps 1 through 5 are repeated for every raw image together with associated elevation data to create a set of intermediate raster outputs, including orthoimages, e-buffer data, visibility index maps, and elevation maps. Then, Step 6 is used to recover obscured pixels for each orthoimage by retrieving optimal visible pixels from the adjacent overlapping ortho images. These processing steps involve raster interpolations made, respectively, on the digital elevation model (DEM, referring to either DTM or DSM), the elevation buffer image and the raw image. To produce nice results, we developed various discontinuity preserving techniques to avoid mixing non-homogenous pixels in the filtering windows.
Figure 1. The overall workflow for true ortho generation
Step 1: elevation map creation. The elevation map is defined in the ortho space and is also called e-map. It is created to provide an elevation value for each ortho pixel, and may be resampled from the DSM or interpolated and rasterized from the combined DTM and DBM. The value of each pixel in the e-map stands for the elevation of the topmost surface at the corresponding position in the ortho space. One point should be emphasized that this DBM rasterization does not need to process the vertical walls of buildings.
Step 2: raw elevation buffer generation. The elevation buffer is defined in the source image space, and is called e-buffer. It is created to provide an elevation value for each raw pixel, at which the largest elevation of all the object points along its line of sight will be computed and stored. It is noted that this e-buffer will replace the z-e-buffer to provide hints of visibility.
Step 3: e-buffer resampling. A raster e-buffer map is created in the ortho space to provide the possible highest elevation along the imaging ray extended till hitting an ortho pixel location.
Step 4: visibility analysis. A visibility index map (called v-map) is created to classify each ortho pixel to be either visible or invisible. It is fulfilled by comparing elevation values between the e-map and the e-buffer map. An ortho pixel is judged to be visible only if its associated elevation value in the e-map is not less than the value in the e-buffer map.
Step 5: raw image resampling. An ortho image is created with the grey values of all the visible pixels interpolated from the raw image. It is noted that the ortho images created so far will usually contain obscured regions.
Step 6: occlusion recovery. This processing step treats images asymmetrically. The ortho image under processing is called a master image, and all other neighbouring images are called slave images. It is composed of five operations: candidate segment selection, segment trimming, compensation, feathering and hole-filling. These operations take segments as the processing units. The segment is defined as a block of connected invisible ortho pixels (see the black shapes in Fig. 5). For example, usually there exists one segment for a prismatic building.
Figure 2. The tessellation pattern in raw image space
2.2 E-buffer Generation
The raw e-buffer can be generated using a traditional object space ray casting algorithm, which requires a complete modelling of building surfaces including both rooftops and vertical walls. In this section, we propose a quad-tessellation algorithm that computes e-buffer pixel elevations in the raw image plane from the e-map that is the DSM with the same resolution as the ortho image.
2.2.1 Quad-tessellation Method: This quad-tessellation algorithm is simple and efficient. Another important benefit is that no vertical wall structures need to be modelled in the DBM to generate a qualified raw e-buffer. This will save a lot for customers who are interested in true ortho production.
The four vertices of each 3D grid cell in the e-map are back projected to the raw image plane, and as illustrated in Fig. 2, a mesh of quadrilaterals (in red) is created covering the raw image pixels (i.e. black dots). For example, the projected points a, b, c, and d represent such a quadrilateral. The four vertices of each e-map cell are from the centres of four adjacent ortho pixels, which have pixel coordinates: (i, j), (i, j+1), (i+1, j+1) and (i+1, j) in ortho space. If any vertex of an e-map cell has no valid elevation, then this cell is ignored. The grid cells spanning both the terrain surface and the rooftops may result in overlaps among some long but thin quadrilaterals in the raw image plane.
The quadrilaterals are then rasterized. That is, for each raw pixel covered by a quadrilateral, the elevation of the corresponding object point is calculated. If the elevation is larger than the value already stored in the buffer, then the e-buffer pixel is updated. In result, the value of each e-e-buffer pixel represents the highest elevation for the corresponding raw pixel at the time of being imaged. First, the integer minimum bounding rectangle (MBR) is found from its four corner vertices of a quadrilateral. The raw pixels within the MBR are tested using the sweep line based scan-conversion algorithm to see if they fall inside the corresponding quadrilateral. Then the elevations at the interior pixel locations are interpolated referring to the four corner elevations. In detail, a bilinear interpolation is done for convex quadrilaterals, while a barycentric interpolation for concave quadrilaterals.
2.2.2 Parallelism Consideration: It is easily observed that a particular e-buffer pixel may fall within more than one projected quadrilaterals, polygons or triangles in the raw image plane. Therefore a straightforward parallelization will exhibit conflicts with populating the raw e-buffer.
A data decomposition scenario is designed for multi-core CPU processing. First the ortho data is divided into a specified number of subsets. Then two parallel tasks are created for each data subset: one for the parallel elevation interpolation and another for the sequential elevation population. This gives us the parallelization over the computationally intensive interpolation task and is also able to hide the light population task. For GPU processing, some pre-processing is done to firstly find out which quadrangles contain e-buffer pixels and which ones are empty. Only the non-empty quadrangles are configured in the launch grid for interpolation. So the pre-processing could maximize the usage of and balance loads on the GPU cores. The GPU elevation interpolation is composed of four operations: counting, splitting, preparing, and interpolation. The parallel elevation population is possible with the atomic operations supported inherently by GPU hardware.
2.3 Visibility Analysis
The basic idea for occlusion detection is that when two points on ground are back projected to the same pixel location in the raw image plane, the point with larger elevation will occlude the point with lower elevation.
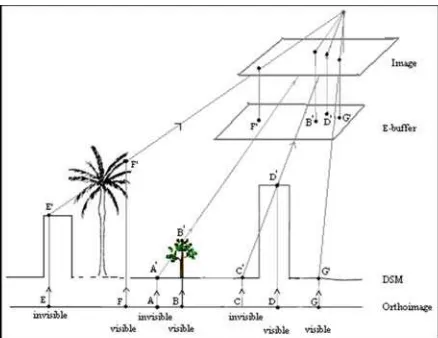
2.3.1 E-buffer based Approach: To understand the conceptual idea of using the e-buffer image for visibility analysis, the following processing is designed for hidden detection on individual ortho pixels (Fig. 3):
1) The elevation of the corresponding object point (i.e., A’) is retrieved from the e-map.
2) The object point is projected onto the raw image plane, and its raw pixel position is denoted as (r, c).
3) The e-buffer elevation located at the position (r, c) is interpolated from the raw e-buffer image.
4) The object elevation is compared to the interpolated e-buffer elevation both in ortho space. Either of the following two situations may occur:
a) If the object elevation is not less than the e-buffer elevation, then the corresponding index pixel in the v-map is assigned a value of 1 to indicate a visible ortho pixel (e.g., points B’, D’, F’, G’).
b) If the object elevation is smaller than its e-buffer elevation, then a value of 2 is assigned to index pixel to label an invisible object point (e.g., A’, C’, E’).
To take into account the rounding and interpolation errors, a small tolerance, e.g., 0.5 meter is allowed when comparing elevation values.
Figure 3. Visibility analysis based on e-buffer
To avoid the mixing of raw pixels located at both the ground surface and the building rooftops during the raw image resampling, the nearest-neighbour resampling is designated to those visible ortho pixels whose resampling windows contain at least one invisible ortho pixel.
2.4 Occlusion Recovery
The occlusion recovery procedure is as follows. First, the boundaries of the occluded segments are traced, and their sizes are evaluated. The segments whose sizes are smaller than a specified threshold (e.g., 2 pixels) are filled using a trimmed mean. This pre-filling operation greatly reduced the number of segments to be compensated later. For each candidate segment, the visible pixels along its boundary are trimmed outward up to a specified threshold (e.g., 3 pixels) depending on the accuracy of the building roof models. Then multiple adjacent slave ortho images having overlaps with the master image are employed for compensating the trimmed segments. These slave images are applied sequentially in an order determined by a rating based on a quality measure. At the same time, the feathering based on spatially weighted averaging is performed along seamlines
between all the compensated fragments. Lastly, the remaining small holes are filled up to a specified size.
2.4.1 Segment Trimming: The segment based trimming is motivated from one issue caused by the inaccurate building models. When the roof edges of building models do not match well with the source images, the ground pixels are rendered upon the roof edges if the roof models zoom outward beyond their true footprints, or vice visa, the roof edge pixels will be rendered upon the ground along the segment boundaries if the roof models shrink inward (e.g., the thin white ribbon in Fig. 4a).
The above ghosting effect could be largely suppressed by a segment trimming as seen in Fig. 4b. According to the worst mis-alignment between the true footprints and the roof models, we can estimate the trimming size in number of pixels in ortho space. The ortho pixels within a trimming zone will be erased before the compensation. The trimming zone of a segment is determined by firstly tracing its boundary and then by morphological dilations using a kernel with the trimming size.
Figure 4. Occlusion recovery a) without and b) with trimming
2.4.2 Occlusion Compensation: To tackle the over-fragment, the sensor-dependency and the low efficiency problems aforementioned in Section 1.2.2, a segment oriented compensation method is proposed. A segment oriented scoring is defined to prioritize the best images and thus is able to minimize the number of possible images applicable for compensation and also to reduce the number of seamlines. It is expected that the new method embody the pixel based criteria as well. That is, when the segment is reduced to a single pixel, the new rules should become similar to those of pixel based rating method. This compensation approach is firstly specialized for the frame camera, and is then extended for any other sensor models such as line scanner and RPC. The latter is not included due to length limitation.
Every ortho image is given a unique labelling number. When a segment pixel in the master image is compensated from a particular slave image, that slave image’s unique number is assigned to the corresponding index pixel in the master v-map. In this way, we can easily distinguish which segment pixel in the master image is compensated from which slave image. This provides essential information necessary for subsequent operations such as feathering.
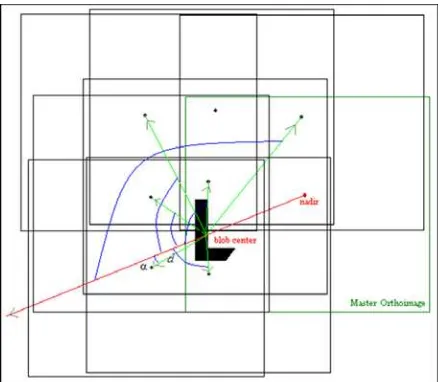
2.4.2.1 Compensation for frame camera
The best slave image is selected at the reflective direction going from the master nadir point to the segment centre in 2D ground plane (Fig. 5). The selection criterion has two factors that measure the distance and the angle.
- The distance d is measured from the segment centre to a slave nadir point (see the green line segments). The smaller the distance is, the better the imaging condition is for the said segment.
- The heading angle α is measured from the reflective direction (see the red line in Fig. 5) to the ray (see the green line) pointing from the segment centre to each slave nadir point. A small angle indicates that this slave image is captured at the opposite direction against the master image from the standing point of the segment, and thus the presence of blind spots is likely minimized for the said building in the slave orthoimage. If the angle is larger than 90 degrees, then the slave image has a bad imaging condition similar to the master image for the said segment.
In Eq. 1, a distance based cost measure (or energy function) sums the angle and distance measures.
f = d + w1 · α (1)
where w1 is a relative weighting factor between the distance and the angle. The coefficient w1 may be determined according to the scene size. For example, a 90-degree angle is considered to be equivalent to the scene dimension (denoted as s). Therefore we will have
w1 = s / 90o (2)
The cost measure defined by Eq. 1 utilizes the nearest to nadir criterion in its first term, and also considers the far from blind spots criterion in its second term. The rationale behind the second term of Eq. 1 is that, the smaller the heading angle α, the more unlikely the occlusions occur at the segment location on the slave image. That is, the second term represents the distance from blind spots criterion implicitly. So this cost measure combines the first two criteria presented in Section 1.2.2.
Figure 5. Segment oriented compensation (frame camera)
The slave orthoimage with the least cost value is selected. The segment pixels are filled using grey values of their corresponding visible pixels in the slave orthoimage. This processing is repeated for all the occluded segments to compensate a whole scene. And individual segments are detected by tracing the boundary of the 2-valued pixels in the v-map.
A segment may not be covered entirely in the best slave image. In this situation, the remaining unfilled pixels form new but smaller sub-segments. We can apply the same processing to find their best slave image with previous best slaves excluded from consideration. If no more slave images are available, then the remaining segments are not processed. A simpler way is to compute the cost measure for all the candidate slave images and process them sequentially from the best to the worst.
2.4.2.2 Compensation strategies
The compensation task involves loading from the slave images and filling in the master image corresponding to the current segment. There are normally thousands of segment existing on each scene. If each segment is compensated from all the overlapping slave images, the compensation will be a time-consuming procedure due to excessive disk IO. To reduce the disk IO, three strategies are tried: brute force, early skip and interleaved pivoting. Based on experimental results using Toulon dataset described in Section 3.1, the early skip method uses 52% of disk IO compared to the brute force method, and it is about 60% faster too. While the pivoting method gets a performance gain over 65%.
2.4.3 Feathering: The compensation of obscured pixels from multiple images will result in appearance of hard edges or seam lines around the segments if there are radiometric differences among those images. The feathering technology is used to blur and conceal the seam lines by spatially weighted averaging operations (Rau et al., 2002; Nielsen 2004). Its goal is to flatten the transition between pixels from multiple images by reducing the discontinuity of grey values along the seam lines, which are formed between the compensated areas and the original visible areas and also between the compensated sub-segments in occluded areas. In Nielsen (2004), the feathering operation is to apply a mean filter with different sizes along the seam lines.
Figure 6. Hole-filling preserving discontinuities
We developed a feathering algorithm that preserves discontinuities in elevation and provides seamless textures across ortho images. First, the seam lines are detected by doing morphological operations for those sub-segments being labelled different index values in v-map. Second, a feathering zone is built by a buffering operation along the seam lines. Within the feathering region, the new grey values are calculated by a weighted averaging of the existing pixels in the master image and the overlapping visible pixels in the selected slave image. The weighting factors are determined according to the distance between a pixel and the seam lines. Third, a discontinuity-preserved filtering is performed at a specified thickness (e.g., a 5x5 window) to further decay the radiometric differences beside the seam lines. In a filtering widow, only ortho pixels whose
elevations are within a tolerance (e.g., 2.5 meters) of the centre pixel’s elevation are used in the α-trimmed mean averaging.
2.4.4 Hole Filling: Even under the optimal imaging conditions, some small black holes may not be compensated if they are not taken by any of the raw images. For instance, if some buildings are very close to each other, particularly in downtown regions, the street ground in between closely located high-rising buildings might not be seem by any of the images acquired and the final ortho images could not completely compensate each other. Nielsen (2004) found that there are about 1% of occluded areas remaining in the final orthoimage created in Copenhagen even if narrow angle cameras are used to take images at a higher flying height. So a closer look should be done to address this hole-filling problem.
In Fig. 6, the black segment indicates the holes remaining in the orthoimage after occlusion compensation has been finished. We can clean up such black pixels using the α-trimmed mean or a multi-stage median filtering, which is defined by a few filters in horizontal, vertical and diagonal directions. A sub-filter will be chosen for the pixels in the sub-filtering window whose elevations (read from the e-map) are close to the elevation of the centre black pixel. This filtering process will be performed iteratively to fill holes up to a specified thickness. Therefore, the filled pixels will duplicate the textures similar to their neighbouring pixels and the textures at different elevation levels are not mixed. As illustrated in Fig. 6, the black hole A is filled from the brown portion at its left side because they have close elevation level, and the hole B is filled from the green portion also at its left side.
3. EVALUATION AND DISCUSSIONS
3.1 Testing Datasets
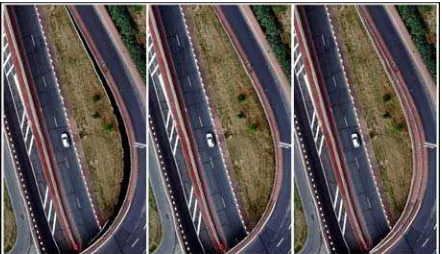
The Paris dataset consists of 29 air photos with 60% forward and side overlaps and a DSM with 1 m ground resolution. In the DSM, the buildings have been filtered out, and only overpasses are kept. So we will show true ortho results for overpasses.
The Toulon dataset contains four flight lines and 82 photos acquired by UltraCam aerial camera in 2010. These photos have the ground resolution is 10 cm, and covers a study area of 8 km2. The forward and side overlap ratios are, respectively,
about 83% and 82%. The building vector models contain 3D polygons and ridge lines, and are triangulated into the TIN.
Figure 7. a) Occlusion detection, b) true ortho (with DSM) and c) traditional ortho (with DSM) images (Paris)
3.2 Accuracy Analysis
Due to the shortage of independent reference data, the accuracy of true ortho-rectification is investigated from two aspects. First, the rectification accuracy on ground was checked by comparing the true ortho images and the ortho images. It was found that the two set of images show a perfect match on bare earth surfaces. Second, the rectification accuracy on buildings was checked by overlaying the true ortho images and the building models that are perfectly co-registered.
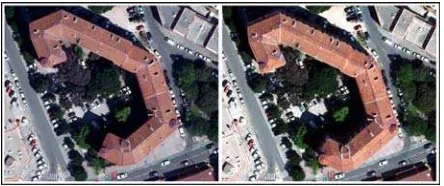
Figure 8. a) True ortho (with DSM) and b) traditional ortho images (with DTM) overlaid with roof models (Toulon)
In Figure 7, the image 0452 was rectified, respectively, using the proposed true ortho-rectification method and the traditional ortho-rectification method all with DSM. The occlusion detection results are given in Figure 7a, where the black pixels indicate the area occluded by the overpass. Figure 7b shows the true ortho image filled by segment labelling. In Figure 7c, we can see the ghost double mapping effects when applying ortho-rectification using the DSM instead of the regular DTM.
Figures 8a & 8b demonstrate the rectification results of one building on true ortho image with DSM and ortho image with DTM. The roof borders and ridges are visually well aligned between the true ortho images and the roof models, and no distortions on rooftops are found. We might claim a matched accuracy for buildings over ground features since the same rectification algorithm and implemented code has been used.
3.3 Performance Analysis
A Dell Studio XPS workstation with Windows 7 Pro 64-bit SP1 is used for performance testing. It has 12 GB memory (DDR3 @ 532MHz), one CPU (Intel Core i7 920 @ 2.67GHz), one GPU (NVIDIA GeForce GTX 260 with 192 CUDA cores @ 1080MHz and 1792MB memory), PCI Express x16 Gen2 bus, and two hard drives (7200 RPM).
PROC Timing Ortho
True ortho Visibility
analysis
Occlusion recovery
CPU
Total
(seconds) 3836.8
22486.3
4915.1 17571.2 Throughput
(MB/sec) 10.2
1.76
8.06 2.25
GPU
Total
(seconds) 2890.2
6798
2565.3 4232.7 Throughput
(MB/sec) 13.54
5.83
15.4 9.36
Table 2. Processing statistics (Toulon)
The algorithms presented in this paper have been implemented and parallelized using OpenMP and CUDA. The processing
statistics of traditional ortho with DTM and true ortho with DSM are listed in Table 2, where all the figures are the averages of three runs using the 82 photos of the Toulon dataset. The “Ortho” column gives statistics by running the traditional orthorectification, while the “True ortho” column gives statistics by running the visibility analysis and occlusion recovery methods proposed in this paper. It is observed from Table 2 that, true ortho has an acceleration ratio of 3.3x on GPU with respect to on CPU. For the same executing configurations, true ortho is about 5.9x and 2.4x slower than ortho, respectively on CPU and GPU.
3.4 Algorithm Analysis
The advantages and limitations of our algorithms are summarized below:
Advantages:
- The e-buffer concept is superior to the popular z-buffer and its variants for true ortho generation in the sense that it does not need to know the perspective centres and is applicable for all types of imaging sensor models. - The quad-tessellation technique requires no vertical walls
of buildings and is scalable with ortho resolution. - The visibility analysis finds obscured regions by simply
comparing the resampled e-buffer map and the e-map, and is highly efficient.
- The segment oriented compensation method minimizes the possible presence of seamlines. It not only enforces dependencies among neighbouring pixels but also embodies the three criteria of the pixel based methods in a plain formulation and is also computationally efficient. - The resampling algorithms work correctly with different
resampling windows that may contain both ground and elevated features, and preserve discontinuities in elevations when interpolating on the raw e-buffer and the raw images.
Limitations:
- The compensation results may be not good along building boundaries for inaccurate building roof models if their horizontal errors change per models. This is because the present implementation just allows one trimming parameter for all buildings.
- True ortho images may present visible seamlines near trees, and may be defected by moving objects near occluded areas.
- The stretched building roofs and ground surfaces have a low resolution when the angle between their normal directions and the imaging line of sight are large. - The shadowed regions hide details of ground features.
4. CONCLUSION AND FUTURE WORK
We researched innovative solutions for the two major processing stages of true ortho generation: first, ortho images are generated with occluded areas detected using the e-buffer based method; second, occluded areas in any ortho image are filled with data from overlapped ortho images using the segment based compensation method.
The first processing stage is composed of five steps. First, the DTM data is interpolated and the DBM data is rasterized both at the ortho resolution to create the elevation map. Second, the
e-map is projected to the raw image space to form a quadrilateral tessellation, which is then rasterized to create the e-buffer. Third, the raw e-buffer is resampled to provide the possible highest elevation at each ortho pixel location. Forth, the v-map is created to classify each ortho pixel to be either visible or invisible. Finally, the grey values of all the visible pixels are resampled from the raw image and this initial ortho image usually contains obscured pixels.
The second stage consists of four steps. First, the boundaries of the occluded regions are traced, and their sizes are evaluated. For each candidate region, the visible pixels along its boundary are trimmed outward up to specified pixels. Then multiple adjacent slave ortho images having overlaps with the master image are employed for compensating the trimmed regions. These slave images are applied in an order determined by a rating based on a quality measure. At the same time, the feathering is performed along seam lines. Lastly, the remaining small holes are filled up to a specified pixel size.
Further research efforts on three issues are suggested:
Change detection. Moving objects may result in visual defects, such as truncation, on true ortho images. De-stretching. The building roofs oriented away from the
imaging rays and ground surfaces with large intersection angles between the ground facets and the imaging rays will be stretched in orthoimage.
De-shadowing. The captured images usually have extreme shadows that appear low contrasts. The details in the shadow areas have to be enhanced to improve visibility.
ACKNOWLEDGEMENTS
The authors greatly appreciate financial support from Canada’s Scientific Research and Experimental Development (SR&ED) Tax Incentive program.
REFERENCES
Amhar, F., Jansa, J., and Ries, C., 1998. The generation of true orthophotos using a 3D building model in conjunction with a conventional DTM. IAPRS, Stuttgart, 32(4), pp. 16-22
Antequera, R., Andrinal P., González R., Breit S., Delgado J., Pérez J. L., Ureña M., Molina, S., 2008. Development of an integrated system of true-orthorectification - the Altais LRTO system. IAPRS Congress, Vol. XXXVII, Beijing, pp. 253-258.
Bang, K., Habib, A., Shim, S., and Kim, K., 2007. Comparative analysis of alternative methodologies for true-photo generation from high resolution satellite imagery. ASPRS, 7-11 May, Tampa, 12 p.
Bang, K., and Kim, C., 2010. A new true ortho-photo generation algorithm for high resolution satellite imagery. KJRS, 26(3), pp. 347-359.
Barazzetti, L., Brumana, R., Oreni, D., Previtali, M., and Roncoroni, F., 2014. True-orthophoto generation from UAV images: implementation of a combined photogrammetric and computer vision approach. IAPRS, Vol. II-5, Riva del Garda, pp. 57-63.
Braun, J., 2003. Aspects on true-orthoimage production. Photgrammetric Week, Heidelberg, pp. 205-214
Chen, Y., Briese, C., Karel, W., Pfeifer, N., 2014. True orthophoto generation using multi-view aerial images. IAPRS, vol. XL-3, Zurich, pp. 67-71.
Chen, L., Teo, T., Wen, J., and Rau, J., 2007. Occlusion-compensated true orthorectification for high-resolution satellite images. Photogrammetric Record, 22, pp. 39-52.
Ettarid, M., M’Hand A.A., Aloui, R., 2005. Digital true orthophotos generation. FIG Working Week and 8th ICGSDI, 16-21 April, Cairo, 11 p.
Habib, A., Bang, K., Kim, C., and Shin, S., 2006. True ortho-photo generation from high resolution satellite imagery. In: Innovations in 3D Geo Information Systems, pp. 641-656.
Habib, A., Kim, E., Kim, C., 2007. New methodologies for true orthophoto generation. PE&RS, 73(1), pp. 25-36.
Karras, G.E,, Grammatikopoulos, L., Kalisperakis, I., Petsa, E., 2007. Generation of orthoimages and perspective views with automatic visibility checking and texture blending. PE&RS, 73(4), pp. 403-411
Kato, A., Moskal., L.M., Schiess, P., Calhoun, D., Swanson, M.E., 2010. True orthophotos creation through fusion of lidar derived digital surface model and aerial photos. ISPRS TC VII Symposium - 100 Years of ISPRS, July 5-7, Vienna, pp. 88-93.
Kuzmin, P., Korytnik, A., Long, O., 2004. Polygon-based true orthophoto generation, Proceedings of XXth ISPRS Congress, 12-23 July, Istanbul, pp. 529-531.
Nielsen, M., 2004. True Orthoimage Generation [M.Sc. Thesis]. Technical University of Denmark, 126 p.
Oda, K., Lu, W., Uchida, O., and Doihara, T., 2004. Triangle-based visibility analysis and true orthoimage generation. IAPRS, 34(3), pp. 623-628.
Qin, Z., Li, W., Li, M., Chen, Z., and Zhou, G., 2003. A methodology for true orthorectification of large-scale urban aerial images and automatic detection of building occlusions using digital surface model. IEEE International Geosciences and Remote Sensing Symposium, Toulouse, pp. 729 – 731.
Rau, J.Y., Chen, N., and Chen, L., 2000. Hidden compensation and shadow enhancement for true orthoimage generation. ACRS, vol. 1, pp. 112-118.
Rau, J.Y., Chen, N., and Chen, L., 2002. True orthoimage generation of built-up areas using multi-view images. PE&RS, 68(6), pp. 581-588.
Schickler, W., 1998. Operational procedure for automatic true orthoimage generation. IAPRS, 32(4), pp. 527-532.
Wang, X., Xie, J., 2012. A method for true orthophoto generation based on projection and iteration strategy. IAPRS, vol. I-4, Melbourne, pp. 311-314.
Xin, Y., 2011. Land cover mapping for large area base map generation – a research report. York University, 28 p.