Susceptibility mapping and estimation of rainfall threshold using space based input for
assessment of landslide hazard in Guwahati city in North East India.
Kuntala Bhusan*, Shyam Sundar Kundu$, Kasturi Goswami, S Sudhakar+
North Eastern Space Applications Centre (NESAC), Department of Space, Govt of India, Umiam, Shillong, Meghalaya, India
*[email protected] , $[email protected], + [email protected]
KEY WORDS: Landslide , Guwahati ,Satellite image, Susceptibility map, Intensity-Duration plot
ABSTRACT:
Slopes are the most common landforms in North Eastern Region (NER) of India and because of its relatively immature topography, active tectonics, and intense rainfall activities; the region is susceptible to landslide incidences. The scenario is further aggravated due to unscientific human activities leading to destabilization of slopes. Guwahati, the capital city of Assam also experiences similar hazardous situation especially during monsoon season thus demanding a systematic study towards landslide risk reduction. A systematic assessment of landslide hazard requires understanding of two components, „where‟ and „when‟ that landslides may occur. Presently no such system exists for Guwahati city due to lack of landslide inventory data, high resolution thematic maps, DEM, sparse rain gauge network, etc. The present study elucidates the potential of space-based inputs in addressing the problem in absence of field-based observing networks. First, Landslide susceptibility map in 1:10,000 scale was derived by integrating geospatial datasets interpreted from high resolution satellite data. Secondly, the rainfall threshold for dynamic triggering of landslide was estimated using rainfall estimates from Tropical Rainfall Measuring Mission Multi-satellite Precipitation Analysis. The 3B41RT data for 1 hourly rainfall estimates were used to make Intensity-Duration plot. Critical rainfall was estimated for every incidence by analysing cumulative rainfall leading to a landslide for total of 19 incidences and an empirical rainfall intensity-duration threshold for triggering shallow debris slides was developed (Intensity = 5.9 Duration-0.479).
1. INTRODUCTION
Landslides, as one of the major natural hazards, account every year for enormous damage to life and property. The down-slope movement of masses of rocks, debris or earth under the influence of gravity is termed as a landslide (Cruden and Varnes, 1996). They are natural events which may occur due to or without human intervention, invariably leading to an increase in shear stress or decrease in shear strength of the slope-forming materials. They are triggered by a variety of external stimuli, such as rainfall, earthquakes, water level change, volcanic activity, forest fires, storm waves or rapid stream erosion etc. The scenario gets further aggravated due to unscientific human activities leading to destabilization of slopes and their eventual failure. North East India falls in the medium to high and high category of the Global Landslide Susceptibility Map and is one of the major natural hazards in the region (Hong and Adler, 2008).
2. STUDY AREA AND SCOPE
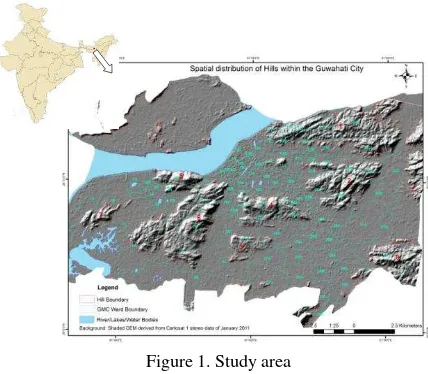
Guwahati, the capital city of Assam and the hub for various activities in the entire North Eastern Region (NER) of India, is one of the fast developing city with a population of about 1.6 million. The Guwahati city is a crescent shaped basin, surrounded by lofty hills which are outliers of Meghalaya Plateau.The city is bounded by 26.08º to 26.17 º N latitude and 91.50º to 91.83º E longitudes. Guwahati Municipal Corporation (GMC) covers an area of 216.7sq km. (Figure 1) while the Guwahati master plan area indicates an area of 261.77 sq.km The population density is of the order of 3750 persons/sq km and out of 90 GMC wards almost 34 are completely or partially affected by landslide and related phenomena. For easy reference (in Figure 1), various hills of Guwahati city are numbered as (1)
Nabagraha-Sunsali hill series situated in extreme north eastern corner (2) Japorigog hill situated in the extreme east, (3) Sonaighuli-Jutikuchi situated in the south, (4) Narakashur hill with Birubari-Dispur-Kacharibasti in the north-eastern side and Jatiya -Kahilipara- Odalbakra in the south and south-western side (5) Nilachal/Kamakhya hill situated in west central, (6) Fatasilhill situated in south-west with Santipur-Gotanagar-Teteliya in the northwestern side, Fatasil Ambari-Ganeshpara-Katabari in the eastern side andGarchuk-Teteliya at its southern side, (7) Jalukbari hill in the extreme south-western corner of the city and (8) Khanapara hill situated in the extreme south-eastern corner of the city.
Figure 1. Study area
In Guwahati city landslide was first reported in the year 1972, The International Archives of the Photogrammetry, Remote Sensing and Spatial Information Sciences, Volume XL-8, 2014
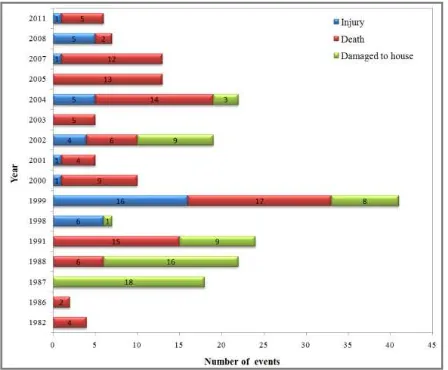
from Nabagraha hill, subsequently sharp increase in frequency of landslide occurrences are observed. During 80‟s and as well as in 90‟s landslide incidences were reported eight times in each decade. However, during 2000 to 2011 landslide incidences were reported for about twenty three times. It needs to be mentioned here that systematic records of landslide incidences with precise location and time of occurrence is available with District Administration only from 2007.Hence for this study inventory and resulting damages are summarized from various sources, like news paper publications, personal communications other than the official records of District Administration (Figure 2).
As the cost of landslide damage keeps on increasing dramatically with intensified pace of urbanization on the geologically sensitive slopes, so, a systematic study starting with large scale susceptibility mapping along with assessing the role of rainfall as a triggering factor is felt to be essential to understand the overall scenario. Aim of this study is to understand the city-specific circumstances where intensity of rainfall varies within few square kilometres (sq km).
Figure 2. Graphical representation of landslide inventory data
A systematic assessment of landslide hazard requires understanding of two components, „location‟ and „time‟ of probable incidence under certain geo-environmental setup. In absence of high resolution susceptibility map, systematic archival of landslide inventory data, desired network of rain gauge stations etc, present study elucidates the potential of space-based inputs in addressing the problem. The whole work was divided into two components, landslide susceptibility mapping and estimation of rainfall threshold mainly for shallow landslides that involve poorly consolidated soils or colluviums, weathered materials on altered steep hill slopes.
3. LANDSLIDE SUSCEPTIBILITY MAPPING
Since early 70‟s the landslide event has been studied considering various aspects by the scientist‟s world over. Guzzetti et al (2012) have explained elaborately the new space based tools available to address the old problem of landslide mapping. Landslide hazard and risk zoning and mapping for urban and rural areas is widely performed around the world (Carrara et al., 1991, and 1992). In India, use of satellite imageries in landslide studies was evaluated by many experts like Lakhera (1982), Champati ray (2004); Sarkar et al., (2004) and many more.
Landslide Hazard Zonation (LHZ) refers to the division of the land surface into homogenous areas or domains and their ranking according to different degrees of hazard due to mass movement (Varnes 1984). According to this definition, hazard map should both display the location of actual and potential slope-failures and provide information on the time or probability of their return period. However, in true sense landslide hazard zonation maps are susceptibility map in absence of temporal component.
To fulfil the research objective, preparation of Landslide Susceptibility (LS) map in 1:10,000 scale following satellite data are used,
(i) IRS P5, Cartosat I stereo data of 09 January 2011 (2.5m spatial resolution).
(ii) World view II multispectral imagery of 25 November 2010 (4band, 0.5m spatial resolution).
(iii) World view I imagery of 08 January 2009 (single band, 0.5m spatial resolution)
Apart from this, collateral data (both spatial and non spatial) are collected from both primary and secondary sources.
The LS map of Guwahati city is generated by integrating various thematic parameters (Table3) using Analytical
Table 3. Details of the thematic criteria considered for LS mapping
Thematic criteria Factors Remarks
1 Lithology Considered as
Causative Factors
Detailed mapping is done from image interpretation followed by their ground verification
2 Fault/Lineament and density
3 Drainage and density
4 Geomorphology
5 Rock weathering
6 Soil depth
Soil texture
8 Slope parameter Derived from Cartosat 1
stereo data
9 Slope discontinuity relationship
Detailed field mapping of joint pattern is done
followed by their
stereographic projection
10 Land Use/ land cover
Special emphasis was given on anthropogenic factors
11 Rainfall Considered as
Triggering Factors
Information collected from legacy data
12 Earthquake incidences
13 Landslide Used for
evaluating past incidences
Contains both archive and geomorphological inventory details used mainly for validation of the result
Hierarchal Process (AHP) depending on their role in causing slope instability. The susceptibility map is generated on the assumption that the factors which caused slope-failure in a region are the same as those which will generate landslides in the future (Carrara et al., 1995).Thematic maps representing various geo-environmental parameters of the study area are generated from visual interpretation of satellite images in consultation with collateral data followed by their ground verification during field surveys. Because of mapping scale, local variations in land use pattern, slope parameter derived from digital elevation model (DEM), variations in geological structural relationships etc could not be depicted in the map and hence in many instances these are generalized.
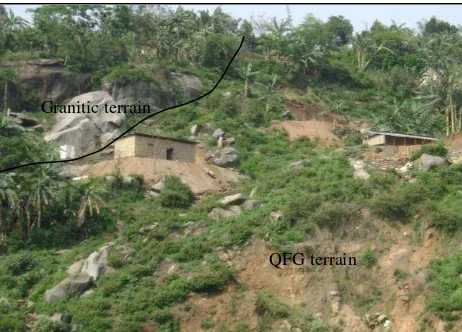
Interpretation and mapping of various thematic data and field survey indicate that the most dominant rock units of the study area are Quartzo Feldspathic Gneiss (QFG) followed by Grey Porphyritic Granite which occurs as an intrusive to the former. Structurally the area is complex, regional metamorphism and various phases of deformations have lead to alteration of the original rock fabric leading to the development of structural features such as folds, faults, joints, lineaments, shear zones etc. Geomorphologically the entire area is divisible into two broad units, namely denudational and depositional areas. All the hills are of denudational origin. Every where some visible sign of rock weathering is seen and heavy rainfall during monsoon season is the main source of weathering. In general, weathering of porphyritic granite is very low compared to QFG.QFG is highly weathered and in many places already converted to soil There is sufficient soil cover on the hill slopes. However, soil cover on the hill tops/ slopes has variable thickness. In general on granitic terrain soil thickness is less compared to gneissic terrain (Figure 4). Also it has been noticed that, on a hill slope,
Figure 4. Terrain condition; Location- Garchuk
type and thickness of the soil determines the type and dimension of landslide also. Hills of Guwahati city do not have steep natural slopes as majority of them fall in between 15° to 25° slope. It is observed that the frequencies of landslides, especially debris and earth slides are also more within this range as anthropogenic activities are more intense on such moderate slope conditions. The land use/ land cover pattern of Guwahati city is in general controlled by natural physical features. It is seen that because of the uneven relief, varied lithological composition of the hills, population growth etc, settlement and land use pattern is quite complex and houses are coming up even on the hill tops and slopes (Figure 5). Especially in QFG terrain, where soil thickness is more because of unscientific construction activities and slope cutting, natural slopes are locally altered to
more than 60° to almost vertical. These unscientific anthropogenic activities are one of the direct mechanical causes of landslide in the city. Exceptions are there where rock falls were reported, for example, in Shantipur, Kalapahar Pahartali area etc.
Figure 5.View of extensive hill cutting and alteration of natural slope as seen in Fatasil hill near Durgasarobar area. (Data: World view II image)
The lineament map derived from image interpretation depicts that hills of the Guwahati city have moderate to dense set of randomly oriented lineaments. From this, it is implied that infiltration along these lineaments happens to be the most prominent inducing factor as it increases groundwater level following heavy rain. Another major inherent cause of the landslides is the rock type and joint orientation with respect to slope direction. It is observed that mostly slope failure is observed where slope is perpendicular to major discontinuity, which facilitates water percolation and differential weathering causing wedge failure. Most of the landslides in Guwahati city are of complex type while some are of debris slide type, a few are rock fall and rock slide. Rock fall and rock slide are common in the hills where porphyritic granite are exposed. Earth slide, debris slide are common in the hills where deeply weathered gneissic rocks are exposed. In Guwahati, rock falls were reported from Dispur Kacharibasti, Kahilipara Colony Bazar, Odalbakra, Shantipur and from Pubsarania. Debris slides were reported from Noonmati, Nabagraha, Kharguli, Narikalbari, Rupnagar, Birubari,Jutikuchi etc. Landslide sites scattered over Guwahati city were affected by landslides of varying degrees leading to property and life loss. Old slide zones are mostly stable as these are reshaped by subsequent erosional processes and/or are modified by constructional activities or covered by dense vegetation.
The susceptibility map generated by integrating various thematic criteria is divided into five classes, namely, Very Low Hazard Zone (VLHZ), Low Hazard Zone (LHZ), Moderate Hazard Zone (MHZ), High Hazard Zone (HHZ) and Very High Hazard Zone (VHHZ) (Figure 6) on the basis of natural breaks. Further, for the same study area, Rapid Visual Screening (RVS) for potential landslide areas was carried out by Civil Engineering Department, Assam Engineering College mainly for settlement areas. The results of RVS survey when overlaid on the LS map provides a comprehensive understanding of the result obtained from space based inputs and field based (point) information. About 85% of the locations identified by field survey which requires immediate attention to reduce landslide risk fall in the HHZ and VHHZ classes of the susceptibility map derived from space based inputs. Rest 25% fall in MHZ class, while, majority of the locations which do not require immediate attention also fall in the MHZ class of the susceptibility map. Landslide hazard assessment was carried out from historic record of both landslide occurrences as well as role of triggering factors, Granitic terrain
QFG terrain
namely earthquake and rainfall records.
Figure 6. Landslide Susceptibility Map of the study area
4. ESTIMATION OF RAINFALL THRESHOLD
Early warning of landslides could be one of the most effective ways to minimize risk from landslides particularly for region like NER of India and particularly Guwahati city. Over this region, most of the landslides are rainfall triggered. Rainfall triggered landslides may be predicted by modelling the relationship between rainfall intensity-duration and landslide occurrence exclusively for a particular region (Keefer and Wilson, 1987). Currently no system exists to identify rainfall conditions and amount that may trigger landslides mainly because of the lack of in-situ rainfall measurements over this region. The situation does not seem to improve significantly in near future. Therefore remote sensing based information on rainfall data could be used effectively to develop such empirical relations for different regions (Hong and Adler, 2008). Recent advances and improvements in satellite-based precipitation observation technology and increasing availability of high-resolution geospatial products are providing an unprecedented opportunity to develop a real-time prediction system for rainfall-triggered landslides. In the case of landslides and rainfall, the minimum intensity or duration of rainfall necessary to cause a landslide of shallow soil slips, debris flows, debris slides or slumps (Varnes, 1978) is known as the rainfall threshold for landsliding.
The duration and intensity of rainfall play the most important role in triggering landslides. The Tropical Rainfall Measuring Mission (TRMM) Multi-satellite Precipitation Analysis (TMPA) (Huffman et al., 2006) data set has been used for the proposed landslide monitoring system in this study. The near real time hourly rainfall estimates TRMM_3B41RT.007 (collection 7 at 0.25° X 0.25° resolution) have been used so that the developed empirical relation can be used for early warning of landslide using the same product. The TMPA global rainfall map is produced by using TRMM to calibrate, or adjust, the estimates from other satellite sensors, and then combining all the estimates into the TMPA final analysis (Hong and Adler, 2008). The coverage of the TMPA depends on input from different sets of sensors (First, precipitation-related passive microwave data are collected by a variety of low-Earth-orbit satellites, including the TRMM Microwave Imager (TMI) on TRMM, Special Sensor Microwave/Imager on Defense Meteorological Satellite Program (DMSP) satellites, Advanced Microwave Scanning Radiometer for the Earth Observing
System (AMSR-E) on Aqua, and the Advanced Microwave Sounding Unit B (AMSU-B) on the National Oceanic and Atmospheric Administration (NOAA) satellite series. The second major data source for the TMPA is the window-channel (–10.7 micron) infrared (IR) data that are being collected by the international constellation of geosynchronous-Earth-orbit satellites, which provide excellent time-space coverage (half-hourly 4x4-km equivalent lat./long. grids) after merged by the Climate Prediction Center of the National Weather Service/NOAA (Janowiak et al., 2001). The IR brightness temperatures are corrected for zenith-angle viewing effects and inter-satellite calibration differences. The TMPA is a TRMM standard product at fine time and space scales and covers the latitude band 50°N - 50°S for the period 1998 to the delayed present. A real-time version of the TMPA merged product was introduced in February 2002 and is available on the NASA TRMM web site (http://trmm.gsfc.nasa.gov).
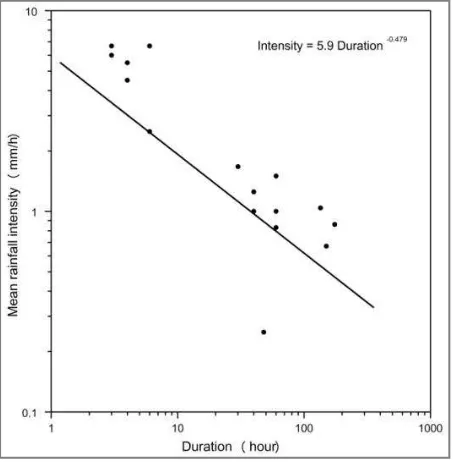
There has been several studies on to develop empirical rainfall intensity-duration thresholds at regional scales (Larsen and Simon, 1993; Godt, 2004). For the current study, critical rainfall was estimated for every incidence by analysing cumulative rainfall leading to a landslide altogether for 19 landslide events other than rock fall and rock slide that occurred within Guwahati city during 2000 to 2012 was considered to develop the empirical relation. The lower bound of rainfall intensity-duration threshold was approximately identified as Intensity = 5.9 Duration-0.479 (Figure 7).When coupled with real-time rainfall data, such rainfall intensity-duration thresholds might prove useful for development of early warning systems for shallow landslides (Liritano et al., 1998). The TRMM rainfall estimates were compared with weather station measured rainfall data for one station. A near systematic underestimation was observed in the TRMM estimates particularly for high rainfall events.
Figure 7. Empirical rainfall intensity-duration threshold triggering landslides (Intensity = 5.9 Duration-0.479) for landslides (dots) that occurred in the Guwahati city during 2000-2012 period).
5. CONCLUSION
Particular to landslide hazard in Guwahati city, alarming unscientific anthropogenic activities along with the quantity, duration and kind of precipitation/rainfall have been considered as direct mechanical cause in triggering landslides especially debris and earth slides. For example, debris slide of Ganesh Nagar, Sunsali hills area of 2007, Narakasur hills area od 2012 and similar incidences. However, in few instances, the slope failure problem in the Guwahati city has resulted due to interactions of different geo-environmental causative factors, especially rock slide of Kalapahar, Colony Bazar Hill Side Area (Pahartali) of 1999, Shantipur-Durga Sarobar area of 2004 etc. However, no-correlation with seismic activities is observed for reported landslide incidences. Although most of the slides are shallow landslides of smaller dimension these are disastrous and leading to causalities as they occur mainly in settlement areas. Hence, LS map of Guwahati city is prepared giving main emphasis on land use land cover changes.
The precipitation intensity that forms the key shallow landslide triggering factor, can be effectively monitored using TRMM TMPA products. The availability of hourly and near real time estimates makes it possible to monitor landslide probability in near real time. The triggering threshold may be used to develop an effective landslide early warning system. However, as many intense rainfall incidents over Guwahati city are aurography induced and are localized, a satellite based rainfall estimate often are not able to recognize them.
During the course of the study, it is realised that systematic records of landslide incidences with precise location and time of incidence is lacking. Forecasting of landslide as well as precise and quantitative assessment of landslide hazard cannot be address in absence of this information. Hence, concerned organisation need to maintain these data for future scientific study and generation of site specific model required for effective management of landslide in Guwahati city. Installation of rain gauge/ AWS network within 10-15km aerial distance from each hill may also be considered to calculate rainfall threshold for landslide in Guwahati city.
It must be mentioned here that the space based approach followed during the present work is first of its kind to assess landslide hazard (shallow landslides) followed by assessment of rainfall triggering threshold. This type of shallow landslides also has the potential to kill people and destroy properties. At present no system exists at either local or at regional scale to identify rainfall conditions that may trigger landslides. However, a more extensive dataset providing detailed inventory would further increase the accuracy of this kind of exercise.
6. ACKNOWLEDGEMENT
Authors are thankful to Assam State Disaster Management Authority (ASDMA), Govt of Assam; as part of this research findings are from the project titled “Remote Sensing and GIS Based Input for Hazard, Risk, Vulnerability Assessment of Guwahati city, Silchar, Dibrugarh towns and Dhemaji district, Assam.” sponsored by ASDMA.
REFERENCES
Carrara, A.,Cardinali, M.,Detti R., Guzzetti, F., Pasqui, V., and Reichenbach, P., 1991. GIS techniques and statistical models in evaluating landslide hazard. Earth Surface Process and Landforms, v. 16, 427-445.
Carrara A.,Cardinali M., Guzzetti F.,1992. Uncertainty in assessing landslide hazard and risk. ITC Jour., v. 1992:2 172-Nagarajan R (ed) Landslide disaster: Assessment and monitoring, Anmol Publications Pvt. Ltd, New Delhi. Pp 81-96
Cruden, D.M., and Varnes, D.J., 1996. Landslide Types and Processes. In: A.K. Turner and R.L. Schuster (Eds.) Landslide: Investigation and Mitigation, Transportation Research Board Special Report 247, National Academy Press, WA, pp.36-75
Godt, J. 2004. Observed and Modelled conditions for shallow landslide in the Seattle, Washington area. Ph.D dissertation, University of Colorado, Boulder, CO.
Guzzetti, F., Mondini, A .C., Cardinali, M.,Fiorucci, F., Santangelo, M.,Chang K.T., 2012. Landslide inventory maps: New tools for an old problem. Earth Science Reviews, 112, 42-66.
Hong, Y. and Robert, F. Adler., 2008. Predicting global landslide spatiotemporal distribution: Integrating landslide susceptibility zoning techniques and real-time satellite rainfall estimates. Int. J. of Sediment Research, Vol. 23, pp 249-257.
Huffman G. J., Adler R. F., Bolvin D. T., Gu G., Nelkin E. J., Bowman K. P., Hong Y., Stocker E. F., and Wolff D. B. 2007. The TRMM Multi-satellite Precipitation Analysis: Quasi-Global, Multi-Year, Combined-Sensor Precipitation Estimates at Fine Scale. Journal Hydrometeor, Vol. 8, No. 1, pp. 38–55.
Janowiak, J. E., Joyce, R. J., and Yarosh, Y., 2001. A Real-Time Global Half-Hourly Pixel-Resolution IR Dataset and Its Applications. Bull. Amer. Meteor. Soc., 82, pp. 205217.
Keefer, D. K. and Wilson, R. C., 1987. Real-time landslide warning during heavy rainfall. Science, Vol. 238, No. 13, pp. 921–925.
Lakhera , R.C., 1982. Geotechnical studies of Bowala-Nandprayag Hydel-Scheme Area, Chamoli District, U.P., Unpublished report of IIRS, Dehradun.
Larsen, M. C., and Simon, A., 1993. A rainfall intensity-duration threshold for landslides in a humid-tropical environment. Puerto Rico: Geografiska Annaler, Vol. 75A, pp. 13–23.
Sarkar, S., Kanungo, D.P., and Chauhan, P.K.S., 2004. An integrated approach for landslide susceptibility mapping using remote sensing and GIS, Photogrammetry Engineering and Remote Sensing 70(5): 617-625
Varnes, D. J., 1978. Slope movement types and processes. In: Schuster R. L. & Krizek R. J. Ed., Landslides, analysis and control. Transportation Research Board Sp. Rep. No. 176, Nat. Acad. oi Sciences, pp. 11–33.
Varnes, D.J., 1984. Landslide Hazard Zonation: A Review of Principles and Practice. Paris: United Nations International. The International Archives of the Photogrammetry, Remote Sensing and Spatial Information Sciences, Volume XL-8, 2014