Spatial Correlation Analysis between Particulate Matter 10 (PM10) Hazard and Respiratory
Diseases in Chiang Mai Province, Thailand
Nguyen Ha Trang a,*, Nitin Kumar Tripathi b
a, Department of Geodesy and Cartography, University of Natural Resources and Environment, Vietnam ([email protected]) b, Remote Sensing & Geographic Information System FoS, Asian Institute of Technology, Thailand ([email protected])
Commission VIII, WG VIII/2
KEY WORDS: Respiratory diseases, haze, particulate matter, Aerosol Optical Depth (AOD), MODIS images, GWR models ABSTRACT:
Every year, during dry season, Chiang Mai and other northern provinces of Thailand face the problem of haze which is mainly generated by the burning of agricultural waste and forest fire, contained high percentage of particulate matter. Particulate matter 10 (PM10), being very small in size, can be inhaled easily to the deepest parts of the human lung and throat respiratory functions. Due to this, it increases the risk of respiratory diseases mainly in the case of continuous exposure to this seasonal smog. MODIS aerosol images (MOD04) have been used for four weeks in March 2007 for generating the hazard map by linking to in-situ values of PM10. Simple linear regression model between PM10 and AOD got fair correlation with R2 = 0.7 and was applied to transform PM10 pattern. The hazard maps showed the dominance of PM10 in northern part of Chiang Mai, especially in second week of March when PM10 level was three to four times higher than standard. The respiratory disease records and public health station of each village were collected from Provincial Public Health Department in Chiang Mai province. There are about 300 public health stations out of 2070 villages; hence thiessen polygon was created to determine the representative area of each public health station. Within each thiessen polygon, respiratory disease incident rate (RDIR) was calculated based on the number of patients and population. Global Moran’s I was computed for RDIR to explore spatial pattern of diseases through four weeks of March. Moran’s I index depicted a cluster pattern of respiratory diseases in 2nd week than other weeks. That made sense for a relationship between PM10 and respiratory diseases infections. In order to examine how PM10 affect the human respiratory system, geographically weighted regression model was used to observe local correlation coefficient between RDIR and PM10 across study area. The result captured a high correlation between respiratory diseases and high level of PM10 in northeast districts of Chiang Mai in second week of March.
1. INTRODUCTION
Haze is an air pollution phenomenon, contains dust and tiny particles which reduce air quality and visibility significantly (Pentamwa and Kim Oanh, 2008). Haze resulted from three main activities are agriculture waste burning, solid waste burning and forest fire, in which vegetation burn from forest is predominant (Heil and Goldammer, 2001). The haze produced by biomass burning consists mainly of particulate matter smaller than 10µm (PM10) (Chang and Song, 2010). It is easy to inhale deep inside lung due to very tiny size and leads to serious health problems, even mortality (EPA). Numerous researchers have studied the effect of particulate matter pollution exposure on health such as airways irritation, coughing, breathing difficulties, asthma, decreased lung function, chronic bronchitis, irregular heartbeat, and heart attacks as well as eye irritation and reduced immunity to colds and lung infections (Martuzzi et al, 2006)
Due to the seasonal trend of harvestmen and opening land for new crops, haze crisis in northern Thailand starts in the dry season that is from February to April of every year. Seriousness of problem significantly increases in March. During this period, the north area gets covered by haze which contains PM10; higher than safety standard, that is 120 milligram per cubic meter within 24 hours (PCD) (table 1). This is a serious problem for those who are suffering from asthma, cardiovascular or other
respiratory system diseases. Prolonged exposure to haze might lead to fatal condition in such type of patients.
Table 1: Impact of PM10 level on health according to Thai PCD
AQI PM10
(g/m3) Meaning 0-50. 0 - 40 Quality. 51-100. 41-120 Medium quality. 101-200. 121-350 The health effects. 201-300. 351-420 Very Unhealthy > 300 > 420 Dangerous
Thailand had experience one of its worst haze in 2007 due to intensive forest fires (Junpen et al, 2011), slash and burn practice in agriculture (Chew et al, 2009) and haze trans-boundary from Laos, Burma and China (PCD, 2008). Ground monitoring station data from Thai PCD showed that the PM10 concentrations exceeded about 2 to 3 times of PM10 standard (120µg/m3) in March 2007. According to air quality index of Thai Pollution Control Department (PCD) during second week of March, the PM10 level almost exceeded the standard continuously 24 hours every day and many hours exceeded ‘very unhealthy’ to ‘dangerous’ ranges (table 2). This explained for a significant raise in hospital visits and admissions in March 2007 (Vichit-vadakan and Vajanapoom, 2011).
Table 2: PM10 level in March 2007 from Thai PCD Leelasakultum, 2011) are important factors which contributes to haze’s concentration and distribution.
Relative humidity: According to (Xiao, 2011) when relative humidity (RH) is high, the level of PM10 is also high
Wind speed is one of the most important factor affects haze dispersion (Xiao, 2011). Strong wind will make particles become more scattered and less concentrated
Precipitation is one of the factor which affect the concentration of PM10 because the pollutant is easily washed out by the high rate of precipitation (Sriyaraj et al, 2004).
According to (Barmpadimos et al, 2011) the influence of temperature on PM10 is diversity depends on seasons. The PM10 had positive relationship with temperature in summer but the trend was inverted in winter when PM10 concentration increased along with the decrease of temperature
Valley also plays an important role in spatial distribution of haze. The mixing layer height in mountain acts as a vertical barrier prevent haze disperse to higher altitudes. Apart from this, mountain channel airflow in valleys acts as horizontal flow barriers by trapping haze inside it (Falke et al, 2001).
A thorough exposure assessment is vital for risk identification. Exposures to air pollution are typically unevenly distributed geographically as well as temporally. Disease occurrences also show spatially varying patterns. Geographic information systems (GIS) can be used to explain spatial relationship between exposed environment and disease infection. Disease maps can act as valuable tools in risk identification and to investigate impact of environmental exposures on the changes in disease patterns (Jarup 2004).
In order to understand haze distribution and concentration, satellite image is most useful. Ground-based field surveys provide valuable information about local aerosol properties, yet they are often limited to few sampling locations and for a specific period of the time. In contrast, satellite based observations can help to investigate the spatial patterns of aerosol at regional scales, including long-range transport of aerosol.
The study aims to generate PM10 hazard maps, spatial pattern of respiratory incident rate (RDIR) and assess the impact of PM10 on human health through local spatial correlations between RDIR and PM10 hazard in Chiang Mai, Thailand during the episode of haze (Kim Oanh and Leelasakultum, 2011) in March 2007. Demographic data as well as hospital data were considered in village level. For analysing all the raster data were resampled into 100m x 100m
2. MATERIAL AND METHODS 2.1 Study area:
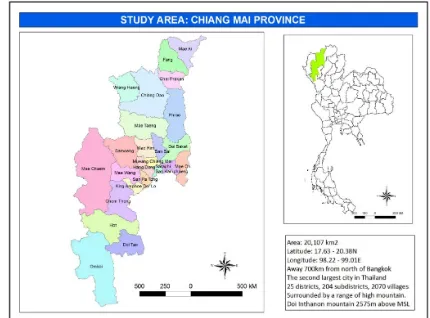
This study was conducted in Chiang Mai province, Thailand, the biggest province in northern Thailand; geographically it lies between the latitude 17.63N to 20.38N and longitude 98.22E – 99.01E (figure 1), and covers an area of 20,107 km2.
Climate in Chiang Mai is influenced by monsoons from the southwest and the northeast. There are three seasons: rainy season, cool season and hot season with an average annual temperature about 250C. Hot season from March to May is extremely hot, temperature can reach 400C.
Figure 1. Study area: Chiang Mai province, Thailand
The worst haze condition can be captured in month of March due to biomass burning in agriculture and adjacent area between forest and cropland (Leelasakultum, 2009) and affects large parts of the north of Thailand. During this period air pollutants are generated from various sources of anthropogenic activities and accumulate in the lower atmosphere, air quality in Chiang Mai with fine-particle dust levels reached twice the standard, which affect the human health and the environment.
2.2 PM10 pattern from satellite images and in-situ data Aerosol optical depth (AOD) was observed from MODIS images (MOD04_L2 and MYD04_L2 with respectively from Terra and Aqua platform) with 10km x 10km resolution. In-situ PM10 concentration data (hourly data) in March were collected from Pollution Control Department (Bangkok, Thailand) for two stations in Chiang Mai province
The daily images were downloaded for March 2007 including 31 images from NASA website. From that AOD values were extracted at the location of ambient air pollution stations in Chiang Mai province. In-situ PM10 concentration data (hourly data) in March were collected from Pollution Control Department (Bangkok, Thailand). Corresponding to AOD data, PM10 value were picked up at the time same as observed time. In order to visualize how AOD fit with ground PM10 level, a correlation between AOD and PM10 was taken into account by finding out their correlation coefficients and a better regression model would be applied to generate PM10 pattern raster layers as described in figure 2
Figure 2. Flowchart of transformation PM10 pattern from In-situ PM10 data and AOD images
In this study two regression models were applied to explore the pattern of PM10 includes simple linear model (equation 1) and logarithmic model (equation 2). Each type of model is described as following:
Simple linear model:
y = a + b*x (1)
Logarithmic model:
y = a + b*ln(x) (2)
Where: y = PM10 value x = AOD value a = intercept
b = slope of line (linear model) or control the rate of growth (logarithmic model)
SPSS software has been employed to examine the correlation and regression model between PM10 and AOD.
2.3 Spatial pattern analysis of respiratory disease
Figure 3. Flowchart of spatial pattern of respiratory diseases analysis and impact of PM10 on the diseases
Diseases relate to respiratory system are divided into about 150 types and subtypes. However it is not all of these diseases are directly linked to PM10. An assumption has been taken here, that if any kind of respiratory disease had more number of patients in March than other months then it would relate to haze event in March 2007. From this assumption, a comparative assessment between the number of respiratory patients in March and other months has been done by using equation 3. The
disease which had number of patients in March higher than other months was chosen for analysis.
dpati = PatM – Pati (3) Where PatM = number of respiratory patients in March
Pati = number of respiratory patients in month i dpati = difference number of patient in March with month i
There are 2070 villages in Chiang Mai province but only 300 hospitals and PHS in Chiang Mai, it means that one PHS covers a wide area that consists many villages. Hence thiessen polygon has been selected to explore area which is controlled by each hospital or PHS (figure 4). The shapefile of villages was intersected with thiessen polygon of PHS to identify the villages (blue dot) within each PHS polygon (red dot).
Figure 4. Thiessen polygons showing representative area of public health stations
Respiratory Disease Incident Rate (RDIR) of each PHS thiessen polygon was calculated as equation 4.
RDIR = (Number of patients *1000)/Population (4) Where number of patients were counted for each polygon and population were total of populations from all villages in that polygon.
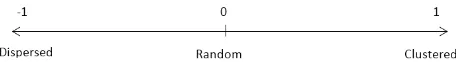
From the calculated RDIR, a spatial autocorrelation of polygons was evaluated in order to better understand pattern and trend of respiratory disease (figure 3). Global Moran’s I (Moran, 1950) was applied as a spatial autocorrelation measurement to examine whether the diseases related to respiratory system were clustered, dispersed or random during March 2007. Moran’s I is one of popular indices that used to measure the degree of pattern in areal data. Moran’s I indices range from -1 to 1, with value positive values indicate spatial autocorrelation as cluster (clustering of similar neighbour values). While negative values indicate spatial autocorrelation as disperse (dissimilar of nearby values) and 0 is no spatial autocorrelation (figure 5). The neighbours of each polygon were determined by rook contiguity, which assigns weights are one for edge sharing neighbours and zero for all the rest neighbours.
Figure 5. Moran’s I indices and spatial pattern of features
2.4 Spatial correlation between PM10 and respiratory disease incident rate(RDIR)
Global spatial autocorrelation can be used as a useful tool to assess global spatial pattern and temporal trend of diseases. However, it cannot be used to explain the impact of physical factors on disease infections across the study area. As stated before there are many reasons that lead to the illness of respiratory system, it can be either from weather or from PM10. As if it resulted from PM10, the degree of disease may vary depends on PM10 concentration. Hence the correlation between rates of disease with PM10 concentration was taken into account for each observation by geographically weighted regression model (figure 3). The study used GWR4 software to examine the global and especially local correlation coefficients between RDIR with explanatory variable, PM10 concentration. GRW4 allows user to apply popular types of generalized linear modelling including Gaussian, Poisson, and logistic regressions and perform statistical test of geographical variability on geographically varying coefficients.
3. RESULTS AND DISCUSSION
3.1 PM10 pattern and hazard map
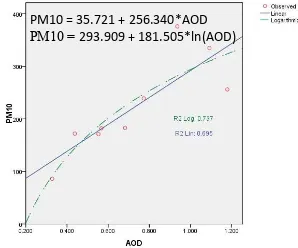
As discussed in methodology, there are 31 MODIS AOD images for March 2007. However after removing some images due to cloud or no PM10 data at ambient stations and outlier’s analysis, there are only 9 images left for further analysis. Logarithmic and linear regression model were applied to find out the pattern of PM10 through AOD. An impressive result (figure 6) was gotten from logarithmic model with R2 = 0.737. Nevertheless after applying this model on AOD images, negative PM10 value dominated nearly whole study area due to the values smaller than 0.2. Therefore, with a slightly lower of correlation coefficient (R2 = 0.695), linear regression model was the best choice to generate PM10 pattern from AOD images.
Figure 6. Scatter plot of PM10 against the changes of AOD The PM10 pattern was then applied onto 9 images and used map algebra to calculate average PM10 image for each week in March. In order to generate PM10 hazard map, hazard ranges were assigned based on the range of pollution control department (table 1). However the range from 120 to 350 g/m3 is quite large and mostly PM10 concentration on study area was within this range. Therefore it was divided into two ranges from 120 to 250 for low hazard and 250 to 350 for medium hazard (table 3)
Table 3. PM10 hazard range
PM10 range (g/m3) Hazard meaning
< 120 No hazard
120 – 250 Low hazard
250 – 350 Medium hazard
> 350 High hazard
PM10 hazard map (figure 7) presented a hazard almost dominated in the north areas of Chiang Mai through 4 weeks of March. It started with low hazard from the north to some districts in centre. However the situation was totally different on the 2nd week when hazard reached to high level (greater than 350 g/m3) with the most severe regions were in northeast districts. Turn to third week and fourth week, this scenery diminished gradually. In order to understand about the behaviour of PM10, a global correlation between PM10 in 2nd week and explanatory variables involves wind speed, relative humidity, temperature and DEM was observed. The result gave a high correlation with adjusted R2 = 0.806.
Table 4. Estimated value of wind speed, relative humidity, temperature and elevation on the changes of PM10
WS RH Temp Elev
PM10 -86.37 -13.03 -7.77 -0.05 Table 4 shows a negative relationship between PM10 with other four factors. In which wind speed had an impressive impact on the changes of PM10 (with the reduction 1m/s of wind led to the increase of 86.37 g/m3 PM10) while elevation just gave a small influence on the variation of PM10 (1m low in height gave 0.05 g/m3 rise in PM10). Nevertheless, it is not fair to assess the impact of elevation, especially in the mountainous area like Chiang Mai, on PM10 when the raster resolution is as low as 100m. But this resolution is good to consider the changes of meteorological factor as well as air pollution.
(a) (b)
(c) (d)
Figure 7. PM10 hazard map in four weeks of March 2007. (a) 1st week, (b) 2nd week, (c) 3rd week and (d) 4th week
PM10 = 35.721 + 256.340*AOD PM10 = 293.909 + 181.505*ln(AOD)
According to figure 8 wind speed was lowest in northeastern districts and besides that this area has lowest elevation, this explained why PM10 concentration was almost highest here. As stated in [2.1] wind speed and topography are important factors that affect the concentration of haze. When air pollution reached to the valleys and lower areas it was trapped inside for long time and the situation was more severe when wind speed was too low to disperse it. Yet relative humidity in this case seem did not agree with (Xiao, 2011) [2.1], it was very low in central districts where had high level of PM10. Temperature had shown a bit complicated behavior in the study, on regional level, temperature exhibited a clear negative relationship with PM10 with high temperature in the north and low temperature in the south respectively to low PM10 in northern area and high PM10 in southern area. However in the central districts with the high concentration of PM10 the temperature was at medium high. This indicated that temperature was not really a good indicator to judge the behavior of PM10 in this case.
(a) (b)
(c) (d)
Figure 8. Wind speed (a), relative humidity (b), temperature (c) and elevation (d) in 2nd week March, 2007 Chiang Mai province
In conclusion, haze started in northern area of Chiang Mai province with low hazard of PM10 in 1st week of March. But the situation got extremely serious in 2nd week when whole province suffered in PM10 with over standard index, this again gave the northern part higher PM10 concentration than in the south and even there were some districts in northeast were in the category of high hazard of PM10 which is harmful for health. The reason for this high concentration of PM10 in this area was because of low elevation of the place and that surrounded with high mountains that made haze accumulated here. Additionally, wind speed were so low that keep haze
stayed for long, made the hazard was more severe and caused numerous of health related problem to people
3.2 Spatial pattern of respiratory diseases
Moran’s I was calculated for statistical test of spatial autocorrelation in global scale of RDIR values. The result has been presented in figure 9 for all four weeks of March, Moran’s I indices were similar for 1st week, 3rd week and 4th week with 0.035, 0.081 and 0.026 respectively. These indices were approximately to 0 which indicated that there were absence of spatial pattern of respiratory disease incident rate when PM10 was at low hazard. Nonetheless, the 2nd week was emphasized by 0.25 of Moran’s I index. This showed a cluster pattern on the incident rate of respiratory diseases when PM10 was at medium to high hazard.
(a) (b)
(c) (d)
Figure 9. Moran's I indices of RDIR in four weeks of March. (a) 1st week with Moran's I is 0.035; (b) 2nd week with Moran's I is 0.25; (c) 3rd week with Moran's I is 0.081 and (d) 4th week with Moran's I is 0.026
3.3 Spatial correlation between PM10 and respiratory disease incident rate(RDIR)
In order to understand how PM10 influence on human health in Chiang Mai during episode of haze 2007, local correlation coefficients between RDIR and PM10 and estimation of PM10 impact on changes of RDIR were calculated by using GWR4 software
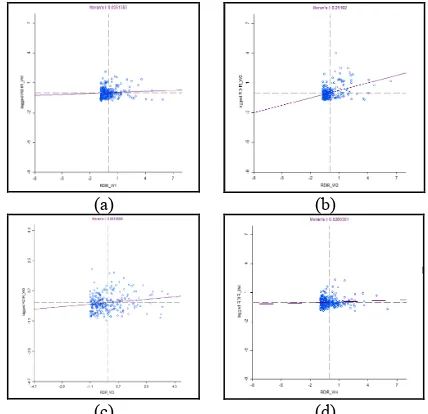
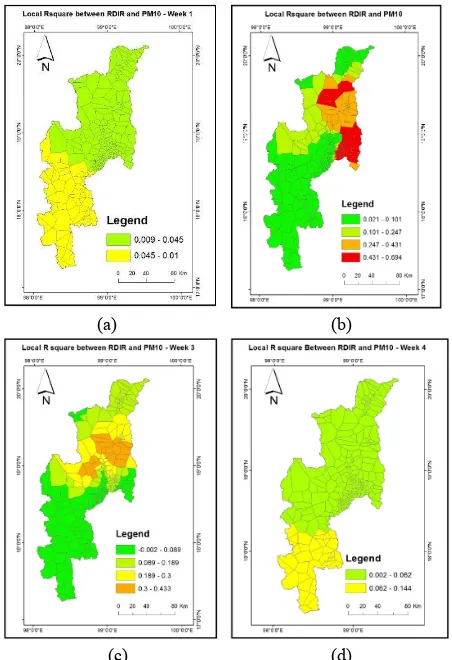
In the 1st week (figure 10a), the correlation between RDIR and PM10 is very low (with the highest R2 = 0.01) or no correlation at all. However for regional observation, the correlation in the south is higher than in the north. As the PM10 concentration in week 1 (figure 7a) is higher in the north rather than in the south, it means that the rate of disease infection in the south is low and PM10 level is also low while PM10 level in the north is high and the RDIR is still low. With negative impact of PM10 on the change of RDIR, it concludes that no relation between PM10 and the rate of disease infection in 1st week.
In week 2 (figure 10b) the correlation is quite good (with the highest R2 from 0.4 – 0.7) in the north where PM10 concentration was highest, this indicate a noticeable impact of PM10 on the increasing number of respiratory patients in this area. Additionally the correlation coefficient is quite fair (R2 = The International Archives of the Photogrammetry, Remote Sensing and Spatial Information Sciences, Volume XL-8, 2014
0.25 - 0.43) for neighbouring districts where got medium hazard of PM10. Yet R2 is noticeable low in the north head districts while this place was affected by medium to high hazard, it shows that PM10 hazard did not influence on human health in this area to compare with other districts. Another region also get lowest correlation between PM10 and RDIR is southern districts where got low hazard of PM10. This reveals a high rate of respiratory diseases in this area with a light impact of PM10. This situation shows that people in this area is more vulnerable than those in the north. Therefore to assess the impact of PM10 on the south area particularly it is better to take into account other physical factors and social factors such as weather, geography, land use population density and per capita income along with PM10 for better understanding causes of the disease here.
(a) (b)
(c) (d)
Figure 10. Local R square between RDIR and PM10 in four weeks of March. (a) week 1, (b) week 2, (c) week 3, (d) week 4.
In the week 3 (figure 10c), the scenario is similar with week 2 but the correlation between RDIR and PM10 is scaled down along with the reduction of PM10 concentration (with the highest R2 = 0.4). Going to week 4 (figure 10d), the image is similar to week 1 when the correlation between RDIR and PM10 is very week and no impact of PM10 on infection cases.
4. CONCLUSION
The study aimed to assess the impact of PM10 on human health during occurrence of haze in March 2007 in Chiang Mai province, Thailand. The study has shown that PM10 hazard with higher than standard level (120/m3) predominantly covered north area of Chiang Mai province during March and emphasized in the second week when whole province was
blanketed by haze. During the second week, the number of respiratory patients raised up that made this week had a cluster pattern of the disease rates. Local spatial correlation between respiratory incident rate and PM10 also indicated a high correlation in north and northeast districts. This proved that people in these districts are at high risk of PM10. Besides that, the correlation is low in southern part of province where had low hazard of PM10, it means that people in this area is more susceptible to the hazard.
ACKNOWLEDGMENTS
The authors would like to thank Japanese Government for research fund support, Public Health Department of Chiang Mai province for respiratory patient’s records, Pollution Control Department of Thailand for ambient air pollution data, Thai Meteorological department for meteorological data, Chiang Mai University for administrative data and research facilities.
REFERENCES
Barmpadimos, I., Hueglin, C., Keller, J., Henne, S., & Prévôt, a. S. H., 2011. Influence of meteorology on PM10 trends and variability in Switzerland from 1991 to 2008. Atmospheric Chemistry and Physics, 11(4), 1813–1835.
Chang, D., Song, Y., 2010. Estimates of biomass burning emissions in tropical Asia based on satellite-derived data. Atmos. Chem. Phys., 10, 2335–2351.
Chew, B. N., Chang, C. W., Salinas S.V., Liew S. C., 2007. Remote sensing measurements of aerosol optical thickness and correlation with in-situ air quality parameters during a smoke haze episode in Thailand. Asian Conference on Remote Sensing Proceedings, Kuala Lumpur, Malaysia.
EPA, U.S. Environmental Protection Agency. Available online: http://www.epa.gov/
Falke, S. R., Husar, R. B., Schichtel, B. A., 2001. Mapping air pollutant concentrations from point monitoring data II: barriers and surrogates. Atmospheric Environment, submitted for publication.
Heil, A., Goldammer, J., 2001. Smoke-haze pollution: a review of the 1997 episode in southeast Asia. Regional Environment Change, Volume 2, Issue 1, 24-37.
Jarup, L. (2004). Health and environment information systems for exposure and disease mapping, and risk assessment. Environmental health perspectives, 112 (9), 995-997.
Junpen, A., Garivait, S., Bonnet, S., Pongpullponsak, A., 2011. International Journal of Enviromental Science and Development, 2 (2), 156-161.
Kim Oanh, N.T., Leelasakultum, K., 2011. Analysis of meteorology and emission in haze episode prevalence over mountain-bounded region for early warning. Science of the total environment, Elsevier, 409 (11), 2261–2271.
Leelasakultum, K., 2009. The Chaing Mai Haze episode in March 2007: Cause investigation and exposure assessment. Chiang Mai: Northern haze episodes Center.
Martuzzi, M., Mitis, F., Iavarone, I., Serinelli, M. 2006. Health impact of pm10 and ozone in 13 Italian cities. WHO Regional Office for Europe, Copenhagen, Denmark.
Moran, P. A., 1950. Notes on continuous stochastic phenomena. Biometrika, 17-23.
PCD. Pollution Control Department. Available online: http://www.pcd.go.th/ (accessed in November, 2014)
Pentamwa, P., Kim Oanh, N.T., 2008. Air quality in southern Thailand during haze episode in relation to air mass trajectory. Songklanakarin J. Sci. Technol. 30 (4), 539-546.
Pollution Control Department (PCD), 2008. Thailand State of Pollution Report 2007. Pollution Control Department, Ministry of Natural Resources and Environment.
Sriyaraj, K., Priest, N., Shutes, B., Wiwatanadate, P., Trakultivakorn, M., Crabbe, H., Kajornpredanon, P., Ouiyanukoon, P., 2004. Air quality modelling in Chiang Mai city, Thailand. In 13th World Clean Air and Environmental Protection, Congress and Exhibition. 22nd-27th August. Vichit-vadakan, N., Vajanapoom, N., 2011. Health impact from air pollution in thailand current and future challenges. Environmental health perspectives, 119 (5), A197–A198. doi: 10.1289/ehp.1103728.
Xiao, Z., 2011. Estimation of the main factors influencing haze, based on a long-term monitoring campaign in Hangzhou, China. Aerosol and Air Quality Research, 873–882.