MARITIME
PRODUCTS USING TERRASAR-X and SENTINEL-1 IMAGERY
S. Lehner, B.Tings
German Aerospace Center (DLR), Remote Sensing Technology Institute, Maritime Security Lab, Henrich-Focke-Straße 4, 28199 Bremen, Germany – [email protected]
THEME: Marine and coastal environment, resources and dynamics, MARI
KEY WORDS: TerraSAR, Sentinel, Ship Detection, Oil Detection, Wind Field, Sea State
ABSTRACT:
High resolution remote sensing Synthetic Aperture Radar (SAR) data from TerraSAR-X/Tandem-X satellites are used to determine and monitor the sea surface in near real time and all weather and illumination conditions. The radar backscatter of the sea surface is determined by the sea surface roughness caused by the wind field and the sea state. These meteo parameters are modelled by the newly developed algorithms XMOD and XWAVE relating the wind field and sea state, depending on incidence angle and directionality to the radar backscatter sigma0.
The TerraSAR-X Modes Stripmap, Scan SAR and Scan SAR Wide are used together with Sentinel and RADARSAT data to detect ships, oil spills and icebergs. The detectability depending on the background conditions is discussed. Several examples from near real time campaigns performed together with users are given.
1. INTRODUCTION
1.1 The SAINT toolbox
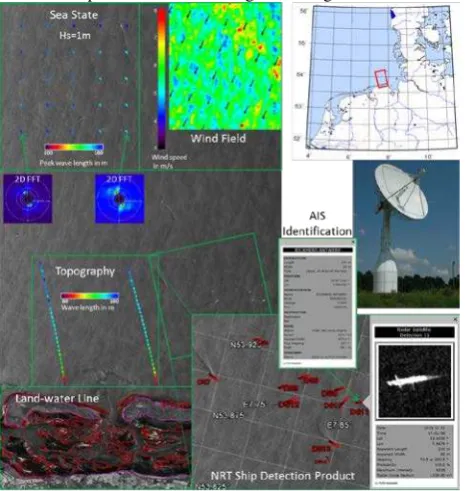
This paper gives an overview of the processors developed at the DLR Maritime Security Lab. It is updated regularly and summarizes control and capacities of the processors. An overview of parameters derived is given in Figure 1.
Figure 1: Example image with results from different
processors of SAR AIS integrated NRT Toolbox (SAINT). The image has been acquired on 21th of November, 2013 over German North Sea coast.
All processors are dedicated to the analysis of SAR-images provided by satellite-EO-systems. The information extracted from SAR is used to compliment maritime domain awareness by environmental information. It is the aim to integrate all processors into the SAR AIS Integrated NRT Toolbox
(SAINT), which enhances the information extraction process with internal information exchange and additional third party information (like AIS or weather forecast).
SAINT comprises the following basic capabilities: - NRT-Processing of TerraSAR-X and Seninel-1 data - NRT-Processing of all SAR intensity images with
arbitrary resolution
- Landmasking via GSHHS or SRTM
The processors deal with the following tasks: - Sea State
o Derivation of significant wave height o Determination of peak wave direction and
wave length from ocean surface characteristics
- Wind Field Retrieval
o Determination of wind direction from WRF model
o Alternatively: estimation of wind direction from wind streaks imaged on ocean surface o Determination of wind speed from ocean
surface backscatter - Oil Spill Detection
o Localization of oil spills
o Classification between oil spills and lookalikes
- Iceberg Detection o Localization of icebergs o Estimation of iceberg extent
o Filtering of false detections and calculation of detection probability
- Ship Detection o Localization of ships
o Estimation of ship length, width and heading
o Filtering of false detections and calculation of detection probability
o Fusion with time-correlated AIS data - Topography/Bathymetry
o Fusion with water level data, if applicable prediction of floodings
o Derivation of water depth from change in wave length and wave breaking
Extensions under development are: - Ice Type Classifier:
o Distinction of ice types (e.g. pack ice, nilas, open water with ice floes)
- Ship Classification
o Distinction of ship types (e.g. tanker, bulk carrier, passenger ship)
o Higher accuracy of ship parameter estimation
- Wake Detection:
o Localization of wakes behind ships and of ships with invisible SAR-signature
o Solving ambiguity of heading of ships o Estimation of ship speed
Running the different processors in parallel sustains NRT compatibility and ensures that all extracted information is instantly available to other processors. In this manner the performance of processors is increased. The following subsections describe the TerraSAR-X, Sentinel-1 and Automatic Identification System (AIS) data processed by the toolbox. The processors are extended for additional input like RADARSAT-2 or CosmoSkymed.
1.2 TerraSAR-X
TerraSAR-X (TS-X) is a German EO-satellite, which was launched on 15.06.2007 and has started its operational service on January 2008. With its active phase-controlled X-Band-antenna (wavelength 31 mm, frequency 9.6 GHz) TS-X acquires high-resolution radar data, while orbiting the earth at nearly polar orbit with 514 km altitude. The orbit is chosen in a way that the satellite flies in a sun-synchronous dusk-dawn-orbit. TS-X acquires radar data at different modes with a resolution up to 1 m. Examples of TS-X imagery acquired in different modes over the German bight are shown in Figure 2. Since June 2010 TS-X has the identically constructed twin brother TanDEM-X (TD-X).
Figure 2: Examples of TS-X images acquired in different modes over the German Bight
1.3 Sentinel-1
The European Sentinel-1 mission comprises two EO-satellites called SENTINEL-1A and SENTINEL-1B sharing the same orbit plane. Sentinel-1A was launched on 3th of April, 2014
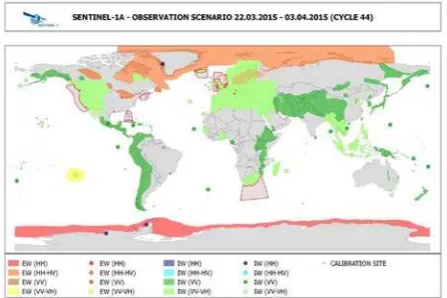
and has recently left its commissioning phase and stated its operational service. With its C-Band Synthetic Aperture Radar Sensor (Frequency 5.405 GHz) Sentinel-1A acquires high-resolution radar data from its sun-synchronous, near-polar, circular orbit at an altitude of 693km. If enough downlink capabilities are available, Sentinel-1 acquires SAR data almost continuously. Figure 3 shows the acquisition plan for the period end of March 2015.
Figure 3: Example of a Sentinel-1 acquisition plan (Source: ESA)
While the Stripmap mode is performed with a static antenna, Interferometric Wide Swath and Extra Wide Swath use an electronically steered antenna acquiring data in TOPS mode. The sensor provides data at three possible processing levels. First level (Level-0) products are compressed and unfocused SAR raw data. This raw data traverses several processing steps like Doppler Centroid Estimation and Focusing to obtain the commonly utilized second level (Level-1) products. At Level-1 two product types can be chosen for further analysis:
• Single Look Complex (SLC) products are provided in slant-range geometry. The SAR data has been geo-referenced using satellite’s orbit and attitude information
• Ground Range Detected (GRD) products consist of focused SAR data, which has been detected, multi-looked and projected to ground range using an Earth ellipsoid.
The last processing level (Level-2) is especially dedicated to maritime applications. Geophysical information is derived from SAR data providing the following information layers:
• Ocean Wind field (OWI)
• Ocean Swell spectra (OSW)
• Surface Radial Velocity (RVL)
1.4 Terrestrial and Satellite AIS
AIS signals are also received using satellites systems. Hence, satellite AIS (SatAIS) is a data source to provide global awareness about ship positions, movements as well as maritime traffic densities. The ship AIS signal can be received by satellite receivers using the whole spectrum of radio wave length. For receivers in low earth orbit (LEO) with an altitude of 650 km the sending distance varies between 2800 km (very low elevation angle) and 650 km (receiver is above the ship in zenith). Thus, the average monitored area of one satellite receiver is above 20 million square kilometers. The obvious advantage of SatAIS is the global coverage and the availability at areas without terrestrial AIS. Figure 4 shows a combination of a TS-X image and AIS statistics.
Figure 4: One week of terrestrial AIS overlaid on a TS-X image of the German Bight with sub-scenes showing at the Elbe –Weser entry.
2. TERRASAR-X MARITIME PROCESSORS
This part describes the current state of the TerraSAR-X algorithms incorporated in the processor..
2.1 Sea State Parameters
The empirical sea state retrieval algorithm called XWAVE-2 is based on the earlier developed XWAVE-1 model function for obtaining integrated parameters using X-band data (Bruck et al., 2011, Lehner et al., 2013). The algorithms are based on analysis of image spectra and use parameters fitted with collocated buoy data and sea state model results using also information on spectra peak direction. The new developed XWAVE-2 algorithm derives significant wave height directly from TerraSAR-X SAR image spectra without transformation into sea state spectrum and without using a priori information. The wind information derived from the image has also been used to verify the estimated sea state.
Additional sea state parameters like wave height, peak wavelength (in range 50m- 500m) and corresponding peak direction is estimated from TerraSAR-X Stripmap and Spotlight images, too.
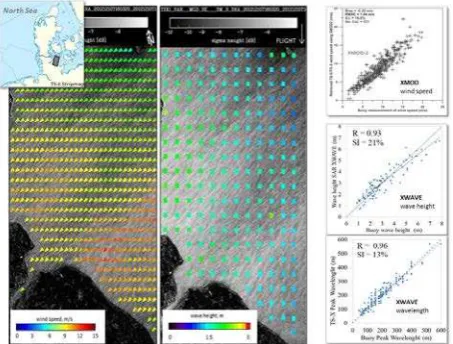
To improve performance especially in coastal waters a filter is applied to remove high backscatter outliers such as ships or offshore structures and large structures like current borders, atmospheric fronts and effects due to banks. A logical landmask is used to prevent calculation over land areas. Baltic Sea on 10.12.2012 at 16:53 UTC and wind field derived using nonlinear XMOD-2 algorithms (left), significant wave height field derived using XWAVE-2 empirical algorithm (middle) and scatterplots for both algorithms (right). The number of entries is 371 for XMOD and 200 for XWAVE.
For details of the algorithm and it validation see A. Pleskachevsky et al., this issue.
Figure 5: TerraSAR-X Stripmap acquired over Kiel Bight showing as examples the overlaid wind field (left), sea state (right). At the right are shown scatterplots of wind speed, significant wave height and peak wave length against buoy data for a larger dataset acquired over the open sea.
2.2 Wind Field Retrieval
The wind retrieval algorithm is based on the CMOD5 (Hersbach et al., 2007) geophysical model functions (GMFs). Coefficients in the equation have been retuned for TerraSAR-X and are implemented in the XMOD2 algorithm module (Li and Lehner, 2013). The main technique is an inversion method consisting of a forward calculation and a comparison with the observations. Input parameters for the forward calculation of the wind related backscatter are: Polarisation, incidence angle, wind direction with respect to satellite heading and wind speed.
• Wind direction: The wind direction is read from the WRF model data and interpolated to the image pixel coordinates. WRF model data are used for consistency checks with streak directions detected on the SAR image, to resolve the 180° wind direction ambiguity and are as well used as a first guess.
• Polarisation Ratio: The GMF coefficients of the XMOD2 core module of the wind retrieval algorithm were tuned for VV polarisation and are converted to HH by a polarisation ratio function. The polarisation ratio applied follows Shao et al. (2014).
• Artifacts: A filter is applied to the quicklook image to remove high backscatter outliers such as ships or offshore structures. A logical landmask is used to prevent over-land wind calculation.
The Algorithm is suitable for co-polarized TerraSAR-X scenes in Spotlight, StripMap, ScanSAR and ScanSAR Wide mode. For cross pol the backscatter values for average wind speed are usually too low for an accurate wind speed determination. Although technically XMOD-2 yields results for all incidence angles, it has been validated for incidence angles between 20° and 45°.
u10 < 20m/s. For further details and application to offshore windfarms see S. Jacobsen et al., this issue.
2.3 Oil Spill Detection
The semi-automatic oil spill detector is based on a manual visual selection of Regions of Interest (ROI) and automatic segmentation, features extraction and classification of the selected ROI.
From all selected ROIs then oil spill related parameters are extracted from the dark spot objects and are used as input parameters for the classification algorithms, which distinguishes between oil spills and look-alikes. A pre-trained Neural Network (NN) is used in operational mode.
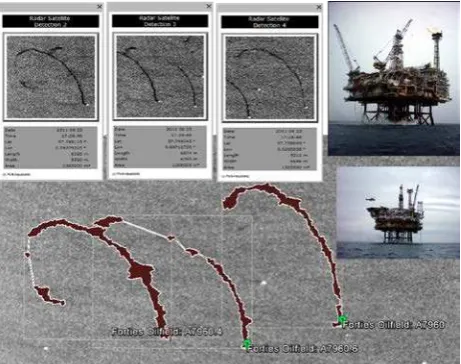
Figure 6 shows an example of a TerraSAR-X stripmap image with oil detected near offshore oil rigs. The movement of the oil on the sea surface has been shown to be related to wind speed.
Figure 6: Example of oil spill detected on an TerraSAR-X image acquired over the North Sea.
2.4 Iceberg Detection
The iceberg detector is loosely based on the CFAR detector. From a sliding window, statistical properties of open water are estimated. Based on this estimation, pixels that do not fit the properties of open water get identified, i.e. icebergs pixels. The standard CFAR detector outputs reliable results in case icebergs are located far away from each other. But in areas of high iceberg density the detection is unreliable, because too many icebergs are located on the sliding window. No more the statistical properties of open water are estimated, but of a mixture of open water and ice. In consequence, many icebergs are missed (see left and middle image).
Figure 7: Example of a TS-X image acquired showing the improvements in iceberg detection from left to right.
The newly developed Iceberg Detector overcomes this problem. A preliminary mask, which roughly distinguishes between ”probably water” and “probably not water”, is added. Only
pixels that are indicated as “probably water” are used for estimating the statistical properties of open water. As can be seen in Figure 7 (on the right), the reliability of detection is significantly improved.
The overall detection rate amounts to 90 %.
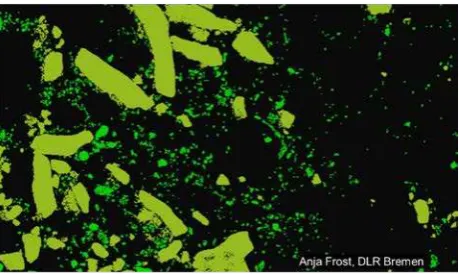
Moreover, a new quality measure that evaluates detected icebergs is implemented. It is based on Markov random fields and a priori knowledge about the backscattering of icebergs. For details on the work on sea ice classification as shown in figure 8 and iceberg detection see R. Ressel et al., this issue.
Figure 8: TerraSAR-X ScanSAR Wide image of the Northern Baltic Feb, 27, 2014, Classification into ice types: Open water, highly deformed pack ice and moderately deformed ice Feb, 27, 2014.
2.5 Ship Detection
Ships are detected by a CFAR-Ship-Detector, which determines bright spots on the ocean surface, depending on a predefined level for false detections, a method that is proven to be robust for NRT services. Figure 9 compares the effect of resolution for different TerraSAR-X modes on ship detection. While at Scan SAR Further ship parameters like length, width and heading are classified after detection, then the use of high resolution Spotlight scenes are especially suited for the detection of ships near coastal areas or at harbors.
The fusion of detection results from spacious scenes with AIS data allows determining ship parameters, predicting ship behavior or validating the results of developed ship detectors.
Figure 9: Comparison of resolutions of different acquisition modes using ships (from left to right Spotlight, Stripmap, ScanSAR, ScanSAR Wide).
The presented ship detection method is designed for MGD-products and works most reliable on HH/HV polarized images. The contrasts between ships and water surface allow detection of smaller vessels below 10 m, dependent on wind speed and sea state over the surrounding area. Multi-polarization is helpful for detecting small targets and their wakes, at the loss of coverage.
performance is determined by using a large dataset of images with varying conditions (like wind, sea state, incidence angle,) and a verified dataset of appropriate AIS messages.
Further details are given in Bentes et al. and Tings et al.
Product information
Detection accuracy
Length estimation accuracy
Width estimation accuracy
Heading estimation accuracy Stripmap
HH
89% 63% 70% 90%
Stripmap VV
92% 83% 83% 95%
ScanSAR VV
92% 69% 61% 89%
ScanSAR Wide VV
58% 72% 75% 80%
Table 1: Performance on Stripmap HH/VV, ScanSAR VV and ScanSAR Wide VV.
2.6 Bathymetry
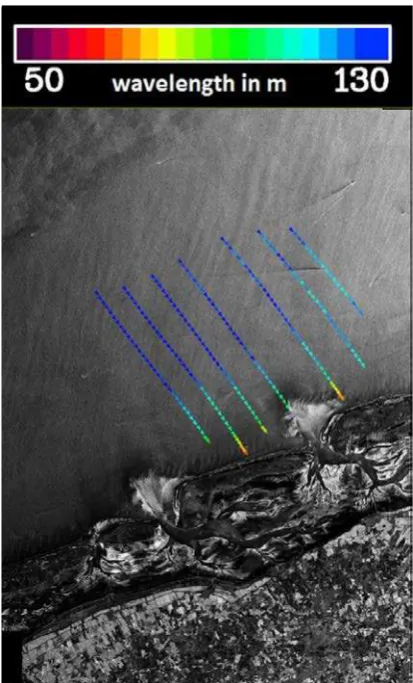
With sea waves approaching land, their wavelength shortens and they are refracted. This change of wavelength and direction is generally termed wave shoaling. The driver of this phenomenon is the interaction between waves and the sea bottom which is empirically known to be of effect with the water depth reaching approximately half a wavelength.
Figure 10: Measurement of the change in peak wave length on a TS-X image of shoaling ocean waves at the German North Sea coast. .
As follows, the retrieval of the water depth from the wavelength applies to shallow/coastal waters with sufficiently long swell waves being required. The connection between wavelength � and water depth d is described by the dispersion relation. The wavelength is well captured by TerraSAR-X images down to peak wavelength of 30 meters. Tracking waves by the XWAVE sea state processor, as described in the subsection 2.1, the reduction of wavelength at wave shoaling is clearly revealed For more information see Pleaskachevsky et al.
2.7 Waterline detection
The algorithm for waterline detection is primarily based on edge detection and iterated flood filling procedures. It was specifically developed for Wadden Sea application, where the tidal flats pose additional challenges compared to most other coastlines due to their highly variable backscattering properties, but is also suitable for most coastal scenes. Figure 11 gives an overview of the algorithms work flow.
Figure 11: Flowchart of the waterline detection algorithm. The output is a binary land/sea mask of the respective input scene.
As input scenes, Stripmap, ScanSAR and ScanSAR wide were tested. The scene should include at least about 30% sea and also 30% mainland for best results. Application to the high resolution modes may be possible if the above criteria can be fulfilled. It is designed to work on MGD images. All polarizations can be used for coastlines without tidal flats. For tidal flats structures, the VV polarization is preferred. Figure 12 shows the results for a scene acquired over the Elbe estuary. Generally, a very high precision of the resulting landmask is achieved. For more details see Wiehle et al this issue.
3. MARITIME SENTINEL-1 PROCESSORS
As Sentinel 1 has been launched recently we here give only a few examples of possible value added maritime products. They are not yet processed on a regular basis and will as well have to be validated against ESA level 2 products, e.g. wave mode higher level products. Current development concentrates on SAR images Sentinel-1 satellite as provided on ESAs data hub. For some processors only integration of former research results and retraining of models was necessary. Other processors require the investigation of different SAR processing and imaging characteristics due to different SAR X- and C-band wavelength and thus different scattering mechanisms.
3.1 Sea State and Wind Field
The processor for the retrieval of sea state map and wind fields is currently under development. As long as the development is ongoing NRT value-adding for both types is performed using the Senitnel-1 OCN processor. The processor is capable of processing all types of Sentinel-1 images and provides wind fields and sea state maps in NRT. Figure 13 shows a sentinel derived wind speed. Such data will later as well become available from Copernicus Core Services. For details on SAR wind field retrieval see Jacobsen et al. this issue
Figure 13: Example of the wind field derived from a Sentinel-1 IW image acquired on 6th of October 2014 over the North Sea..
3.2 Semi-automatic Oil Spill Detection
The oil spill detector is capable of detecting oil spills on Sentinel-1 Ground Range Detected (GRD) images following the same procedure described in However, due to the short acquisition period over less than half a year the amount of oil spills detected so far is small. For that reason the training of the oil spill classification process involves an insufficient amount of data so that oil spills cannot properly be distinguished from look-alikes. As the Sentinel-1 data base is growing
continuously, an appropriate classifier will be available in the near future. Figure 14 shows a Sentinel 1 IW image acquired over the Mediterranean with automatically delineated oil spills.
Figure 14: Example of an oil spill detected on a Sentinel-1 IW image acquired on 4th of October 2014 near Port of Said as downloaded from the ESA Sentinel data hub, shown in Google Earth.
3.3 Iceberg Detection
Iceberg detection has been successfully tested on Sentinel-1 Stripmap, Interferometric (IW) and Extended Wide Swath (IW) data. Figures 15 and 16 show IW images acquired over Antarctica and a first iceberg detection results on a Sentinel IW image.
Figure 15: Example of Sentinel-1 IW image acquired on 4th of May 2014 over Antarctica.
3.4 Ship Detection on Sentinel
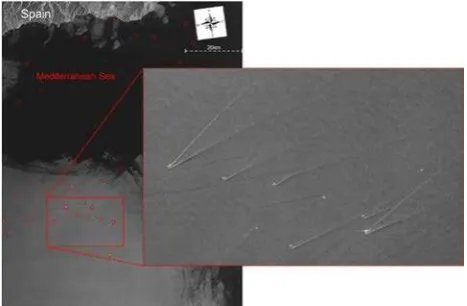
Ship detection is applied on Sentinel-1 Stripmap data. The two imaging modes IW and EW need further investigation because their image acquisition processes complicate the used Azimuth ambiguity filter due to TOPS mode. An example of the ship detection applied on a Sentinel-1 Stripmap acquired over the Mediterranean Sea near to the Strait of Gibraltar is presented in Figure 17. For more information see Velotto et al.
Figure 17: Ship Detection applied on a Sentinel-1 Stripmap image acquired on 4th of October 2014 over Mediterranean Sea near Strait of Gibraltar.
4. SUMMARY AND OUTLOOK
We show an overview of TerraSAR-X and Sentinel-1 maritime products derived for NRT delivery from different intensity modes. Intensity imagery is used for fast and robust results that can be used by a wide range of users.
The software to derive these products is installed at DLRs ground station in Neustrelitz so that information can be delivered in Near Real Time. Validation and campaigns have been performed with partners from Bundespolizei See, the German Weather Service and the Hydrographic Office BSH.
ACKNOWLEDGEMENTS
We acknowledge the provision of TerraSAR-X data by scientific data AOs and from the ESA Sentinel-1 data hub
REFERENCES
Bruck, M. and Lehner, S.,2014, TerraSAR-X/TanDEM-X Sea State Measurements Using the XWAVE Algorithm. International Journal of Remote Sensing
Wiehle, S. and Lehner, S. (Jan 2015): Automated waterline detection in the German Wadden Sea using high-resolution TerraSAR-X images.Journal of Sensors - Special Issue “Ocean and Sea Ice Applications of SAR”
Tings, B., Bentes, C. and Lehner, S. 2014: Dynamically Improved Ship Parameter Estimation on TerraSAR-X Images. International Journal of Remote Sensing, PORSEC 2014 Special Issue
Ressel, R., Frost, A. and Lehner, S. Oct 2014: A Neural Network Based Classification for Sea Ice Types on X-Band SAR
Images. IEEE Journal of Selected Topics in Applied Earth Observations and Remote Sensing
Gebhardt, C., Pleskachevsky, A., Rosenthal, W., Lehner, S., Hofmann, P., Kieser, J. and Bruns, T., 2015: Comparing wavelengths simulated by the coastal wave model CWAM and TerraSAR-X satellite data.In: Ocean Modelling