VALIDATION OF SPACEBORNE RADAR SURFACE WATER MAPPING WITH
OPTICAL sUAS IMAGES
J. Li-Chee-Ming1, K. Murnaghan2, D. Sherman1, V. Poncos3, B. Brisco2, C. Armenakis1
1
York University, 2Natural Resources Canada, 3Kepler Space Inc.
Commission I, ICWG I/Vb
KEY WORDS: sUAS,RADARSAT‐2, wetlands, thematic remote sensing, radar, optical, environmental mapping, validation
ABSTRACT:
The Canada Centre for Remote Sensing (CCRS) has over 40 years of experience with airborne and spaceborne sensors and is now starting to use small Unmanned Aerial Systems (sUAS) to validate products from large coverage area sensors and create new methodologies for very high resolution products. Wetlands have several functions including water storage and retention which can reduce flooding and provide continuous flow for hydroelectric generation and irrigation for agriculture. Synthetic Aperture Radar is well suited as a tool for monitoring surface water by supplying acquisitions irrespective of cloud cover or time of day. Wetlands can be subdivided into three classes: open water, flooded vegetation and upland which can vary seasonally with time and water level changes. RADARSAT‐2 data from the Wide-Ultra Fine, Spotlight and Fine Quad-Pol modes has been used to map the open water in the Peace‐Athabasca Delta, Alberta using intensity thresholding. We also use spotlight modes for higher resolution and the fully polarimetric mode (FQ) for polarimetric decomposition. Validation of these products will be done using a low altitude flying sUAS to generate optical georeferenced images. This project provides methodologies which could be used for flood mapping as well as ecological monitoring.
1.0 INTRODUCTION AND BACKGROUND
Water is an important resource and information about surface water conditions can help a wide variety of applications including hydrology, meteorology, ecology, and agronomy. Synthetic Aperture Radar (SAR) has long been recognized as an important source of data for monitoring surface water, especially under inclement weather conditions, and is therefore used operationally for flood and surface water mapping applications (Brisco et al., 2008, 2009; Brisco, 2015). The vegetation canopy penetration capability of the microwaves also allows for mapping of flooded vegetation as a result of enhanced backscatter, often from a double bounce scattering mechanism (Alsdorf et al., 2001). Previous investigations have shown that, under certain conditions, the SAR response signal from flooded vegetation may also remain coherent during repeat satellite over-passes which can be exploited by interferometric SAR (InSAR) measurements and data processing procedures for estimating water levels (Lu et al., 2005, 2008; Wdowinski et al., 2008; Kim et al., 2009; Hong et al., 2010). Given the onset and future promise of SAR-based constellations, e.g. Sentinel-1 and the RADARSAT Constellation Mission (RCM), there is a need in Canada to research, develop and operationalize the use of SAR for monitoring terrestrial wetlands and watersheds.
In order to understand the potential of the RCM and other SAR platforms to monitor water level in wetlands and watersheds, this project examines wetland characteristics that lead to coherence in satellite radar, principally using RADARSAT-2 InSAR data, and determines the annual variation in the coherence through experimental field studies using corner reflectors and water gauges. Polarimetric decomposition is also used to study the radar scattering mechanisms of the wetlands (Touzi et al., 2007; Brisco et al., 2011; Gallant et al., 2014). The results demonstrate that, despite prevailing knowledge, many wetlands maintain coherence throughout the growing year. There is indication that this is not due to the double bounce scattering mechanism alone and involves a combination
of different scattering mechanisms, including a minor double bounce component. Open water areas without emergent aquatic vegetation generally do not have suitable coherence for water level estimation, whereas most swamps and marshes do.
These results indicate that the use of Coherence Change detection (CCD) could be an effective approach for monitoring changes in flooded vegetation with the RCM. This was demonstrated in all test sites and will be investigated further as an alternate approach to the more typical use of polarimetry for identifying flooded vegetation (both season and ephemeral). This will help improve the value of these products for environmental applications and can also help improve the flood products by adding flooded vegetation to the output.
This project uses InSAR for water level estimation, polarimetry for flooded vegetation, and image thresholding for surface water delineation. These activities are being conducted under the Remote Sensing Science program of the Canada Centre for Mapping and Earth Observation for the RADARSAT Constellation Mission (RCM).
This particular work is conducted to provide ground validation of test sites. Small unmanned aerial systems (sUAS) are used to provide low altitude aerial surveys. This work aims to provide a thorough understanding of sUAS and low-altitude aerial survey, planning, executing and delivering georeferenced image mosaics over wetlands. This paper describes this project.
2.0 SITE AND DATA DESCRIPTION
2.1 Site Description
Regional Municipality of Wood Buffalo, west and south of the historical community of Fort Chipewyan. The delta encompasses approximately 321,200 ha (794,000 acres), formed where the Peace and Athabasca rivers converge on the Slave River and Lake Athabasca. The delta region is designated a wetland of international importance and a UNESCO World Heritage Site.
Figure 1.Satellite image map of the Peace-Atahabasca Delta (PAD) study area, indicating land cover characteristics and location of hydrology stations for in-situ data collection. 2.2 SAR data.
The RADARSAT-2 data includes spotlight, ultra-fine wide and polarimetric modes of operation which provides for a wide range of resolution, swath width, and polarization options. The Wide Ultra-Fine and Fine Quad-Pol modes are used for the InSAR analyses including coherence analyses while the fully polarimetric mode is used for the decomposition analyses. These data streams have been acquired since 2012 for the ice-off season with a nominal 24 day repeat coverage.
Standard processing of the SAR data is used to produce the surface water products, the coherence products and interferograms as well as the polarimetric decompositions using a combination of PCI, GAMMA, and in-house software. The processing includes radiometric and geometric processing steps to arrive at a relative noise-free otho-rectified product for easy GIS input by end-user partners. Additional details can be found in Brisco et al., 2015.
2.3 sUAS data
The sUAS used this project was the DJI Phantom Vision 2+ system (Figure 2). The system is equipped with a 14 megapixel camera with a field of view of 100 degrees. The camera is mounted onto a 3-axis gyro-stabilized gimbal. The camera can record video in 1080p HD video at 30 frames per second, or be set into image capture modes, triggered manually or at regular intervals. The sUAS is also equipped with a single frequency GPS, a MEMS IMU, and digital compass.
Flights were conducted using both manual control and pre-planned grids. While the pre-pre-planned grids were useful for systematic coverage of a given study area, it was found to be inefficient due to the large scale homogeneous ground coverage features without water (e.g. large mud flats, large grass land regions) that resulted in blocks of images without information
useful to the study. As a result, the majority of flights were performed using manual control, with two pilots, in order to maximize the amount images that included ground water coverage. The pilot was tasked with controlling the sUAS and maintaining line of sight with the unit, while the navigator was responsible for tracking the platform on a map and viewing the acquired images in real time to ensure that the platform captured all local surface water features (water features within the immediate flight zone). The sUAS was flown at an altitude of 90 metres above ground level, with 80% front overlap and 40% side overlap. Agisoft Photoscan (Agisoft, 2015) was used to generate an ortho-image (5 centimetre GSD) from the sUAS data. Figure 3 shows a sample frame collected by the sUAS.
Figure 2. The DJI Phantom 2 Vision+ quadcopter sUAS.
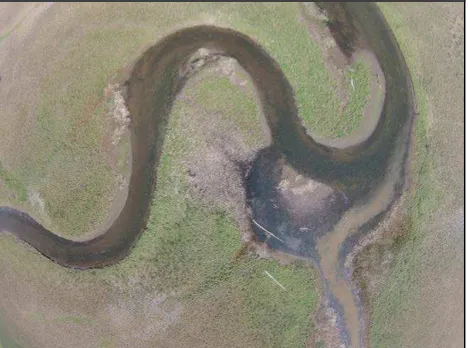
Figure 3. Sample image from the DJI Phantom 2 Vision+ wide-angle camera, flying 90 metres above ground level.
3.0SAR AND UAS PRODUCT EXAMPLES
3.1 SAR Product Examples
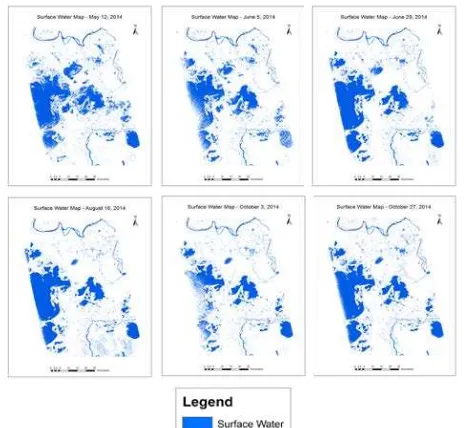
Figure 4. Example surface water product from the PAD for 2014.
Figure 5. Example coherence product of the PAD for 2012 to 2014.
4.0 VALIDATION METHODOLOGY AND RESULTS
The results of the presented experiment validate the water delineation from SAR imagery using ortho-image mosaic generated from the sUAS images. The red rectangle in Figure 8 shows the area of interest, a segment of the Quatre Forches River. Figure 9 shows the sample SAR image (left) and sUAS ortho-image mosaic (right) of the same area. The SAR image
has 2 metre spatial resolution. The sUAS ortho-image mosaic was resampled from 5 centimetre spatial resolution to 2 metres in order to perform the comparison with the SAR imagery. The green dots in Figure 9 indicate the ground control points (GCPs) that were used to further correct the planimetry of the sUAS ortho-image mosaic. These 4 points were surveyed using Trimble NetR9 GPS receivers. The estimated horizontal accuracy is ±2cm.
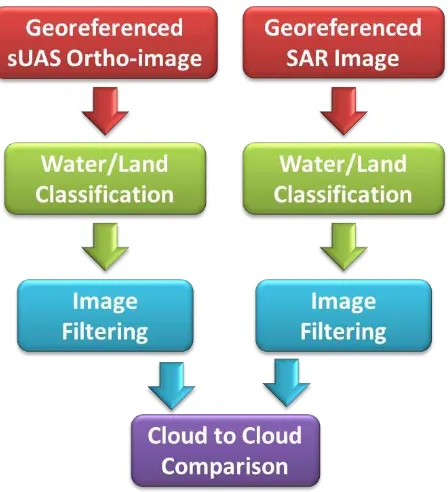
The image processing work flow for both the sample SAR imagery and the sUAS georeferenced image mosaic is provided in Figure 7.
Figure 6. Example Freeman-Durden decomposition product of the PAD for 2014. The double bounce scattering is in red which highlights wetlands due to flooded vegetation.
Firstly, each image was classified as either water or land using the ENVI’s (Excelisvis, 2015) Maximum Likelihood Supervised Classification (Figure 10). Each image was then passed through a median filter to remove salt and pepper noise, then a Laplacian filter was used to extract the edges from each image (Figure 11). The UTM coordinates of the pixels representing image edges were then extracted and stored as 2D points. After manually segmenting the land-water boundary, CloudCompare’s Cloud to Cloud (C2C) comparison tool (EDF R&D, 2011) was used to measure the distances between the two boundaries (Figure 12). The C2C function takes in a “reference” point cloud and a “compared” point cloud. A distance is calculated from every point in the reference cloud, along its normal vector to the intersection of the compared cloud.
Figure 7. Image processing workflow to validate land/water delineation using RADARSAT-2’s SAR imagery.
Figure 8. Geocoded RADARSAT-2 intensity image from June 27, 2015 using mode SLA16 with an incidence angle of 42 degrees acquired on an ascending pass looking right. The red rectangle outlines the area of interest, a segment of the Quatre Forches River. The image is projected in NAD83 UTM Zone 12N.
site was blocked by the trees just west of the bank. This is not the case for the eastern bank, as indicated by the strong signal response (white pixels) and the clean edge (river bank) extracted from the SAR image.
Finally, the two datasets are best aligned around the 3 three northern ground control points. This suggests the accuracy of the alignment will increase with more ground points in the south.
Figure 9. The test area shown in the RADARSAT-2 image (left) and sUAS ortho-image mosaic (right). The green dots represent the GPS ground control points used to further correct the planimetry of the sUAS ortho-image mosaic.
Figure 10. Output from the Maximum Likelihood supervised classification. Left: SAR image. Right: sUAS ortho-image mosaic. Green represents land, red represents water, blue represents unclassified.
5.0 SUMMARY
Figure 11. Output from the Median filter and Laplacian edge detector. Left: SAR image. Right: sUAS ortho-image mosaic.
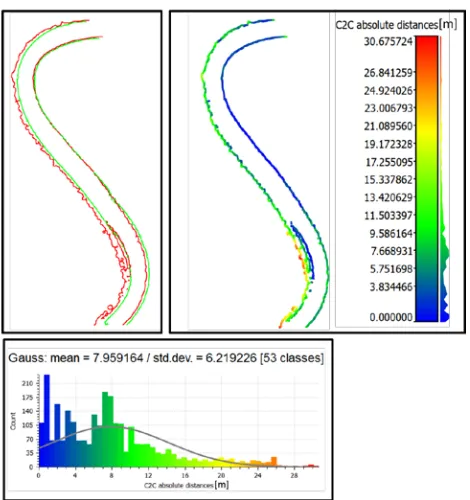
Figure 12. Left: Visual comparison between the surface water delineation outputs from the SAR image (red) and the sUAS ortho-image mosaic (green). Right: CloudCompare’s Cloud to Cloud (C2C) comparison. Every point of the surface water delineation from the SAR image is shown. The colour represents the distance from that point to a point in the sUAS dataset. Bottom: Statistics for the calculated distances.
ACKNOWLEDGMENTS
This study was made possible with the financial support of the Government of Canada, specifically through the Canadian Space Agency (CSA) Government Related Initiative Program (GRIP) and through Natural Resources Canada/Canada Centre for Mapping and Earth Observation.
REFERENCES
Agisoft. 2015. Agisoft PhotoScan. Retrieved from http://www.agisoft.com/. (access: 12 August, 2015).
Alsdorf, D. Smith, L. and J. Melack. 2001. Amazon floodplain water level changes measured with interferometric SIR-C radar,
IEEE Transactions on Geoscience and Remote Sensing 39: 423−431.
Brisco, B. Touzi, R. van der Sanden, J.J. Charbonneau, F. Pultz, T.J. and M. D’Iorio, M. 2008. Water resource applications with RADARSAT-2 – a preview. International Journal of Digital Earth :130 – 147.
Brisco, B. Short, N. van der Sanden, J.J. Landry, R. and D. Raymond. 2009. A semi-automated tool for surface water mapping with RADARSAT-1, Canadian Journal of Remote Sensing 35: 336-344.
Brisco, B. Kapfer, M. Hirose, T. Tedford, B. and J. Liu. 2011. Evaluation of C-band Polarization Diversity and Polarimetry for Wetland Mapping. Canadian Journal of Remote Sensing 37: 82-92.
Brisco, B., K. Murnagham, A. Chichagov, L. White, 2015. Monitoring Terrestrial Wetlands and Watershed Basins with RCM Rapid Revisit and CCD Mode - Annual Project Report
submitted to the Canadian Space Agency, March 31, 2015. Earth Sciences Sector, Natural Resources Canada, Ottawa, 52 pages.
Brian Brisco, 2015. Remote Sensing of Wetlands: Applications and Advances”, Chapter 7 in Remote Sensing of Wetlands: Applications and Advances, Editors: Ralph W. Tiner, Megan W. Lang, and Victor V. Klemas, CRC Press, Print ISBN: 978-1-4822-3735-1, eBook ISBN: 978-1-4822-3738-2
EDF R&D., T.P. 2011. CloudCompare (version 2.5) [GPL software]. Retrieved from
http://www.danielgm.net/cc/ (accessed: 11 August, 2015).
Excelisvis. 2015. ENVI 5. Retrieved from
http://www.exelisvis.com/envi-5/ (accessed 5 August, 2015). Gallant, A.L., S. Kaya, L. White, B. Brisco, M.F. Roth, W.J. Sadinski, and J.A. Rover, 2013 Detecting emergence, growth, and senescence of wetland vegetation with polarimetric synthetic aperture radar (SAR) data, Special Issue on "Wetlands and Sustainability" in Water 2014, 6, 694-722; doi:10.3390/w6030694.
Hong, S.H. Wdowinski, S. Kim, S.W. and J. S. Won. 2010. Multi-temporal monitoring of wetland water levels in the Florida Everglades using interferometric syntehtica aperture radar (INSAR). Remote Sensing of Environment 114: 2436 2447.
Kim, J.W. Lu, Z. Lee, H. Shum, C.K. Swarzenski, C.M. Doyle, T.W. and S.-H. Baek., 2009.Integrated analysis of PALSAR / Radarsat-1 InSAR and ENVISAT altimeter data for mapping of absolute water level changes in Louisiana
wetlands. Remote Sensing of Environment 113:2356-2365.
Lu, Z. and O. I. Kwoun, “Radarsat-1 and ERS InSAR analysis over southeastern coastal Louisiana: Implications for mapping water-level changes beneath swamp forests,” IEEE Transactions on Geoscience and Remote Sensing, vol. 46, no. 8, pp. 2167-2184, Aug, 2008.
Touzi, R., Deschamps, A. and G. Rother. 2007. Wetland characterization using polarimetric RADARSAT-2 capability.
Canadian Journal of Remote Sensing 33:S56 -SS67.