AUTOMATED MAPPING OF BURNED AREAS IN SEMI-ARID ECOSYSTEMS USING
MODIS TIME-SERIES IMAGERY
L.A. Hardtkea, *, P. D. Blancoa, H. F. del Valle a, G. I. Metternicht b, W. F. Sione c,d
a National Patagonian Center-Argentinean National Research Council, Terrestrial Ecology Unit, U9120ACD Puerto Madryn,
Chubut, Argentina – [email protected]; [email protected]; [email protected] b Institute of Environmental Studies, School of Biological, Earth and Environmental Sciences, University of New South Wales,
Sydney, NSW 2052 – [email protected]
c Autonomous University of Entre Ríos, CP 3100 Paraná, Entre Ríos, Argentina– [email protected] d UnLu-PRODITEL, 6700 Lujan, Buenos Aires, Argentina.
Commission VI, WG VI/4
KEY WORDS: Bushfires, Time Series, Image Segmentation, MODIS, Normalized Burn Ratio, Rangelands
ABSTRACT:
Understanding spatial and temporal patterns of burned areas at regional scales, provides a long-term perspective of fire processes and its effects on ecosystems and vegetation recovery patterns, and it is a key factor to design prevention and post-fire restoration plans and strategies. Standard satellite burned area and active fire products derived from the 500m MODIS and SPOT are avail able to this end. However, prior research caution on the use of these globalscale products for regional and subregional applica -tions. Consequently, we propose a novel algorithm for automated identification and mapping of burned areas at regional scale in semi-arid shrublands. The algorithm uses a set of the Normalized Burned Ratio Index products derived from MODIS time series; using a two-phased cycle, it firstly detects potentially burned pixels while keeping a low commission error (false detection of burned areas), and subsequently labels them as seed patches. Region growing image segmentation algorithms are applied to the seed patches in the second-phase, to define the perimeter of fire affected areas while decreasing omission errors (missing real burned areas). Independently-derived Landsat ETM+ burned-area reference data was used for validation purposes. The correlation between the size of burnt areas detected by the global fire products and independently-derived Landsat reference data ranged from R² = 0.01 - 0.28, while our algorithm performed showed a stronger correlation coefficient (R² = 0.96). Our findings confirm prior research calling for caution when using the global fire products locally or regionally.
1. INTRODUCTION
Over the past few decades wildfires have received significant attention because of the wide range of ecological, economic, social, and political values at stake. Their impacts rely heavily on the intensity, frequency and spatial distribution, which in turn are influenced in complex ways by several natural and anthropic factors. The understanding of these feedbacks at regional scale depends on an accurate knowledge of the timing and extent of fire events. As collecting fire data in the field is time consuming, expensive and difficult, especially in remote areas, many studies have investigated the ability of satellite imagery to monitor biomass burning and produce accurate burned area estimates, proving to be a cost effective, objective and time-saving tool (Chuvieco and Kasischke, 2007).
A range of multi annual global-satellite-derived fire products have been developed over the last decade using automated and semi-automated algorithms for systematic fire-affected area mapping over long time series including MODIS total burned area (MCD45A1), the active fire algorithm (MOD14); and the L3JRC SPOT VEGETATION 1km GLOBCARBON products. While these fire products appear suitable at the global scale, detection and mapping of burned areas at regional and local levels remains challenging due to the diverse and complex patterns associated to the spectral response of burned areas over space and time.
Accordingly, this paper investigates whether global fire products can cater for the provision of accurate data and information on wildfires (or bushfires) over small areas, and/or complex spatial patterns that are common to semiarid ecosystems. To this end we developed and tested a novel algorithm for automatic delimitation of burned areas at regional or local scale, using the semi-arid Monte ecosystems
of Argentina as pilot study area, and compared its performance with selected MODIS-and SPOT VEGETATION-derived global fire products.
2. MATERIAL AND METHODS 2.1 Input data set
The primary input for the proposed burned area algorithm was the 2000-2011 time series of the MODIS-derived Normalized Burned Ratio index (NBR), and the temporal difference of consecutive images (dNBRt=NBRt-NBRt-1). The NBR index serves to detect burned areas, while the dNBR measures burn severity. The NBR index for the study area was obtained using 16 days composites (maximum value composite) of MOD13Q1, bands 2 and 7.
2.2 The burned area algorithm
Figure 1 shows a flowchart summarizing the methodological steps of the burned areas algorithm. The input data are the Normalized Burned Ratio Index (NBR) derived from the MODIS time series aforementioned. The burned area algorithm works in two phases, executed iteratively. The first phase aims to detect ‘potentially burned’ pixels while keeping a low commission error (false detection of burned areas); these pixels become ‘seed patches’ and are input to a region growing image segmentation algorithm to delineate the perimeter of the fire affected area, decreasing omission errors in this process (missing real burned areas).
The first phase of detecting potentially burned pixels includes two stages; the first one aims to detect abrupt changes and the second one to detect persistent changes (Figure 2), based on
The International Archives of the Photogrammetry, Remote Sensing and Spatial Information Sciences, Volume XL-7/W3, 2015 36th International Symposium on Remote Sensing of Environment, 11–15 May 2015, Berlin, Germany
This contribution has been peer-reviewed.
the values of NBR and dNBR. The resulting pixels are labelled as seed areas. The secondphase uses the seed patches to define the perimeter of the burned area through applying a region growing image segmentation algorithm.
2.3 Validation with independently-derived reference data The mapping accuracy of the output results was assessed using reference data obtained from independently-derived Landsat Enhanced Thematic Mapper Plus (ETM+) burned-areas. Reference burned area perimeters were obtained by supervised classification of Landsat ETM+ images of 30 m spatial resolution.
Linear regression equations were fitted between the results generated by the burned areas algorithm applied on the MODIS-derived NBR, and the independently derived Landsat reference estimations of burned area using a 5x5 km grid.
2.4 Comparison with global fire products
MCD45A1 burned area and MOD14A1 active fire products, and the SPOT VGT derived L3JRC products were used to compare their performance with the results of our algorithm.
3. RESULTS AND DISCUSSION
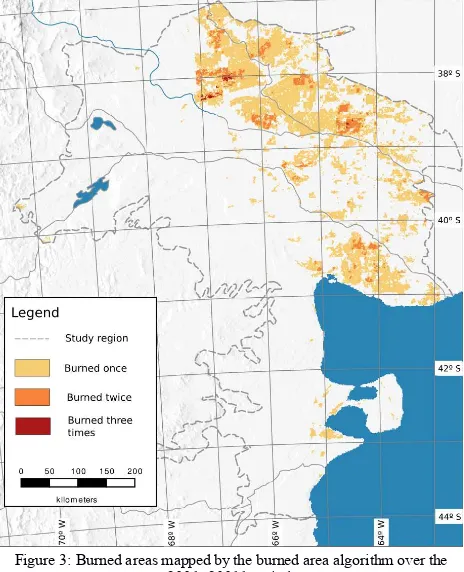
The burned area algorithm allowed to detect 768 wildfires during the 11 years analysed (Figure 3). The total burned area was computed as 47,330 km², which represents 23.11% of the study region. Most of the burned area was burnt by a few large
fires; 95% of the burned area (44,960 km²) was caused by only 18% of the fires. Moreover, the 11 biggest fires burned almost 50% of the total burned area. These large fires mostly occurred in the 2000/2001 season that was particularly dry in the region. On the other hand, fires with sizes smaller than 100 km² occurred with higher frequency, about 45 annually. Although they represent about 80% of the fire numbers, they accounted for only 20% of the burned area.
Regarding wildfires recurrence, the analysis indicates that most of the burned areas were burned once over the 11 year period considered in this research, and only 3,813 km ² (or 1.57% of the total area) burned twice. Furthermore only 160 km ² (or 0.5 % of the total burned area) burned three times. The mean fire return interval (FRI, analyzed years/total burned area/total area) in the study area was of 50.84 years. Compared with other studies in similar areas, we found a slightly longer Figure 2: Temporal variation of the average of the NBR and dNBR index
on a burned area indicating the abrupt change in the dNBR index and persistent change the NBR index.
Figure 3: Burned areas mapped by the burned area algorithm over the 2001–20011 period.
Figure 1: Flowchart of the burned areas detection algorithm indicating input and output data (white panels) and the main processes (Grey panels). The algorithm is applied recursively to each image in the time series, from 2001-001 to 2011-365.
The International Archives of the Photogrammetry, Remote Sensing and Spatial Information Sciences, Volume XL-7/W3, 2015 36th International Symposium on Remote Sensing of Environment, 11–15 May 2015, Berlin, Germany
This contribution has been peer-reviewed.
FRI. For example, Brown et al. 2002 found a FRI of 36 ± 10 years, Stein et al. (2013) found a FRI of less than 35 years and Keeley (2005) found a FRI between 10 and 20 years. These differences could be due to the lesser influence of anthropogenic activities in our region..
3.1 Validation with independently-derived reference data
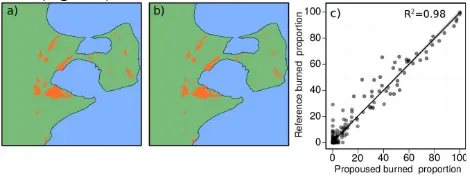
A total of 1490, 5x5 km grid cells covering the validation area (37,250 km2) were considered in the validation process. The independently derived reference data indicates that 132 (8.85 %) grid-cells were affected by a total of 21 individual wildfires in different proportions. The outputs of the burned area algorithm are in a close agreement with the Landsat reference data; the overall regression slope between our results and the reference burned areas perimeters was 0.99, with R2 equal to 0.96 (Figure 4).
3.2 Comparison with global fire product
The global fire products (L3JRC, MOD14A2, MCD45A1) showed a poorer agreement with the reference data in comparison with estimations from the burned area algorithm, as evidenced by the low R2 values of the fitted regression models (Table 1 and Figure 5). The analysis of the slopes of the regression models indicates the largest over-estimation of fire-affected areas to occur when using the SPOT VEGETATION being lesser than 60% compared to burned area detection by Landsat.
Table 1. Accuracy in detection of burned areas at regional scale of global products.
Product R2 Intercept Slope
L3JRC (VGT Burned Areas) 0.01 6.18 (slope=0.06)
MOD14A2 (Active Fires) 0.25 5.09 (slope = 0.97)
MCD45A1 (Burned Areas) 0.05 7.57 (slope = 1.15)
Comparing MOD14A2 with MOD45A1 Roy et al. (2008) found the active fire product detected larger burned areas than the MODIS burned area product, in concordance with our results. Furthermore, Roy and Boschetti (2009) compared SPOT VEGETATION L3JRC with MOD45A1 and found that the former underestimated much of the burned area (only detected 14 %), unlike our results; while MOD45A1 moderately underestimated burned areas (75 %, similar to our results). The authors argued that global burned area products fail to meet accuracy requirements for local or regional scale mapping. These findings highlight that algorithm accuracy is dependent on ecosystem type and size of burned areas to be detected; thus the algorithms should be designed and validated considering the type of coverage, and accounting for inter-seasonal variations to capture a greater variability of fire size.
4. CONCLUSIONS
The semi-desert biome is widely distributed on the earth's surface; the Köpens climate classification places estimates it covers a tenth of the land surface (11.17%). The influence of climate change on wildfires on this type of biome is difficult to predict; although some authors have suggested that an increase of wildfires is very likely to occur directly, due to an increase in climate variability and as a consequence of warmer weather (IPCC 1996, WG II, Chapter 2), and indirectly because fires may reduce local precipitation because fire-emitted aerosols increase in the number of cloud condensation nuclei, producing smaller cloud droplets that are less likely to fall as rain (IPCC 1996, WG II, Chapter 1). The latter predictions add significance to evaluation studies as discussed in this paper. While global fire products MCD45A1, MOD14A2 and L3JRC appear to deliver well cartography for ecosystems at global scale, our research demonstrates significant limitations in their ability to detect and map wildfires in semi-arid ecosystems at regional or local scale. The global fire related products did not show a good agreement with reference data, which highlights the need for caution when applying these global products at local or regional levels.
The locally-adaptive algorithm we developed using time series of MODIS-derived NBR index outperformed all the global products in mapping the extent and number of burned areas in a semi-arid ecosystems at regional scale. The validation by
Figure 4: Spatial distribution of burned areas a) on the reference data b) on the output of the burned area algorithm and c) scatter plot of the proportions of 5 × 5 km cells labeled
as burned by the burned area algorithm, plotted against the proportion labeled as burned by reference data. The regression
line is plotted as a solid black line, and smoothed 0.95 confidence interval in gray.
Figure 5: Spatial distribution of burned areas detected by a) MOD14, b) MOD45, c) MOD 45; and scatter plot of the proportions of 5 × 5 km cells
labeled as burned by the c) MOD14, d) MOD45, and e) L3JRC plotted against the proportion labeled as burned by reference data. The regression
lines are plotted as a solid black line, and smoothed 0.95 confidence interval in gray.
The International Archives of the Photogrammetry, Remote Sensing and Spatial Information Sciences, Volume XL-7/W3, 2015 36th International Symposium on Remote Sensing of Environment, 11–15 May 2015, Berlin, Germany
This contribution has been peer-reviewed.
linear regressions between high resolution data and the burned area algorithm outputs, generated for 11 years of data, indicates that the algorithm accurately maps burned areas. The developed algorithm is an improvement on previous methods, mainly due to the possibility of keeping relatively relaxed thresholds without compromising commission errors. Since our algorithm uses freely accessible Terra and Aqua MODIS products, it can provide inexpensive, more reliable and salient information for decision-making on land management in semi-arid environments (e.g. shrublands, rangelands). Our findings have significant implications for the implementation of reliable early warning monitoring systems at regional, sub-regional and national scales. Even though we consider that due to its relative simplicity (e.g. few parameters) the algorithm might be easily adapted to other biomes, further research is needed to test its performance in other biomes and to evaluate its accuracy depending on vegetation cover type. In this regard, we are currently working on implementing the burned area algorithm in southern South America, over the 2000-2012 time period.
Our investigation suggest that for detecting burned areas in other geographic regions using this algorithm the following steps are needed prior to implementation: 1) determine the relative inaccuracy of fire detection due to sensor properties (e.g., signal to noise ratio) and scene variability, 2) adjust the algorithm with regard to the NBR thresholds, 3) investigate the sensitivity of semi-automated burned area detection to land cover and its properties, the size and shape of burned areas, and confusion with other forms of vegetation removal. Lastly, fire detection algorithms can improve detection accuracy if the user community plays an active role in defining fire product requirements, becoming actively involved in product development, implementation, and validation efforts.
REFERENCES
Chuvieco, E., Kasischke, E., 2007. Remote sensing information for fire management and fire effects assessment. Journal of Geophysical Research: Biogeosciences 112, 1-8.
IPCC, 1996. Impacts, Adaptation and Mitigation Options. IPCC, Working Group II, Cambridge: Cambridge University Press, 878 pp.
Keeley, J., 1986. Resilience in mediterranean-type ecosystems. In B. Dell, A. Hopkins, B. Lamont (Eds.) Tasks for vegetation science. Dordrecht: Springer Netherlands. Pp. 95-112.
Keeley, J., 2005. Fire history of the San Francisco East Bay region and implications for landscape patterns. International Journal of Wildland Fire 14, 285-296.
Roy, D., Boschetti, L., 2009. Southern Africa Validation of the MODIS, L3JRC, and GlobCarbon Burned-Area Products. IEEE Transactions on Geoscience and Remote Sensing 47, 1032-1044.
Roy, D., Boschetti, L., Justice, C., Ju, J., 2008. The collection 5 MODIS burned area product - Global evaluation by comparison with the MODIS active fire product. Remote Sensing of Environment. 112, 3690-3707.
Stein, S.M., Menakis, J., Carr, M.A., Comas, S.J., Stewart, S.I., Cleveland, H., Bramwell, L., Radeloff, V.C. 2013. Wildfire, wildlands, and people: understanding and preparing for wildfire in the wildland-urban interface—a Forests on the Edge report. Gen. Tech. Rep. RMRS-GTR-299. Fort Collins,
CO. U.S. Department of Agriculture, Forest Service, Rocky Mountain Research Station. 36 p.
The International Archives of the Photogrammetry, Remote Sensing and Spatial Information Sciences, Volume XL-7/W3, 2015 36th International Symposium on Remote Sensing of Environment, 11–15 May 2015, Berlin, Germany
This contribution has been peer-reviewed.