NEAR REAL-TIME AUTOMATIC MARINE VESSEL DETECTION ON OPTICAL
SATELLITE IMAGES
G. M´attyusa a
DLR, Remote Sensing Technology Institute, Oberpfaffenhofen 82234 Wessling, Germany - [email protected]
KEY WORDS:Marine, Monitoring, Artificial-Intelligence, Satellite, Optical, Real-time
ABSTRACT:
Vessel monitoring and surveillance is important for maritime safety and security, environment protection and border control.
Ship monitoring systems based on Synthetic-aperture Radar (SAR) satellite images are operational. On SAR images the ships made of metal with sharp edges appear as bright dots and edges, therefore they can be well distinguished from the water. Since the radar is independent from the sun light and can acquire images also by cloudy weather and rain, it provides a reliable service.
Vessel detection from spaceborne optical images (VDSOI) can extend the SAR based systems by providing more frequent revisit times and overcoming some drawbacks of the SAR images (e.g. lower spatial resolution, difficult human interpretation). Optical satellite images (OSI) can have a higher spatial resolution thus enabling the detection of smaller vessels and enhancing the vessel type classification. The human interpretation of an optical image is also easier than as of SAR image.
In this paper I present a rapid automatic vessel detection method which uses pattern recognition methods, originally developed in the computer vision field. In the first step I train a binary classifier from image samples of vessels and background. The classifier uses simple features which can be calculated very fast. For the detection the classifier is slided along the image in various directions and scales. The detector has a cascade structure which rejects most of the background in the early stages which leads to faster execution. The detections are grouped together to avoid multiple detections. Finally the position, size(i.e. length and width) and heading of the vessels is extracted from the contours of the vessel. The presented method is parallelized, thus it runs fast (in minutes for16000×16000 pixels image) on a multicore computer, enabling near real-time applications, e.g. one hour from image acquisition to end user.
1 INTRODUCTION
Monitoring the marine vessels is crucial for increasing the safety and security of the maritime traffic and preventing illegal activ-ities on the waters, e.g. illegal fishery, pollution, immigration, smuggling and piracy. The larger vessels are equipped with the Automatic Identification System (AIS), which transmits the loca-tion of the ship to the center via radio communicaloca-tion. Beside this collaborating monitor system remote sensing based systems are also used. To detect illegal activities it is important to locate the vessels also without functioning AIS. The AIS might be pur-posely switched off, defected or simply a smaller vessel (e.g. sail boat, fishing boat) is not equipped with this system.
Vessel and pollution detection systems based on Synthetic-aperture Radar (SAR) satellite images are operational (e.g. the CleanSeaNet Program of the EUROPEAN MARITIME SAFETY AGENCY, EMSA)1. The paper (Greidanus et al., 2004) describes a bench-marking of operational SAR vessel detection methods. The paper (Brusch et al., 2011) describes ship detection with the TerraSAR-X satellite. The characteristics of SAR images enable reliable op-erations also by rainy and cloudy weather independent from the sun light conditions. Since the vessels are typically made of metal and their structure contains sharp edges they reflect the radar rays intensively, thus on the SAR images the vessels on open waters are bright dots and edges. Beside these ideal properties of SAR images, they have some disadvantages, e.g. the spatial resolution and the revisiting times are limited. It is difficult to detect a vessel below 15 meters length.
Vessel detection on optical satellite images (VDOSI) can extend the SAR based systems. Optical satellite images (OSI) can have a higher spatial resolution, thus enabling the detection of smaller vessels and enhancing the vessel type classification. The human interpretation of an optical image is easier than as of a SAR image
1http://emsa.europa.eu/operations/cleanseanet.html
(e.g. for a large vessel its name can be read from the side of the ship). The tasking of an optical satellite is more agile as of a SAR satellite. The drawback of optical satellites is that they heavily depend on the weather and they can work only during daytime. Because of these reasons their image production is less reliable, but they can be tasked more agile by using different off-nadir angles. Optical satellites combined with SAR satellites can provide a more frequent monitoring.
The VDOSI is still a challenging task, specially for small vessels. In many cases the visual appearance of background objects (e.g. rocks, shore, port, waves) is very similar to the vessels. This makes the correct classification difficult. The vessels have a high variety in both shape (e.g. fishing boat, ferry, yacht, oil tanker, etc.) and size (from a few meters to a few hundred of meters). The optical images can have different off-nadir angles which results in different visual appearances. The detector has to consider all these varieties. New methods are still investigated to deal with these challenges.
Related work Corbane et al. in (Corbane et al., 2010) de-scribe an automatic detection model based on statistical meth-ods, mathematical morphology and other signal-processing tech-niques such as the wavelet analysis and Radon transform. They use panchromatic SPOT images with 5 meter resolution.
Zhu et al. in (Zhu et al., 2010) present a hierarchical complete and operational automatic vessel detection approach based on shape and texture features, which is considered a sequential coarse-to-fine elimination process of false alarms. The method works on CBERS images with 20 meter resolution and SPOT image with resolutions 5 and 10 meters.
2 DESCRIPTION
field. The input for the detection is a single channel, 8 bit, geo-referenced image. The detector is based on the object detection framework originally used for face detection in (Viola and Jones, 2004).
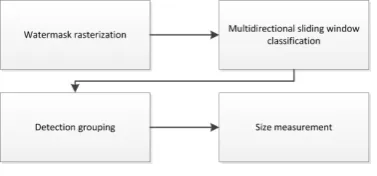
The core part of the detector is a binary classifier which distin-guishes image windows of vessels from non-vessels. This clas-sifier is trained offline. During the online detection a window is slided along the image with different orientation and size and classified as vessel or background. The classified windows are grouped together to avoid multiple detection. The image win-dows classified as vessels contain also the surrounding areas around the vessels. The accurate size of the vessel is measured by ex-tracting the contours of the vessel with image segmentation. The figure 1 shows the process diagram.
Figure 1: The detection process
2.1 The classifier
Features The classifier uses the Haar-like features extended with the tilted Haar-like features (Lienhart and Maydt, 2002). The Haar-like features are simple features based on the difference of the sum of the intensity values at two image areas. The figure 2 shows the used Haar-like features, where the feature value is the sum difference between the black and the white image area. The number of the possible Haar-like features is much higher than the number of pixels in the image, so the information in the image is overrepresented but during the training the important features are selected. The figure 3 shows the first two Haar-like features selected by the training. Using the integral images the features can be calculated extremely efficient, by a few memory accesses and arithmetic operations, and the number of operations is inde-pendent from the size of the feature. Thus the computational cost of the feature extraction is low.
Figure 2: The used Haar-like features from
Figure 3: The first Haar-like features of the classifier
I have also considered using the HOG-features like in (Zhu et al., 2006). These features are efficient for larger object sizes, they
were typically used with64×128detection window. In our case the detection window has a size of12×24because the detected objects are also small. This size is closer to the detection window size24×24used in (Viola and Jones, 2004) with Haar-features.
AdaBoost The Haar-like features are weak-classifiers, they pro-vide a decision slightly better than by chance (0.5probability). The Gentle AdaBoost algorithm described in (Friedman et al., 1998) combines multiple Haar-like features together to form a strong classifier.
The Gentle AdaBoost algorithm combines regression trees, with stump structure, the features are the input (x) and the probability
fm(x) =Pw(y= 1|x)−Pw(y=−1|x)
is the output. The output values of the classifier arey = −1 for the negative training samples andy = +1for the positive training samples.
The training algorithm is the following, whereNis the number of samples,M is the number of weak classifiers,xis the input vector,yis the classification output.
1. Initialize the weightswi = 1/N,i= 1,2, . . . , Nand the classifierF(x) = 0
2. form= 1,2, . . . , Mdo:
(a) Fit the regression function decision treefm(x)by weighted least-squares ofyitoxiwith weightswi.
Weak classifiers are added until the classifier reaches the de-sired detection and false positive rate.
3. The output classifier issign[F(x)]where
F(x) = M
X
m=1 fm(x).
Cascade For the rapid runtime speed the detector has a cascade structure. The detection is divided into stages of classifiers. Each stage rejects the object or passes it to the next stage. The im-age window which passes the last stim-age is classified as object at the end. The image regions easy to classify, e.g. homogeneous water, are rejected by the early stages, while the difficult image windows, e.g. waves, are classified as non-vessel by the later stages.
The false positive rate of the final cascade is
F= K
Y
i=1
fi (1)
whereKis the number of stages,fiis the false positive rate of the classifier of theith stage. The detection rate is
D= K
Y
i=1
wheredi is the detection rate of the classifier of theith stage. Thus a20stage classifier withdi =d = 0.995andfi =f = 0.5provides a theoretical detection rate ofD ≈0.9and a false positive rate ofF≈5×10⁻⁷.
2.2 Training
The detector was trained on WorldView-1 and WorldView-2 im-ages with 50 cm resolution. The figure 4 shows positive samples, the figure 5 shows regions from which negative samples are cho-sen. The vessel samples, manually labeled on the satellite images, are cropped, rotated to x-axis direction and resized to12×24 pix-els.
The detector was trained with800positive samples. For each stage negative samples were chosen randomly, from manually la-beled regions not containing vessels, and evaluated by the earlier stages until800false positives were found, these samples were used as negative samples. The final cascade has 20 stages, each with a detection ratedi= 0.995and false positive ratefi= 0.5.
Figure 4: Positive training samples
Figure 5: Regions for negative training samples
2.3 Detection
Watermask To avoid the processing of land surfaces the SRTM watermask is rasterized into the georeferenced satellite image as a binary mask. The larger land areas are skipped during the sliding window classification, while the remaining detections over land areas are rejected in the grouping step.
Sliding window The classifier is direction variant, but the ves-sels can lie in arbitrary directions in the image. Thus the detection has to be performed for multiple directions. I have considered two possibilities, rotating the image or rotating the classifier.
Rotating the Haar-like features of the detector can lead to errors as it was investigated in (Barczak et al., 2006). The features of the vessel classifier have a small size (i.e.2−24pixels). On this
scale the rasterization of the pixels is not negligible thus the Haar-like feature values can change by rotation. The fast calculation of Haar-like features with integral images is only possible in specific directions, i.e. the axis aligned directions for the basic Haar-like features like in (Viola and Jones, 2004) or the45◦direction like
in (Lienhart and Maydt, 2002).
Because of these difficulties, I rotate the image instead of the de-tector. I rotate the original input image and the same detector is executed on the rotated image. The detections on the rotated image are calculated back for the original image. I detect in 16 directions, from0◦ to337.5◦ with22.5◦ steps. The detection
in different directions is performed parallel on a multi-core pro-cessor. This task is well suited for parallel processing since the rotated images are independent from each other. The detector has to work also on large images (e.g. 16000×16000pixels). For these images the integral images need a large amount of memory. For one grayscale image 4 integral images are calculated. Two integral images are needed for the basic Haar-like features, one with the original value and one with the square value of the pix-els. The square valued integral images is used for calculating the variance of the sliding window. Similarly, two integral images are needed for the tilted Haar-like features. Since the integral images contain larger pixel values, they require finer quantization (i.e 32 or 64 bit), so one integral image can have4to8times the size of the 8 bit input image. The detection is a memory access intensive process, where the memory bandwidth can lead to bottleneck. To reduce the memory need, the rotated image is tiled with overlaps, so only a smaller tile of the integral images have to be stored in the memory. The overlaps are needed to ensure that one object is always completely present at least one of the tiles. The tiling can speed up the detection on images which contain land surface beside the sea surface by rejecting the tiles not containing water surface.
Detection grouping One vessel might be detected multiple times in different directions since the detections in the various direc-tions are independent. The most common case is, that one vessel is detected both in the correct direction and in the opposite (i.e. 180◦ rotated). To detections are grouped together by dividing
them into equivalency classes. First the criteria for belonging to the same equivalency class is the difference in position and size. The equivalency classes with only one member are rejected. As a next step the objects in the equivalency classes are grouped to-gether with the same algorithm, but based on the difference be-tween the heading angles. For the group with the most members, the heading, position and size mean is calculated in the next step, thesize measurement.
Size measurement The output of the detector is a rectangle containing also the environment around the vessel. For an ac-curate size and heading measurement the contour of the vessel is extracted. The detected image window is thresholded by using Otsus method (Sezgin and Sankur, 2004). This finds an opti-mal threshold separating the image into two classes with miniopti-mal intra-class variance (the weighted sum of variances of the two classesσ2ω(t)).
σω2(t) =ω1(t)σ 2
1(t) +ω2(t)σ22(t),
2.4 Results
The method was trained and tested on 10 satellite images taken by the satellites WorldView 1, WorldView 2 each covering an area of approximately50km2with a ground sampling distance of 50 cm. 9 image were taken over the coastal areas of the Mediter-ranean sea and one near Sidney, Australia. I show the qualita-tive results, quantitaqualita-tive analysis is planed to be studied in the fu-ture. The described detection method can detect the vessels with a good quality if the watermask is accurate and the water doesn’t contain large waves (comparable to the size of the vessels). The figure 6 and 7 shows detection results. The watermask is shown with a blue layer, the output of the sliding window classifier are the red rectangles while the measured sizes are the yellow, the dark green rectangles are the detections before grouping. The detections not located on the water surface were rejected.
Typical scenes where the detection produces false positives are presented on the figure 8. One case is where due to inaccuracy of the watermask the shore is included in the water surface. Other typical false positive sources are the large waves and wakes of speed boats.
The detection time varies by the context of the image, for images with large homogeneous regions it is faster. It is within in 2-4 minutes on an 8 core Intel Xeon E5-2680 processor with 64 GB memory.
Input image
Detections
Figure 6: Results for WV2 image near Sidney, Australia
Direct comparison with other methods is difficult since the input data is different with different ground sampling distances and the targeted vessels have different sizes.
Input image
Detections
Figure 7: Results for WV2 image at Nizza, France
3 CONCLUSIONS
I have presented a novel fast method for detecting small vessels on very high resolution satellite images by applying modern com-puter vision object detection techniques. The detector concen-trates on vessels shorter as 20 m. These vessels have a special interest for the authorities, since they are mostly not equipped with the AIS and they can hardly be detected by SAR vessel de-tection methods. The dede-tection method can deliver good results for vessels above8meter of length. Below this size classifying an image window is very difficult, also for a human interpreter, e.g. a wave can have very similar shape as a small vessel. The detector runs fast (in minutes for16873×14684pixels image) on a modern multi-core computer, thus enabling near real time application, i.e. one hour from image acquisition to end user.
Planed future work included creating a more detailed performance analysis of the detector and extending the detection for large ves-sels with vessel type classification. The detector could be accel-erated by using a rotation invariant classifier. Investigating new methods which consider also the context around the vessel could enable the reliable detection also in cases where the sliding win-dow classification fails.
ACKNOWLEDGEMENTS
The author thanks to the European Space Imaging (EUSI) for providing the satellite images.
REFERENCES
Barczak, A. L. C., Johnson, M. J. and Messom, C. H., 2006. Real-time computation of haar-like features at generic angles for detection algorithms. RESEARCH LETTERS IN THE INFOR-MATION AND MATHEMATICAL SCIENCES 9, pp. 98–111.
Corbane, C., Najman, L., Pecoul, E., Demagistri, L. and Petit, M., 2010. A complete processing chain for ship detection using optical satellite imagery. Int. J. Remote Sens. 31(22), pp. 5837– 5854.
Friedman, J., Hastie, T. and Tibshirani, R., 1998. Additive logis-tic regression: a statislogis-tical view of boosting. Annals of Statislogis-tics 28, pp. 2000.
Greidanus, H., Clayton, P., Indregard, M., Staples, G., Suzuki, N., Vachoir, P., Wackerman, C., Tennvassas, T., Mallorqui, J., Kourti, N., Ringrose, R. and Melief, H., 2004. Benchmarking operational sar ship detection. In: Geoscience and Remote Sensing Sympo-sium, 2004. IGARSS ’04. Proceedings. 2004 IEEE International, Vol. 6, pp. 4215 –4218 vol.6.
Lienhart, R. and Maydt, J., 2002. An extended set of haar-like features for rapid object detection. In: Image Processing. 2002. Proceedings. 2002 International Conference on, Vol. 1, pp. I– 900–I–903 vol.1.
Sezgin, M. and Sankur, B., 2004. Survey over image thresholding techniques and quantitative performance evaluation. Journal of Electronic Imaging 13(1), pp. 146–168.
Suzuki, S. and Abe, K., 1985. Topological structural analysis of digitized binary images by border following. Computer Vision, Graphics, and Image Processing 30(1), pp. 32–46.
Viola, P. and Jones, M., 2004. Robust real-time face detection. International Journal of Computer Vision 57, pp. 137–154.
Zhu, C., Zhou, H., Wang, R. and Guo, J., 2010. A novel hier-archical method of ship detection from spaceborne optical image based on shape and texture features. Geoscience and Remote Sensing, IEEE Transactions on 48(9), pp. 3446 –3456.
Zhu, Q., Zhu, Q., Avidan, S., Avidan, S., chen Yeh, M., chen Yeh, M., ting Cheng, K. and ting Cheng, K., 2006. Fast human detection using a cascade of histograms of oriented gradients. In: In CVPR06, pp. 1491–1498.
Shore False detection on the shore
Speed boat with wake Detections on speed boat wake