ACCURACY ASSESSMENT OF A CANAL-TUNNEL 3D MODEL BY COMPARING
PHOTOGRAMMETRY AND LASERSCANNING RECORDING TECHNIQUES
P. Charbonniera, P. Chavanta,b, P. Fouchera, V. Muzeta, D. Prybylaa, T. Perrina, P. Grussenmeyerb, S. Guilleminb
a
CETE de l’Est, LRPC de Strasbourg, 11 rue Jean Mentelin, 67035 Strasbourg, France
{Pierre.Charbonnier, Philippe.Foucher, Valerie.Muzet, Davy.Prybyla, Thibaut.Perrin}@developpement-durable.gouv.fr
b
ICube Laboratory UMR 7357, Photogrammetry and Geomatics Group, INSA de Strasbourg, 24 Bd de la Victoire, 67084 Strasbourg, France
{paul.chavant, pierre.grussenmeyer,samuel.guillemin,}@insa-strasbourg.fr
KEY WORDS:Photogrammetry, Cultural Heritage, Laser Scanning, Point Cloud, Model, Recording, Accuracy, Comparison
ABSTRACT:
With recent developments in the field of technology and computer science, conventional methods are being supplanted by laser scanning and digital photogrammetry. These two different surveying techniques generate 3-D models of real world objects or structures. In this paper, we consider the application of terrestrial Laser scanning (TLS) and photogrammetry to the surveying of canal tunnels. The inspection of such structures requires time, safe access, specific processing and professional operators. Therefore, a French partnership proposes to develop a dedicated equipment based on image processing for visual inspection of canal tunnels. A 3D model of the vault and side walls of the tunnel is constructed from images recorded onboard a boat moving inside the tunnel. To assess the accuracy of this photogrammetric model (PM), a reference model is build using static TLS. We here address the problem comparing the resulting point clouds. Difficulties arise because of the highly differentiated acquisition processes, which result in very different point densities. We propose a new tool, designed to compare differences between pairs of point cloud or surfaces (triangulated meshes). Moreover, dealing with huge datasets requires the implementation of appropriate structures and algorithms. Several techniques are presented : point-to-point, cloud-to-cloud and cloud-to-mesh. In addition farthest point resampling, octree structure and Hausdorff distance are adopted and described. Experimental results are shown for a 475 m long canal tunnel located in France.
1 INTRODUCTION
In France, 31 tunnels were built during the 19th and 20th century, totalling 42 km of underground waterway. Inspecting canal tun-nels is not only a matter of heritage preservation, but also a safety issue. However, on-site visual inspections are time-consuming and may interfere with navigation traffic. In this context, a French consortium, composed of Voies Navigables de France (the French operator of waterways), the Centre d’Etudes des Tunnels (CETU) and the CETE de l’Est, in collaboration with the Photogramme-try and Geomatics Group (INSA), proposes to develop a visual inspection system, based on image recording, for helping the op-erator’s task. In this way, a prototype has been developed to dy-namically record images of the vault and side walls of the canal tunnel and a 3D photogrammetric model of the tunnel was built.
The main objective of this paper is to assess the accuracy of the photogrammetric model by taking as reference a static terrestrial laser scanning (TLS) model. A technique to evaluate accuracy is to compute a distance between a dataset and a 3D reference point cloud. However, calculating such a distance may be problematic. In particular, the two distinct acquisition processes lead to differ-ent number of points in both models. Moreover, the point density within the two clouds is non-uniform. Note that laser scanning stations are located on a bench, near a side wall, which implies an heterogeneous density of the cloud between both sides of the tunnel. Finally, the tunnel is quite long and the mass of recorded data may be very huge. Therefore specific computation structures will be required.
We are interested in three different algorithms that compute a dis-tance between the two models : point-to-point, cloud-to-mesh and cloud-to-cloud methods. Facing huge datasets, we propose to implement these algorithms using a specific octree structure, for
its capacity to quickly and accurately address points at a given lo-cation. Differences in sampling may be alleviated either by using meshing or by considering non-symmetric distances. The sec-ond contribution of the paper is that we evaluate the accuracy of the photogrammetric model. First, we need to check the relia-bility of the reference TLS model. Subsequently, we compare the photogrammetric model to the TLS model by using the three proposed accuracy measures.
The paper is organized as follows. We first propose an overview of related works (Sec. 2). We introduce the three approaches we propose for comparing huge datasets (Sec. 3). In Sec. 4, we present the experimental setup for data recording. In Sec. 5, we comment the experimental results. Finally, Sec. 6 is dedicated to conclusions and future work.
2 RELATED WORK
Photogrammetry and lasergrammetry have become relevant to in-spect tunnels. These new technologies have been introduced to measure displacements (Kimet al., 2007) or monitor deforma-tions on tunnel profiles (Han and Jiang, 2013). In (Peji´c, 2013), an optimized laserscanning solution is proposed for inspecting the geometry of railway tunnels.
an appropriated sampling (Eldaret al., 1997, Bronsteinet al., 2008) or specific computation structures such as an octree sub-division (Girardeau-Montautet al., 2005). An original method is proposed in (Lagueet al., 2013) for surveying canyon surface changes using TLS. In this approach, the distance between two point clouds (Laser clouds and dense tacheometric survey) is ob-tained by locally estimating the surface normals and computing the distance in the direction of the normals. A roughness mea-sure is considered for computing the surface normals and a local confidence range is calculated.
3 METHODOLOGY
We propose three tools to evaluate the accuracy of the photogram-metric model. In the first method, point-to-point distances are computed. The second approach computes Euclidean distances between photogrammetric points and lasergrametric meshes. In the third approach, the Hausdorff distance (dH) is used to com-pare two point clouds (S1andS2). In this section, we first recall the basis of Hausdorff distance and of the octree structure. the we introduce the three proposed approaches to measure an accuracy.
3.1 Hausdorff distance
The Hausdorff distancedH is a classical tool that measures the remoteness between two subsetsS1andS2of a metric space:
dH(S1, S2) =max[d(S1, S2), d(S2, S1)],
whered(S1, S2)andd(S2, S1)are symmetrically defined as:
d(S1, S2) =maxp1∈S1d(p1, S2),
d(S2, S1) =maxp2∈S2d(p2, S1),
and
d(p1, S2) =minp2∈S2 kp1−p2k, d(p2, S1) =minp1∈S1kp2−p1 k.
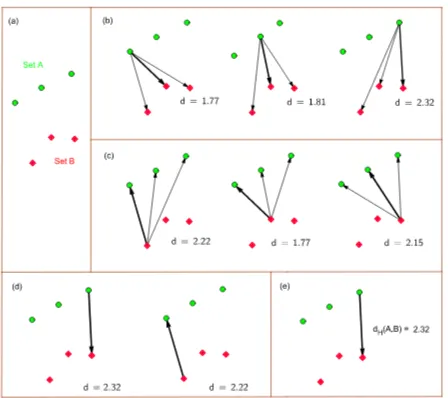
Note thatk.kdenotes the usual Euclidean norm. An illustration of the Hausdorff distance is given in Figure 1, following (Ariza-L´opezet al., 2011).
3.2 The octree structure
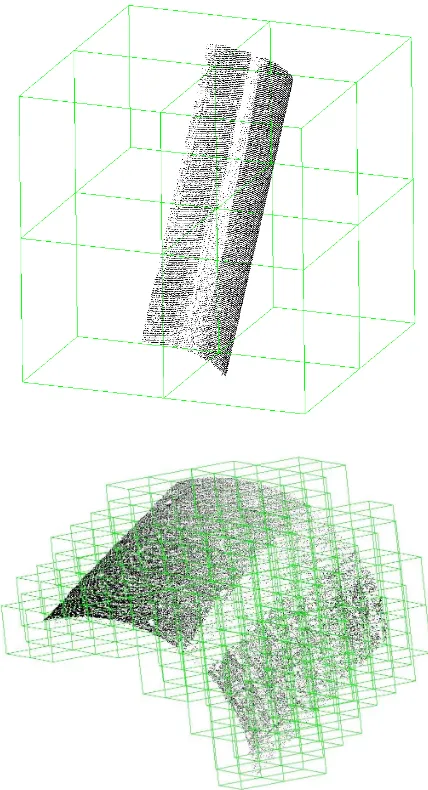
The octree is a three-dimensional data structure that recursively subdivides a point cloud within a cubic volume into eight con-gruent disjoint cubes (octants). An overview of the several types of octrees is given in (Samet, 1988). The subdivision continues until reaching the predetermined level of decomposition.
Given a 3-D point cloud in a metric space, our methodology will rely on: a starting point,P0, an ending point,PN, that respec-tively correspond to the closest and farthest point to the origin of the metric space, a subdivision level, and the distanced(PN) between the starting and ending points.d(PN)is defined as the maximum betweendx(PN),dy(PN)anddz(PN)which are the differences of coordinates betweenP0andPNalong the x-axis, y-axis and z-axis, respectively.
We will now consider a single subdivision level for simplicity. The subdivision algorithm proceeds as follows: initially, the orig-inal dataset is sorted by increasing x-axis coordinates and then two subsets are created with respect to a threshold value, which is defined as the sum of the abscissa of the starting point and
d(PN). The first subset will contain all points of the initial cloud
Figure 1: Hausdorff distance for two point setsA andB. (a) The point sets. (b) Computation of the Euclidean distance from each element of the set A to each point of B (values in white re-fer to the thicker arrow corresponding to the minimum distance). (c) Computation of the Euclidean distance from each element of the set B to each point of A (values in white refer to the thicker arrow corresponding to the minimum distance). (d) Maximum distances between sets. (e) Hausdorff distance between set A and B:dH(A, B) = 2.32.
with x-coordinate lower than the threshold value and the second one gathers all points with x-coordinates greater than the thresh-old. Then, the same work is repeated, taking these two subsets as initial data, by sorting them by increasing y-axis coordinates and thresholding, which yields four sets of points. Finally these four clouds are sorted again, by increasing z-axis coordinates and a new division takes place according to the already defined charac-teristics, and one obtains eight octants (see Figure 2 for example).
3.3 Proposed approaches
The proposed approaches aim at measuring the accuracy of a 3D model. In this way, we have implemented three algorithms for computing a distance between a set of points and a reference dataset.
Point-to-point algorithm The point-to-point approach aims at comparing two sets of points regularly distributed along the tun-nel. The distances are computed only between similar points and the maximum distance is considered. Note that the number of points in both sets must be the same.
Cloud-to-mesh algorithm In the cloud-to-mesh technic, Eu-clidean distances are computed between points in the photogram-metric model and meshes. The triangular meshes are computed from the lasergrammetric point cloud by Delaunay triangulation. As a consequence, accuracy corresponds to the quadratic mean of all Euclidean distances. It may be noticed that this method presents the risk of being time consuming.
Cloud-to-cloud algorithm In the cloud-to-cloud method, all points of each model (photogrammetric and lasergrammetric) are compared. As we study very large clouds, the computation time between two sets of points may be very high. Thus, we use a specific octree structure (described in Section 3.2). This structure
Figure 2: One-level subdivision octree (top) and four-level sub-division (bottom) representation of a portion of the tunnel canal’s vault.
is very convenient because it gives the capacity to quickly and accurately address points in a specific cube.
An attractive idea is to compute the Hausdorff distance (detailed in Sec. 3.1) between the octree cells. The accuracy is obtained by calculating the quadratic mean of all the Hausdorff distances. However, the Hausdorff distance is sensitive to the difference of point densities between the two clouds. Moreover, in such a way, the accuracy is estimated using few distances (corresponding to the number of octants) at risk of not being representative of real accuracy.
The alternative method we have developed consists in modeling surfaces using meshing of lasergrammetric cells and then, in in-troducing locally Euclidean distances between photogrammetric points and laser meshes. It may be specified that a filter is ap-plied to the Euclidean distances in two ways: (1) A minimum of 3 points in a cell is necessary to compute the Euclidean dis-tances. Otherwise the Hausdorff distances is measured between cells ; (2) the Euclidean distances greater thandHare replaced by Hausdorff distances in order to avoid irregularities introduced by triangular meshes. Figure 3 illustrates this algorithm. Accuracy is obtained by calculating the quadratic mean of all the distances.
Figure 3: Homologous octree cell representation. Euclidean dis-tances are computed between points of the two clouds (top). Hausdorff distance (bottom) is also computed for filtering the Eu-clidean distances if required
Figure 4: Encoded target for the photogrammetric model (top-left) ; black and white target (bottom-(top-left) ; sphere (right). En-coded targets and spheres are located on the right side wall and black and white targets are fixed on the left side wall.
4 DATA RECORDING
The experimental canal tunnel is located in Niderviller (Lorraine region, France). It is straight, 475 m long and lined with stonework. To assess the feasibility of non-intrusive acquisition systems, ex-perimental campaigns have been carried out in the tunnel for recording data, both in a dynamic manner for images acquisi-tion and in a static manner for terrestrial laser acquisiacquisi-tion. Note that, in parallel to images acquisition, others sensors (tacheome-ters and inertial unit) have been used to determine the trajectory of the barge in the tunnel, see (Albertet al., 2013). Beforehand, the tunnel has been equipped with 8 spheres, 25 encoded targets and 16 black and white targets (see fig. 4). Moreover, mobile targets were positioned on the ledge of the tunnel during acqui-sitions. This set of reference points essentially located on the side walls of the tunnel, has been accurately georeferenced using tacheometers. They will be used as control points for georefer-encing the photogrammetric and lasergrammetric models.
4.1 LASERSCANNING
The static laser acquisition has been performed using a 3D Ter-restrial Laser Scanner (a LEICA C10 device) with a station every 30 meters along the ledge of the tunnel. The scanning approach is based on a time-of-flight technology. The field-of-view is360◦
by270◦
and the scanning resolution is1point every5mm at a distance of 12 m. A scan records 90 millions of points at ev-ery station and lasts 40 minutes (see Fig. 5). We adopt, at least, a 30% overlap between two adjacent scans in order to facilitate scan strips registration (Bornazet al., 2003). 15 stations are nec-essary to collect the laser data of the entire tunnel (1.5 billion points).
Data post-processing consists in building a global terrestrial ref-erence model of the tunnel from different point clouds. In this work, we have chosen a two-step approach. In a first phase, ad-jacent point clouds are registered using black and white targets, which are visible in two consecutive scans. Secondly, the result-ing registered cloud is georeferenced usresult-ing control points defined by mobile targets. A cleaning-up of the final cloud is necessary to eliminate aberrant points. An exemple point cloud is rendered in Fig 6.
We obtain an extremely dense and non-uniform point cloud, which needs to be resampled. We apply the farthest point sampling strat-egy (FPS) that locally adapts the sample density according to ini-tial data. We refer the reader to (Eldaret al., 1997, Bronsteinet al., 2008) for further details on theFPSalgorithm.
Figure 6: Rendering of the lasergrammetric model at the tunnel exit. No resampling has been applied in this view.
Figure 7: Modular imaging prototype onboard a barge in the ex-perimental tunnel.
Side-looking cameras
Stereo rig
Figure 8: Camera configuration used for modeling the tunnel by photogrammetry.
4.2 PHOTOGRAMMETRIC MODEL
Image sequences of the vaults and side walls were dynamically acquired by two pairs of color cameras mounted on a modular structure, onboard a barge. An artificial lighting system has been integrated on the structure to obtain sufficiently illuminated im-ages (see Fig 7). The imim-ages recording prototype is detailed in (Albertet al., 2013), in the same Archive.
A sequence is defined as the set of all successive image acquisi-tions of vaults and side walls along the tunnel. Note that, at every time, only views of the right cameras are used to build the model. There is a small overlap between images of the two systems and an overlap of 75% between two successive images of the same camera, as shown in figure 8.
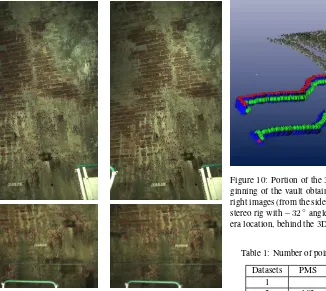
The reconstruction of a photogrammetric model of the tunnel is based on the bundle adjustment algorithm. This approach aims at computing an optimal model of a scene from multiple views, by minimizing a quadratic error between actual positions of points in an image and predicted positions obtained by back-projection. Note that this classical technique is a non-linear optimization problem that jointly minimizes the errors in all views (Szeliski, 2010). The algorithm is applied to a set of corresponding points that can be identified in several images. These points are called smartpoints. An example of smartpoints in different views is shown on Fig 9. A second step of the reconstruction consists in scaling the model by using control points, such as encoded
Figure 9: Successive views of the vaults (top) and side wall (bot-tom) at timet(left) andt+ 1(right). Smartpoints that have been automatically detected for bundle adjustment are superimposed upon the images (in red).
targets or visual marks, that have been previously georeferenced. These control points are also employed to enforce the model to be straight, to match the actual geometry of the tunnel: without these points, the model tends to be curved, due to local error accumula-tions. The photogrammetric 3D model of the tunnel was created with the commercial software PhotoModelerScanner (PMS). Ac-tually, as we work on large datasets (500 images by camera), nine sub-models had to be calculated and gathered to obtain a suffi-ciently dense photogrammetric point cloud of the right side wall and half vault of the entire tunnel.
5 RESULTS AND DISCUSSION
The accuracy assessment has been performed on five datasets. The number of points for each dataset is given in Tab. 1. The first two datasets have been built to evaluate accuracy using the point-to-point approach. Dataset1is employed to check the accuracy of the TLS point cloud by comparing it to georeferenced points. The six points corresponds to the Leica Geosystems spherical targets, surveyed both by TLS and tacheometry, and regularly spaced along the tunnel. The results give a maximum difference equal to1.7cm that ensures the reliability and the good dispersion of the lasergrammetric model. Therefore, the TLS model can be considered as a reference.
Dataset2is created by taking 2 points on each of 51 metallic angle brackets scattered all along the tunnel. The comparison refers to the photogrammetric and TLS model. We determine an accuracy as the maximum distance between the two models. The obtained value is4cm, which seems very promising.
The last three datasets have been constituted to evaluate accuracy
Figure 10: Portion of the 3D model of the side wall and the be-ginning of the vault obtained with PMS using the sequences of right images (from the side-looking stereo rig and the top-looking stereo rig with−32◦
angle). The poses are shown for each cam-era location, behind the 3D sparse, textured model.
Table 1: Number of points in both models for each dataset.
Datasets PMS TLS Length
1 6 scattered in tunnel
2 102 102 scattered in tunnel
3 12507 68429 18 m
4 63295 76578 107m
5 226679 201838 whole tunnel
between pairs of point clouds with large and different sizes, using cloud-to-mesh or cloud-to-cloud method. Datasets3and4are two successive portions of the tunnel starting from its entrance. Note that in dataset5, the lasergrammetric point cloud has been resampled as explained in Sect. 4.1. This last dataset, describing the whole 475 meters of the tunnel, presents high disparities in cloud density. It may be noticed that these three datasets corre-spond to the rightmost half-vault of the tunnel as the photogram-metric model has only been implemented on this part.
The results of the cloud-to-mesh approach are shown in Tab. 2. The 3 accuracies, comprised in the range[4.1cm, 5.8cm], are homogenous and analogous to the accuracy observed for dataset 2. However, it may be observed that dataset5gives an accuracy which is fairly lower than for the two others. This difference can be explained by the resampling and the fact that the whole tunnel was considered.
In the cloud-to-cloud approach, two parameters have to be evalu-ated: the octree subdivision level and the accuracy measurement. In theory, the choice of the octree subdivision has no impact on the distance computation between clouds. Actually, we observe some accuracy variations according to the subdivision level, but the results are globally homogenous (see Tab. 3). Further
investi-Table 2: ”cloud-to-triangular mesh” Method: Accuracy compari-son between photogrammetric and TLS model
Datasets Computation time Accuracy
3 ≤1mn 5.7 cm
4 3.7 mn 5.8 cm
Table 3: ”cloud-to-cloud” method. Accuracy comparison be-tween photogrammetric and TLS model vs. number of octree levels, using dataset3.
Octree level Computation time Accuracy
3 56.47 s 5.5 cm
5 20,62 s 5.0 cm
7 3.37 s 4.1 cm
Table 4: ”cloud-to-cloud” method. Accuracy comparison be-tween photogrammetric and TLS model for the three datasets. Seven octree levels are used in this experiment.
Datasets Computation time Accuracy
3 3.37 s 4.1 cm
4 22.32 s 5.6 cm
5 8.6 mn 4.2 cm
gations should be necessary to explain these differences. For the moment, we have chosen, a number of7octree levels, since it is the least time consuming.
The evaluation on the datasets3−5, taking the laser model as ref-erence, (Tab. 4) shows that the accuracy of the photogrammetric model spans the range 4.1 cm - 5.5 cm. We observe that the tun-nel can be quite accurately reconstructed with a photogrammetric model. It may be observed that, for equivalent results, the com-putation time using cloud-to-cloud method is lower than using cloud-to-mesh approach. For example, in the case of dataset5, the accuracy analysis lasts 24 minutes with cloud-to-mesh algo-rithm whereas it consumes 8.6 minutes with the octree structure (7 levels) in the cloud-to-cloud method. These results are promis-ing in terms of reliability of photogrammetry approach when im-ages have been dynamically acquired in a long canal-tunnel.
6 CONCLUSIONS AND FUTURE WORK
This paper has introduced several methods for point cloud com-parison in 3D in the case of canal tunnels. Given two datasets (assuming the clouds are expressed in the same reference frame) acquired either by photogrammetric or lasergrammetric devices, an accurate comparison relying on distance is possible. Speed constraints are tackled using a specific octree subdivision and an appropriate resampling of the point clouds. The first method (point-to-point comparison) allows us to check the quality and re-liability of the TLS model. Then, this model can be considered as reference and cloud-to-cloud or cloud-to-triangular mesh tech-niques can be applied to huge datasets. The results show that the accuracy of the photogrammetry model is around 5 cm compared to lasergrammetric model considered as the reference.
Algorithms have been designed to deal with TLS and PM data but any sources of point cloud data are possible. They were applied to Niderviller canal tunnel to assess potential changes in photogram-metric survey. Results show that PM model fulfills requirements for reconstructing the tunnel. The choice of appropriate octree structure has to be determined, for instance, by performing simu-lations. Other subdivision structures, such ask−dtrees should be also tested. We are now also working on automatic accuracy assessment for other camera configurations (e.g. panoramic con-figuration). In the near future, the result of this study will be the creation of a full photogrammetric acquisition device able to evolve in underground waterways.
ACKNOWLEDGEMENTS
The authors would like to thank Voies Navigables de France and the Centre d’Etudes des Tunnels for funding this project. Many thanks, also, to the students of INSA de Strasbourg who con-tributed to the project.
REFERENCES
Albert, J.-L., Charbonnier, P., Foucher, P., Muzet, V., Prybyla, D., Perrin, T., Grussenmeyer, P., Guillemin, S. and Koehl, M., 2013. Devising a visual inspection system for canal tunnels: Prelimi-nary studies. In: XXIV International CIPA Symposium, Stras-bourg, France.
Ariza-L´opez, F., Mozas-Calvache, A., Ure˜na-C´amara, M., Alba-Fern´andez, V., Garc´ıa-Balboa, J., Rodr´ıguez-Avi, J. and Ruiz-Lend´ınez, J., 2011. Influence of sample size on line-based posi-tional assessment methods for road data. ISPRS Journal of Pho-togrammetry and Remote Sensing 66(5), pp. 708–719.
Aspert, N., Santa-Cruz, D. and Ebrahimi, T., 2002. Mesh: Mea-suring errors between surfaces using the hausdorff distance. In: Proceedings ofIEEE International Conference on Multimedia and Exposition, Vol. 1, IEEE, Lausanne, Switzerland, pp. 705–708.
Bornaz, L., Lingua, A. and Rinaudo, F., 2003. Multiple scan reg-istration in lidar close range applications. Int. Arch. Photogram. Rem. Sens. Spatial Inform. Sci 34, pp. 72–77.
Bronstein, A. M., Bronstein, M. M. and Kimmel, R., 2008. Nu-merical geometry of non-rigid shapes. Springer, ISBN: 978-0-387-73300-5.
Cignoni, P., Rocchini, C. and Scopigno, R., 1998. Metro: mea-suring error on simplified surfaces. Computer Graphics Forum 17(2), pp. 167–174.
Eldar, Y., Lindenbaum, M., Porat, M., Member, S. and Zeevi, Y. Y., 1997. The farthest point strategy for progressive image sampling. IEEE Trans. on Image Processing pp. 1305–1315.
Girardeau-Montaut, D., Roux, M., Marc, R. and Thibault, G., 2005. Change detection on points cloud data acquired with a ground laser scanner. International Archives of Photogramme-try, Remote Sensing and Spatial Information Sciences 36(part 3), pp. 30–35.
Han, J.-Y. and Jiang, J. G. Y.-S., 2013. Monitoring tunnel profile by means of multi-epoch dispersed 3-d lidar point clouds. Tun-nelling and Underground Space Technology 33, pp. 186–192.
Kim, K.-Y., Kim, C.-Y., Lee, S.-D., Seo, Y. and Lee, C., 2007. Measurement of tunnel 3-d displacement using digital pho-togrammetry. J Korean Soc Eng Geol 17(4), pp. 567–576.
Lague, D., Brodu, N. and Leroux, J., 2013. Accurate 3D com-parison of complex topography with terrestrial laser scanner: ap-plication to the rangitikei canyon (nz). ISPRS Journal of Pho-togrammetry remote sensing 82, pp. 10–26.
M´emoli, F. and Sapiro, G., 2004. Comparing point clouds. In: Proceedings of the 2004 Eurographics/ACM SIGGRAPH sym-posium on Geometry processing, ACM, pp. 32–40.
Peji´c, M., 2013. Design and optimisation of laser scanning for tunnels geometry inspection. Tunnelling and Underground Space Technology 37, pp. 199–206.
Samet, H., 1988. An overview of quadtrees, octrees, and related hierarchical data structures. In: Theoretical Foundations of Com-puter Graphics and CAD, Springer, pp. 51–68.
Szeliski, R., 2010. Computer Vision: Algorithms and Applica-tions. 1st edn, Springer-Verlag New York, Inc., New York, NY, USA.