TOWARDS CHANGE DETECTION IN URBAN AREA BY SAR INTERFEROMETRY
AND RADARGRAMMETRY
C. Dubois a, *, A. Thiele a,b, S.Hinz a
a
Institute of Photogrammetry and Remote Sensing (IPF), Karlsruhe Institute of Technology (KIT), 76131 Karlsruhe, Germany- (clemence.dubois, antje.thiele, stefan.hinz)@kit.edu
b
Fraunhofer Institute of Optronics, System Technologies and Image Exploitation (IOSB), 76275 Ettlingen, Germany – [email protected]
KEY WORDS: Change detection, Urban area, InSAR, Radargrammetry
ABSTRACT:
Change detection in urban area is an active topic in remote sensing. However, well-dealt subject in optical remote sensing, this research topic is still at an early stage and needs deeper investigations and improvement in what concerns SAR and InSAR remote sensing. Due to their weather and daylight-independency, SAR sensors allow an all-time observation of the earth. This is determining in cases where rapid change detection is required after a natural – or technological – disaster. Due to the high resolution that can be achieved, the new generation of space-borne radar sensors opens up new perspectives for analysing buildings in urban areas. Moreover, due to their short revisiting cycle, they give rise to monitoring and change detection applications. In this paper, we present a concept for change detection in urban area at building level, relying only on SAR- and InSAR data. In this approach, interferometric and radargrammetric SAR data are merged in order to detect changes. Here, we present the overall workflow, the test area, the required data as well as first findings on the best-suited stereo-configurations for change detection.
* Corresponding author.
1. INTRODUCTION
1.1 Motivation
In case of natural or technological disaster, urban areas are often highly affected. The most critical damages occur on infrastructures like bridges or buildings, which even sometimes collapse, partially or totally. In order to coordinate an efficient emergency response in those areas, rapid damage assessment is mandatory.
In addition, for urban planning, a continuous mapping of demolition and reconstruction areas could facilitate building progress monitoring for the site manager.
For these applications, a rapid change detection approach is necessary. SAR sensors, especially when mounted on satellite platforms, are useful in this task due to their weather and daylight independency. Moreover, the current suite of space-borne SAR sensors like TerraSAR-X, TanDEM-X and COSMO-Skymed allow mapping large areas by achieving a high geometric resolution of about 1m. Thus, analysing urban areas at building level with space-borne sensors becomes feasible. For example, patterns can be detected in façades (Auer et al. 2012), which let foretell a good detection of small changes in the façades, like partially collapse walls. Furthermore, the short orbit cycle of these satellites as well as the possibility of multi-sensor constellation allow a fast revisit time of the same area. This offers new possibilities for change detection, especially based on radargrammetric approaches.
1.2 State-of-the-Art
The topic of change detection in urban area can be separated into two main strategies, depending on the considered area. The first considers a whole city and detect changes in the backscattering coefficient and intensity correlation between two lower resolved SAR images in order to detect city areas where changes occurred (Matsuoka et al. 2004). The second strategy
considers changes at district or even building level, detecting changes in the expected SAR building shape of high resolved SAR data. We will restrain the review of state-of-the-art approaches to this latter approach, in which we are more interested, for the reasons explained above.
Existing building change detection approaches usually fuse multi-sensor data or use SAR simulation in combination with real SAR images in order to assess the changes. Brunner et al. (2010) determines single building parameters in pre-event optical imagery before using them to simulate an expected SAR building signature. By evaluating the similarity between the predicted simulation and a real single-look post-event SAR image, changes are detected. However, this method does not consider building neighbourhood. Tao et al. (2012) proposes a similar method, yet using a LIDAR-derived DSM instead of optical data for determining the building parameters. This methods relies on LIDAR-DSM, information that is not available everywhere in the world, especially in regions more affected by such crisis. In (Guida et al. 2010), a double bounce analysis is performed between two SAR amplitude images taken under the same conditions for the pre- and post-event. Changes in the double reflections mask are then detected. However, this method needs for the post event analysis the same acquisition configuration as for the pre-event, which may take too long for post-event situations. In addition, debris from neighbouring buildings can occur that partially or totally hide the double reflection and thus this building detection analysis is no more possible. Balz et al. (2010) detects building damages by interpretation of a post-event SAR amplitude image only, making assumptions about the appearance of collapsed buildings under different incidence angles. However, this theoretical and visual contribution still needs to be set into practice.
In our approach, we want to rely only on InSAR and SAR images, fusing advantages of interferometric and radargrammetric methods. On the one hand, the TanDEM-X
mission will produce a global DEM until 2014, which will make accurate interferometric data available everywhere. On the other hand, using radargrammetry allows to obtain two images of the same scene, yet from different acquisition configuration. Depending on the chosen radargrammetric configuration, we can obtain multi-look information, which could complete the information obtained with the interferometric view. In the following, we will develop this idea in more detail. First, we explain in some more details the overall concept of our study (Section 2). Second, we give more information about our data basis and the test area (Section 3). In Section 4, we give a thorough theoretical analysis of different radargrammetric configurations and show first reflections on experimental stereo-analysis at building location. As conclusion, we give an outlook on the fusion of interferometric phase image and radargrammetry disparity map for change detection (Section 5).
2. PRESENTATION OF THE CONCEPT
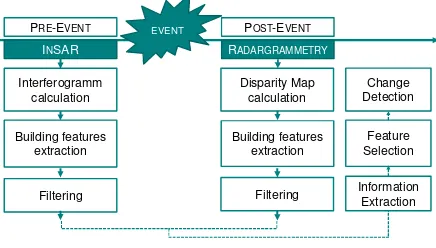
In the following, we present a new concept for change detection in urban areas at building level, based only on radar data analysis in order to assure an anytime use. Figure 1 presents the schematic overview of our concept.
Close before changes occur, i.e. for the pre-event analysis, interferometric data seem to be best suited. On the one hand, the TanDEM-X mission will provide until the end of 2014 stripmap single-pass interferogramm of all over the world that will make pre-event data available everywhere. When this mission has finished, the only possibility to obtain up-to-date interferometric data will probably be by repeat-pass interferometry. With the repeat-pass cycle of TanDEM-X being 11 days, this time span will be too long for post-event applications. In addition, due to the debris being removed, the loss of coherency between both acquisitions would make change detection nearly impossible.
After changes occurred, i.e. for the post-event analysis, radargrammetric methods seem to be an original and efficient way to obtain rapid and exhaustive information about changes, in particular when optical images of sufficient quality are not available. Methods using a single SAR-image for post-event analysis can only analyse the 2D information of the scene. For example, missing or shorter layover areas are indicator for changes. Although 3D information can be extracted by analysing the layover length, this method is very dependent of building neighbourhood and scene incidence angle. For
radargrammetric processing, two SAR images acquired from different incidence angles are considered. The 3D information is extracted by interpreting a disparity map, which is calculated similar to stereo-photogrammetric methods (see Section 4). Same-side as well as opposite-side radargrammetric configurations are possible with TerraSAR-X. Such opposite-side configurations enable to obtain information of both building sides (Liu et al. 2011), which is very helpful in case of neighbouring effects. TerraSAR-X achieves such stereo configuration within one day, which makes it suitable for post-event analysis.
For both interferometric phase and disparity map, we extract typical building features. Based on it, a filtering occur, which has already been presented in (Dubois et al. 2012) for interferometric phase data and still has to be adapted for the radargrammetric disparity map. Namely, both data statistics and extracted features are different. After filtering, valuable information (building heights and interesting features) are selected in both data sets and changes are determined. In the following, we will focus on the radargrammetric processing. A first overview of the interferometric processing is given in (Thiele et al. 2013).
3. DATA
3.1 Test area
Our test area is located close to Paris, in Clichy-sous-Bois and Montfermeil. There, an urbanisation project brings several building destructions about, which induces changes that can be detected. However, contrary to unexpected disasters, we approximately know when and where buildings are being
To be demolished
Already demolished
poss. 2014
B3 B7
B12 B11 C1
C3 C4 C5
C6 C2
b
a
c
Figure 2: Overview of the test area; a) IGN footprint data, red: BDTopo© (building footprint from different data sources : GPS, photogrammetry), green: BDParcellaire© (building footprint from digitalisation of cadastral map), yellow: building being demolished ; b) pansharpened WV2 view of the test area on June 2010 with building states on August 2012; c) pansharpened WV2
view of the test area on April 2013 with corresponding building states.
PRE-EVENT EVENT POST-EVENT
Interferogramm calculation
Disparity Map calculation
INSAR RADARGRAMMETRY
Building features extraction
Building features extraction
Filtering Filtering Information Extraction Feature Selection Change Detection
Figure 1: Scheme of the overall work concept
demolished. Thus, data acquisition for pre- and post-event is easier. Second, unlike many regions affected by disasters, valuable ground truth data exist. Those data are available at various points in time, corresponding to the different buildings states. For intact buildings, cadastral data are available, and many field campaigns allowed acquiring pictures of buildings destruction steps at the same period as the SAR acquisitions. Furthermore, we have two sets of optical satellite images from World-View 2 (WV2): one pre-event (acquisition date: 29.06.2010) and one post-event (acquisition date: 01.04.2013). Figure 2 shows the study area, some ground truth data and the building states at two distinct dates. Overall, 23 building are being demolished in this region (marked buildings in Figure 2b, 2c), but only 10 are interesting in the frame of this project. As we had to acquire interferometric data for the pre-event, only buildings being in demolition since August 2012 are further taken into account (yellow colored in Figure 2a).
Finally, the construction site presents new challenges in comparison to a city affected by disaster. Some additional elements are present on the data like construction machines, fences and cranes, which interfere with building signatures, as shown in Figure 3. Those objects are mostly in constant movement, which makes recognition difficult in different SAR data. For example, the crane arm moved between the acquisition time of Figure 3a and 3c. Furthermore, demolition and reconstruction are going on at the same time, so that many changes occur between two acquisitions. For radargrammetric processing, it is thus necessary to consider data that have been acquired within a short time span.
3.2 Acquired data
Table 1 gives an overview of the acquired pre- and post-event data for the test area. The orange underlines columns represent data acquired on descending pass. The other data were acquired on ascending pass.
For the pre-event data, we first wanted to explore the possibility of building reconstruction in single-pass spaceborne interferometric data with TanDEM-X in high resolution spotlight mode (1m) (red marked in Table 1). Approaches that already exist for InSAR building reconstruction are
implemented for airborne interferometric data (Thiele et al. 2007). Secondly, as single-pass spotlight interferometric data was not available with the specified quality or could not be acquired at all on the desired acquisition dates, we decided to use repeat-pass spaceborne spotlight interferometric data for the pre-event as well (green marked in Table 1). In total, we have six repeat-pass configurations, providing different baselines that we want to test in order to determine which one is the best suited for building recognition and reconstruction. This will be object of future work.
For the post-event data, we test different radargrammetric configurations, in order to determine the best suited for stereo-analysis of changes. Thus, we decided to combine the six available incidence angles. In order to obtain all possible
range range range
b
a c
d e
Figure 3: Examples of crane and fences in SAR images taken under different incidence angle
Table 1: Acquired data for pre- and post-event; green: for radargrammetry and repeat-pass interferometry; red: for
radargrammetry and single-pass interferometry
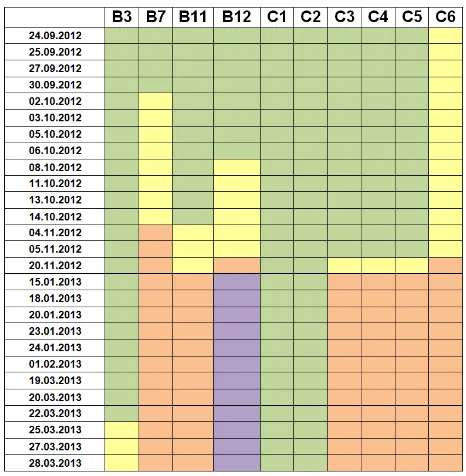
Table 2: Evolution of building demolitions; green: still standing; yellow: currently in demolition; orange: demolition
achieved; violet: new construction
range
02.10.12, 47° asc.
13.10.12, 47° asc. 16.10.12 11.10.12, 42° desc.
20.01.13, 47° asc. 31.01.13 15.01.13, 36° desc.
b
a c
d e f
g h i
Figure 4: Demolition states of building B12
configurations for each interesting building before and after the changes, and due to some delayed demolitions, we got at least three acquisitions for each incidence angle. Table 2 shows the demolition states of the interesting buildings for the corresponding dates and Figure 4 shows the different demolition states of building B12 on corresponding SAR data. We can distinctly distinguish the different states. Figure 4a, the building is still standing: we recognize the whole layover with the bright point scatterers. On Figures 4d and 4f, we observe only one part of the layover. There already lie debris on the southern part. Finally, Figures 4g and 4i show the end of demolition, when scattering debris already have been removed and only earth debris are still lying.
The selection of radargrammetric combinations is triggered by the acquisition dates and the data geometry. As a building destruction lasts approximately three weeks and the six acquisitions with different incidence angles are taken under nine days, it is possible that the building state changes between two acquisitions of the same cycle. Thus, we consider only pairs of images that are acquired within three consecutive workdays. Therefore, the possible changes stay minor. We also considered the different combinations of incidence and intersection angles (i.e., difference between two incidence angles), which led us to Table 3. Configurations for which the time span does not exceed three days (or would not, by repeating cycle), are marked in red in Table 3.
4. RADARGRAMMETRIC PROCESSING
4.1 Theoretical analysis
A thorough description of different radargrammetric configurations was already made by (Leberl et al. 1998) and (Toutin et al. 2000). For a detailed explanation of pros and cons of same-side and opposite side stereo, please refer to them. Here, we want to recall the main points and draw attention to specific problems we are faced with by using radargrammetry in urban area.
The main challenge of 3D reconstruction by stereo (be it by photogrammetry or by radargrammetry) is finding a compromise between good radiometry, i.e texture, and good geometry for parallax estimation. Same-side stereo uses broadly similar images that lead to similar radiometry, but the parallax stays small. Using large intersection angles increases the parallax but reduces the radiometric similarity. In addition, for same intersection angle, shallow incidence angles provide a smaller parallax than steep incidence angles. Thus, a compromise must always be made between high base-to-height ratio (large parallax) and similarity (good radiometry). Figure 5 shows SAR images taken under different incidence angles, illustrating the radiometrical and geometrical differences. For example, Figure 5b and 5c are more similar than Figure 5a and 5c.
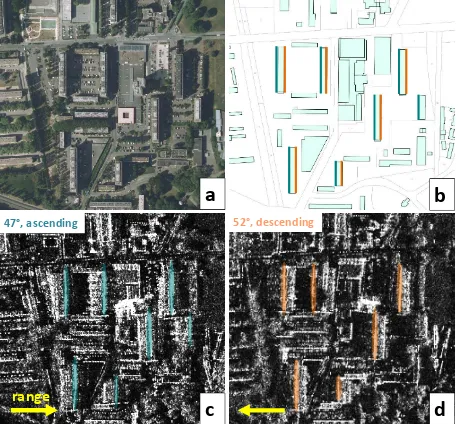
Similar reflections can be done for opposite side stereo. However, this configuration offers other challenges. First, the parallax is always larger than for same-side stereo, as the images are acquired from opposite object sides. The geometry for 3D calculation by spatial intersection is therefore ideal. In addition, no information about the objects is lost, as information of both object sides can be obtained. Indeed, disparity estimation with correlation methods between both images is more difficult, as the radiometry of both images is completely different (see for example Figure 5b and 5d). As shown in Figure 6, points that seem similar in SAR images do not correspond to the same points in the reality. Indeed, due to the façade layover, the left corner lines (green) are represented on the right for the ascending pass (6c) and right corner lines (orange) are represented on the left for the descending pass (6b). Moreover, the right corner lines (orange) are not visible in the ascending pass because they are in the building shadows and vice-versa. Eventually, we want here to draw attention on the effect of SAR epipolar geometry at building location. In order to perform a fast and efficient matching of both images, it is recommended to transform the images in epipolar geometry (Méric et al. 2009). Table 3: Possible radargrammetric configurations, ordered for
intersection angles upper and under 15°
52°, descending
42°, descending 29°, descending
47°, ascending range
b
a
c
d
Figure 5: SAR images of built area under different incidence angles
47°, ascending 52°, descending
range
b
a
c
d
Figure 6: SAR images of built area in opposite side configuration. The SAR images are geocoded in order to
facilitate the interpretation.
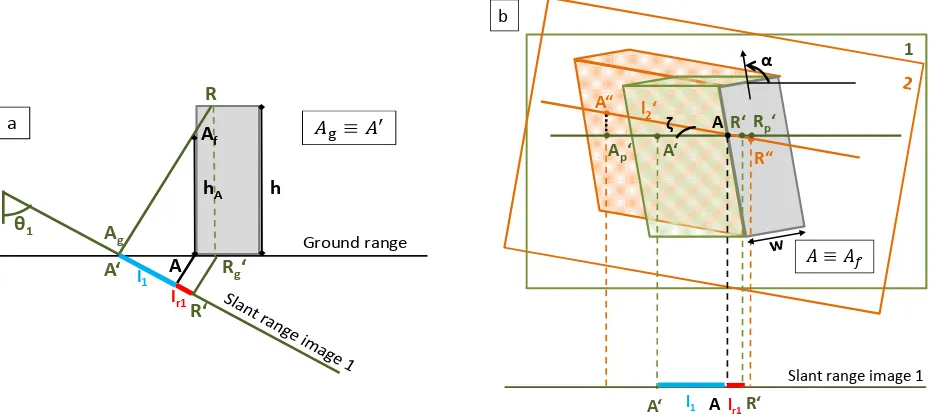
Thus, the search for matches can be restrained to a search along the range direction. The search window consequently shortens and matching errors are thus reduced. For SAR data, this transformation into epipolar geometry can be done by performing projective transformation from one image to the other, in slant range geometry. Basically, it is a matter of rotating and scaling one of the images with respect to the other. The rotation angle is defined by the difference of the heading respectively denoted by A’, A and R’ on the slant range image 1 (Figure 7b). Due to the different heading and incidence angle of the images 1 and 2, a scatterer Af represented on A’ in image 1 will be represented on A” in image 2 (Figure 7b). Those two points are not on the same range line after coregistration, and correspond to two distinct ground points. In the same way, the roof information contained in A’ and A” comes from two distinct roof points, represented by R’ and R”, respectively. In order to determine the influence of this alignment error for the matching, we estimated the distances dA”Ap’ and dR”Rp’, Ap’ and Rp’ being respectively the orthogonal projections of A” and R” on the range line passing through A in image 1. In image 1, the layover length l1 from A to A’ can be expressed as: which is well described in (Goel et al. 2012). Here, we just want to remind the main formula:
Now, the distances dA”Ap’ and dR”Rp’can be determined easily as
follow:
These values depend on the point scatterer’s height hA as well as on the building width w and orientation α. In future work, we will show the influence of this heading effect on the disparity map calculation. That will lead us to define the search window width that has to be taken into account for avoiding matching errors.
4.2 Experimental analysis
Among the several matching methods presented in the literature, one can distinguish between intensity- based (Leberl et al. 1994) and feature based (Simonetto et al. 2005; Soergel et al. 2009) approaches. Here, we tested an intensity-based matching method using maximal normalised cross correlation, often considered to be one of the most accurate matching method.
For this, we choose the radargrammetric configuration 42°-52°, which shows the best similarity.
After performing the images coregistration by GCP selection, we tested the correlation based matching for different template and window sizes. Results of this matching are presented Figure 9a., where the buildings are still recognizable although being quite noisy. The result is very dependent of the chosen window sizes. Further investigations will be made about it in order to learn appropriate window sizes depending on building height and geometric configuration.One solution for improving the results could also be the use of three images for stereo (Raggam et al. 2006; Simonetto et al. 2005), without forgetting the time span that must not exceed three days.
5. CONCLUSION AND OUTLOOK
In this paper, we presented first steps of a new and original approach for change detection in urban area by lonely use of InSAR and SAR data. We acquired several data in order to test Ag Ground range
Figure 7: Schematic representation of coregistration errors at building location
A
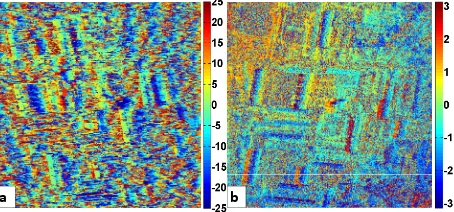
the best configurations for interferometry and for radargrammetry. For the radargrammetric processing, we explained thoroughly the effects of the heading angles on coregistration. Our future work will focus on improving the coregistration with automatic methods like SAR-SIFT (Dellinger et al. 2012) as well as providing a disparity map more reliable for feature extraction. Afterwards, change detection will be performed by comparing building features extracted from pre-event interferometric phase (Figure 8b) and post-event radargrammetric disparity map (Figure 8a). Another line of research is the use of opposite-side configurations for exploring building symmetries, i.e. buildings with similar facades on both sides, as it is the case in our test area. As only the building signature and not the surroundings interests us, we could calculate the disparity map at building location as for same-side stereo, by flipping and shifting one of the images. Let us have a look on Figure 4d and 4f again. By flipping 4f vertically and overlapping the corner lines with 4d, we could match the point scatterers together and calculate the disparity. We will further investigate this idea in future work.
ACKNOWLEDGMENT
The authors thank the IGN for providing reliable ground truth data and Mr. G. Cotreuil from PRU de Clichy/Montfermeil for providing us some helpful photos.
REFERENCES
Auer. S., Gisinger, C., Bamler, R., 2012. Characterization of SAR image patterns pertinent to individual façades. In:
Proceedings of IGARSS 2012, Munich, Germany, pp.
3611-3614.
Balz, T., Liao, M., 2010. Building-damageusing post-seismic high-resolution SAR satellite data. In: International Journal of Remote Sensing, 31:13, pp. 3369-3391.
Brunner, D., Lemoine, G., Bruzzone, L., 2010. Earthquake Damage Assessment of Buildings Using VHR Optical and SAR Imagery. In: IEEE Transactions on Geoscience and Remote Sensing, Vol. 48, No. 5, pp. 2403-2420.
Dellinger, F., Delon, J., Gousseau, Y., Michel, J., Tupin, F., 2012. SAR-SIFT : a SIFT-like algorithm for applications on SAR images. In: Proceedings of IGARSS 2012, Munich, Germany, pp. 3478-3481.
Dubois, C., Thiele, A., Hinz, S., 2012. Adaptive Filtering of Interferometric Phases at Building Location. In: Proceedings of
IGARSS 2012, Munich, Germany, pp. 6625-6628.
Goel, K., Adam, N., 2012. Three-Dimensional Positioning of Point Scatterers Based on Radargrammetry. In: IEEE
Transactions on Geoscience and Remote Sensing, Vol. 50, No.
6, pp. 2355-2363.
Guida, R., Iodice, A., Riccio, D., 2010. Monitoring of Collapsed Built-up Areas with High Resolution SAR Images. In: Proceedings of IGARSS 2010, Honolulu, Hawai, pp. 2422 – 2425.
Leberl, F., Maurice, K., Thomas, J.K., Millot, M. 1994. Automated radar image matching experiment. In: ISPRS
Journal of Photogrammetry and Remote Sensing, Vol. 49, No.
3, pp. 19-33.
Leberl, F.W., 1998. Radargrammetry. In: Manual of Remote Sensing, Vol. 2, Chap. 4, pp. 183-269.
Liu, L., Zhang, F., Wu, Q., Wang, G., 2011. Building footprint extraction by fusing dual-aspect SAR-images. In: Proceedings
of IGARSS 2011, Vancouver, Canada, pp. 1866-1869.
Matsuoka, M., Yamasaki, F., 2004. Use of Satellite SAR Intensity Imagery for Detecting Buildings Areas Damaged Due to Earthquakes. In: Earthquake Spectra, Vol. 20, No. 3, pp. 975-994.
Méric, S., Fayard, F., Pottier, E., 2009. Radargrammetric SAR image processing. In: Geoscience and Remote Sensing, Pei-Gee Peter Ho, InTech, pp. 421-454.
Raggam, H., 2006. Surface Mapping using Image Triplets: Case Studies and Benefit Assessment in comparison to stereo image processing. In: Photogrammetric Engeenering and Remote Sensing, Vol. 72, No. 5, pp.561-563.
Simonetto, E., Oriot, H., Garello, R., 2005. Rectangular Building Extraction from Stereoscopic Airborne Radar Images. In: IEEE Transactions on Geoscience and Remote Sensing, Vol. 43, No. 10, pp. 2386-2395.
Soergel, U., Michaelsen, E., Thiele, A., Cadario, E., Thoennessen, U., 2009. Stereo-analysis of high-resolution SAR images for building height estimation in cases of orthogonal aspect directions. In: ISPRS Journal of Photogrammetry and Remote Sensing, Elsevier, Vol. 64, No. 5, pp. 490-500.
Tao, J., Auer, S., Reinartz, P., 2012. Detecting changes between a DSM and a high resolution SAR image with the support of simulation based separation of urban scenes. In: Proceedings of
EUSAR 2012, Nuremberg, Germany, pp.95-98.
Thiele, A., Cadario, E., Schulz, K., Thoennessen, U., Soergel, U., 2007. Building Recognition from Multi-Aspect High Resolution InSAR Data in Urban Area. In: IEEE Transactions
on Geoscience and Remote Sensing, Vol. 45, No. 11, pp.
3583-3593
Thiele, A., Wurth, M.M., Even, M., Hinz, S. 2013. Extraction of Building Shape from TanDEM-X data. In: Proceedings of
ISPRS Hannover Workshop 2013, in press.
Toutin, T., Gray, L., 2000. State-of-the-art of elevation extraction from satellite SAR data. In: ISPRS Journal of Photogrammetry and Remote Sensing, Elsevier, Vol. 55, pp. 13-33.
b a
Figure 8: a) Disparity map (pix) for configuration 42°-52° (image_size= 781x781, template size: 1x15, search size:1x 65);
b) Single-pass Interferogramm (rad) 56°, orth. baseline= 199m