CROSSOVER ANALYSIS OF CHANG’E-1 LASER ALTIMETER DATA
Wenmin Hu, Zongyu Yue, Kaichang Di*
Institute of Remote Sensing Applications, Chinese Academy of Sciences
P. O. Box 9718, Datun Rd, Chaoyang District, Beijing 100101, P.R.China
(huwm, yuezy, kcdi)@irsa.ac.cn
Commission IV, WG IV/7
KEY WORDS: Planetary, Mapping, Chang’E-1, Laser Altimeter, Crossover, Analysis, Adjustment, DEM
ABSTRACT:
This paper presents a preliminary result of crossover analysis and adjustment of Chang’E-1(CE-1) Laser Altimeter (LAM) data of the Moon for global and regional mapping applications. During the operation of Chang’E-1 from November 28, 2007 to December 4, 2008, the laser altimeter acquired 1400 orbital profiles with about 9.12 million altimetric points. In our experiment, we derived more than 1.38 million crossovers from 1395 ground tracks covering the entire lunar surface after eliminating outliers of orbits and altimetric points. A method of least-squares crossover adjustment with a series of basis functions of time (trigonometric functions and polynomials) is developed to reconcile the LAM data by minimizing the crossover residuals globally. The normal equations are very large but sparse; therefore they are stored and solved using sparse matrix technique. In a test area (0°N~60°N, 50°W~0°W), the crossover residuals are reduced from 62.1m to 32.8m, and the quality of the DEM generated from the adjusted LAM data is improved accordingly. We will optimize the method for the global adjustment to generate a high precision consistent global DEM, which can be used as absolute control for lunar mapping with orbital images.
1. INTRODUCTION
Chang’E-1 (CE-1) is the first lunar exploration mission of China, and one of its main tasks is to obtain the 3D images of the lunar surface. The CE-1 satellite was successfully launched on October 24, 2007 from Xichang Satellite Launch Center, and was placed into a 2-h circular lunar polar orbit on November 7. The spacecraft operated until 1 March 2009, when it impacted the surface of the Moon at 08:13 UTC (Du, 2009). As one of the payloads of CE-1 satellite, the Laser Altimeter (LAM) is used to measure the distance from the laser receiver to the lunar surface by using the laser beams. With the altimetry data, the Digital Elevation Model (DEM) of the lunar surface can be derived.
Altimetric crossovers are the intersection locations of two distinct ground tracks at separate times. Crossover differences (radial distances or heights) reflect the uncertainties in orbit determination (i.e., precision of spacecraft position and orientation) and the precision of laser ranging. Crossover analysis, which aims to adjust the crossover differences and force the planetary radii or height obtained at crossover locations to be consistent, is known as a powerful approach to improve orbit determination and derive more precise DEM. Crossover analysis has been widely used in satellite altimetry for earth observation, especially for the measurement of sea surface height. However, to the best of our knowledge, there is no crossover analysis and corresponding ground track correction for CE-1 LAM data so far.
In this paper, crossover analysis of CE-1 LAM data is carried out for global and regional mapping applications. We first
calculate the crossover and crossover difference on each profile, followed by using a series of basis functions of time (trigonometric functions and polynomials) to minimize the crossover residuals globally. Finally, the numerical results and DEM effects are discussed.
2. CROSSOVER DIFFERENCES
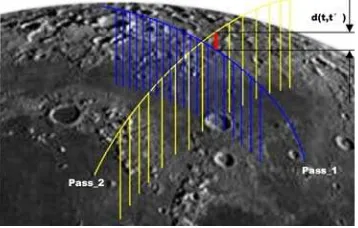
Figure 1 shows an altimetric crossover and crossover difference at the intersection location of two distinct ground tracks at t and t′. At a crossover, the height of the same location is given twice, generally by the observations of an ascending track and a descending track. The crossover difference is the deviation between the two altimeter ranges at the crossover point. The two crossing passes provide independent measurements at the same location while at different times.
Owing to the rotation of the Moon, crossovers occur at all latitudes. Since CE-1 probe had a polar circular orbit with a dip angle of 88.2° (Li et al., 2010), the track of sub-stellar points is basically parallel with the longitude at low latitudes. Therefore, the crossovers are denser at high latitudes than that of middle and low latitudes.
3. DATA
The laser altimeter of CE-1 fires one narrow pulse of 1064nm wavelength light per second to the Moon surface. A ground track consists of ~200m-diameter footprints, spaced about 1.4km apart along track.The distance measuring scope is about 200±25 km and the ranging accuracy is about 5m in aircraft tests (Ping et al., 2009).
During the operation of CE-1 from November 28, 2007 to December 4, 2008, the laser altimeter acquired 1400 orbital profiles with about 9.12 million altimetric points. In this study, more than 1.38 million crossovers are calculated from 1395 ground tracks covering the entire lunar surface after eliminating outliers of orbits and points. Figure 2 shows the global distribution of CE-1 crossovers in longitude and latitude. The density of crossovers is the greatest at the two poles.
Figure 2. Global distribution of CE-1 LAM crossovers
2180 2181 2182 2183 2184 2185 2186 2187 2188 2189 2190 2191 -800
Figure 3. Crossover difference versus time over one earth day
Figure 3 shows crossover differences as a function of time for an earth day (May 17, 2008). The figure indicates that the crossover differences can be treated as a quasiperiodic signal, occurring once per revolution.
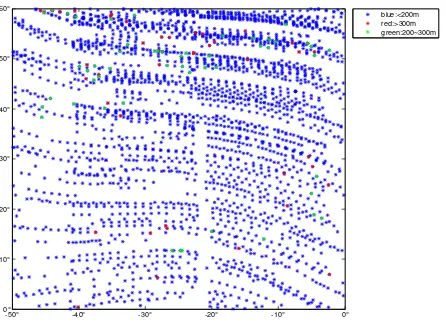
The crossovers in a local area (0°N~60°N, 50°W~0°W) are extracted for detailed analysis. Figure 4 displays the 2593 crossover locations in this area, with different colors representing different ranges of crossover differences (blue: <200m; red: >300m; green: 200~300m).
-50° -40° -30° -20° -10° 0°
Figure 4. Distribution of crossovers in a local area (0°N~60°N, 50°W~0°W)
4. METHOD
4.1 The procedure of crossover processing
The procedure of crossover processing is as follows:
Step 1: Pre-processing of LAM points, including reading the LAM points from .pds file and eliminating outliers in the data.
Step 2: Calculation of crossovers and crossover differences. Because there are generally no direct observations at crossovers’ locations, these two altimetry ranges along their respective ground tracks are interpolated by fitting a quasihermite spline (Akima, 1970) with the three nearest points on each side of the crossover point. Calculate the crossover differences and store the time information on the two crossing passes at the crossover. The calculated differences are also called crossover residuals in the subsequent adjustment.
Step 3: Adjustment of crossover residuals with a method to be described in Section 4.2.
Step 4: Adjustment of the original LAM points based on the result of Step 3.
4.2 Least squares adjustment of crossover differences
We adopt the adjustment method proposed in Neumann et al. (2001) with some modifications in adjustment model.
( , ')
( )
( ')
d t t
=
h t
−
h t
(1)where t and t′ are time tags of the two crossing trajectories. To minimize the discrepancy of the two height values, we assign each crossover two artificial adjustments, f t( ), ( ')f t in profile is modelled by a time-dependent polynomial:
0 1 coefficients, Equation (2) has 2(n+1)unknown coefficients to be solved at each crossover. Matrix
G
is composed of the crossing timet
. For all crossovers, this leads to a very sparse system of equations.Because each intersection between one track and crossing tracks can be used, and the number of intersections increases as the number of cyclic motion increases, there will be enough observations to solve Equation (2). On the other hand, since the values in matrix
G
are very similar, the adjustment solution of parameters Pcan be singular. We set the initial values of P to be zero and calculate the final P by iteration, using an inverse covariance matrixC
pp−1 to constrain the iteration so that to avoid singularity. The solution at the (k+1)th iteration is obtained from (Tarantola and Valette, 1982):1 1 1
1
(
) (
)
T T
k k pp pp k
p
+=
p
+
G G
+
C
− −G
Δ −
d
C p
− (4)The residual
Δ
d
is calculated from Equation (2) withp
kat thekth iteration. With the coefficients P, the altimetric observations for each profile can be adjusted with the same model. For each altimetric point, substitute the time-value
t
into Equation (3) to get the adjusted valuef t
( )
. That means( )
( )
o( )
h t
=
h t
+
f t
(5) whereh
= the corrected altimetric value,( )
oh t
= the original altimetric value.5. RESULTS
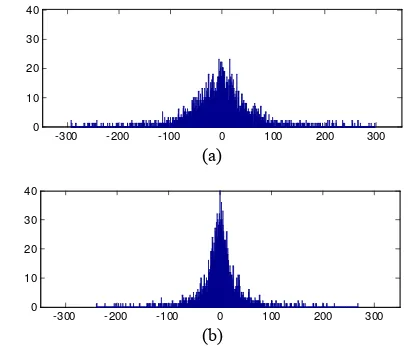
We test the above crossover adjustment method in a local area (0°N~60°N, 50°W~0°W). Without adjustment, the root-mean-square (RMS) of the original crossover residual is 62.1m, and it is reduced to 36.8m after adjustment with a 2-order polynomial for each profile. Figure 3 shows histograms of the crossover residuals before and after adjustment.
Table 1 lists the range distribution of crossover residuals before and after adjustment. From
Table 1, 98.7% crossover residuals are under 100m and most of them are under 30m after adjustment, while only about 50% under 30m before adjustment. Apparently, the adjustment significantly reduced the crossover residuals.
-300 -200 -100 0 100 200 300
Figure 3. Histograms of altimetric residuals at crossovers (a) before and (b) after adjustment
Crossover
Table 1. The range distribution of crossover residuals before and after adjustment
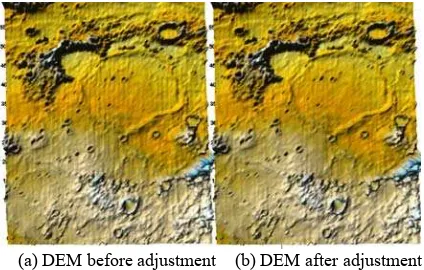
With the model parameters from the crossover adjustment, we estimate the altimetric errors for each valid LAM points. Then the adjusted LAM points (399,629 points) are used to produce a new DEM by interpolation.
(a) DEM before adjustment (b) DEM after adjustment Figure 4. DEMs before and after a 2-order polynomial
adju-stment of crossovers
Considering that trigonometric functions have also been used in crossover adjustment, we developed the following four adjustm-ent models for comparison purposes, among which the third models is the one used above.
Model_1:f t( )=p0+p1coswt+p2sinwt (6) Model_2:
2 4
( ) j ( ) an d ( ) 1 8 1 6
j
f t =
∑
p g t− j g t = − t + t (7)Model_3: 2
0 1 2
( )
f t =p +p t+p t (8) Model_4:
f t
( )
= + +
p
0p t p t
1 22+
p t
33 (9)models RMS Mean Median Min Max
original 62.11 2.35 1.68 -298.50 293.82 Model_1 36.30 0.37 -0.07 -242.04 270.13 Model_2 34.35 0.44 -0.23 -245.51 230.11 Model_3 36.83 0.14 -0.10 -240.27 268.92 Model_4 32.84 0.34 0.012 -229.01 259.10 Table 2. Crossover adjustment results from the four models. Table 2 lists the numerical adjustment results using the four models. From the statistics, all the adjustment models have reduced the crossover residuals. To see the effects of the adjustment on DEM more clearly, the DEMs in a smaller area (18°N~44°N, 33°W~19°W) are shown in Figure 7. It can be observed that all of the models reduced the artifacts to some extents, but generally 2-order and 3-order polynomials perform better.
(a) Before adjustment (b) model_1 (c) model_2 (d) model_3 (e) model_4
Figure 5. The DEMs before and after adjustment in a local area (18°N~44°N, 33°W~19°W)
When the crossover adjustment models are applied to all the LAM data globally, the effect is not as significant as above. Figure 8 shows the original DEM and the DEM after a global crossover adjustment using 2-order polynomial model. With the adjustment, the RMS of crossover residuals is slightly reduced from 117.5m to 109.6m, and the improvement for DEM is very limited. Therefore, further investigation is necessary for global crossover adjustment and generation of a high precision consistent global DEM.
(a) Before adjustment (b) After adjustment
Figure 6. The lunar nearside DEMs before and after crossover adjustment
6. DISCUSSION AND CONCLUTION
There are several factors which contribute to the crossover misfit. The first is the errors in the altimetric data itself, which is resulted from the motion of the Moon. Second, the uncertainties of the position and orientation of the spacecraft also contribute to the inconsistencies of the different profiles, especially because most of the LAM data were acquired without segmental arc observation of the orbit (Li et al., 2010). In addition, the space resolution of the LAM data is relatively low, and the uncertainties in calculation of crossover locations and height interpolation also contribute to the misfit. The distance between a LAM point and the adjacent one is about 1.4km along track and 17.8km across track at the equator. That means there is great uncertainty between the values of the true ground elevation and the interpolated, while the latter is used in the models of crossover adjustment.
As the result, the crossover adjustment in local area demonstrates the effectiveness of the developed method in this paper, while the global adjustment method need to be further studied in future.
ACKNOWLEDGEMENTS
REFERENCES
Akima, H., 1970. A new method of interpolation and smooth curve fitting based on local procedures. Journal of the Associ-ation for Computing Machinery, 17(4), pp.589-602.
Du, G., 2009. China's lunar probe Chang'e-1 impacts moon. Http://news.xinhuanet.com/english/2009-03/01/content_1092-3205.htm (accessed 1 Sep. 2010).
Li, C., et al., 2010. Laser altimetry data of Chang’E-1 and the global lunar DEM model. Sci. China Earth Sci (in Chinese), 40(3), pp. 281-293.
Neumann, G. A., et al., 2001. Crossover analysis of Mars Orbit-er LasOrbit-er AltimetOrbit-er data. Journal of Geophysical Research, 106(E10), pp.23753-23768.
Ping, J. et al., 2009. Lunar topographic model CLTM-s01 from Chang’E-1 laser altimeter. Science in China Series G: Physics, Mechanics & Astronomy, 52(7), pp.1105-1114.