ACCURACY AND RELIABILITY ASSESSMENT OF GLAS MEASUREMENTS OVER
ISRAEL
Zachi Shtain, Sagi Filin
Mapping and Geo-Information Engineering, Technion
–
Technology Institute of Israel, Haifa, 32000, Israel
(shtain, filin)@technion.ac.il
KEY WORDS: GLAS, Absolute and Relative Accuracy, Reliability, Israel
ABSTRACT:
Availability of spaceborne laser data on a global scale motivates evaluation of their quality as a means to improve large scale terrain models or to identify changes over time. One prominent spaceborne system is the Geoscience Laser Altimeter System (GLAS) mounted on board the Ice Cloud and land Elevation Satellite (ICESat) whose objectives were to track elevation changes of the Greenland and Antarctica's glaciers, but topographic information on other regions has been acquired as well. As the ICESat mission is the first to offer high-standard spaceborne laser derived topographic information, this paper evaluates its data quality. To that end, a large set of laser returns over Israel has been utilized and evaluated against a wide spectrum of data as a reference.
1. INTRODUCTION
Laser based mapping is gaining increased popularity in recent years, mainly due to the accurate and detailed terrain characterization that such systems provide. A great advantage of the technology lies in its independence of exterior energy sources (thereby termed active sensing technology) making the acquired data unaffected by external lighting conditions, shadows, or objects distance from the sensor. While commonly applied using terrestrial and airborne platforms, availability of spaceborne data is on a global scale and may be of value for improving terrain models and detecting changes of the surface. In this context, it is important to evaluate the quality of the data both in terms of its potential utility and as a means to assess spaceborne laser data quality for future missions.
Among past spaceborne laser missions, the Ice Cloud and land Elevation Satellite (ICESat) mission is the first to offer worldwide high-standard laser data. ICESat’s orbital altitude is 600 km at an inclination of 94º, and the Geoscience Laser Altimeter System (GLAS) aboard the ICESat acquires elevation profiles of the entire earth along tracks that are revisited in a 183-day repeat cycle with 70 m diameter footprints spaced every 175 m. GLAS carried three different laser altimeters, L1, L2 and L3. Laser 1 (L1) was turned off shortly after the Spring 2003 campaign, to be replaced by Laser 2. The instrument timestamps each laser pulse emission, and measures the echo pulse waveform from the surface. A waveform, recording the laser back-scatter energy as a function of time, is digitized in 544 consecutive bins at a temporal resolution of 1ns over land for each footprint. The land waveform with a 15 cm vertical resolution, yields an 81.6m height range (544 waveform bins @15 cm/bin) for laser L1 and 150m (1000 bins @15 cm/bin) for laser L3 (Harding and Carabajal, 2005). Laser 2 operates in both height ranges (Duong et. al, 2007).
GLAS data are being archived and distributed by the National Snow and Ice Data Center (NSIDC). Fifteen data products are distributed, among which this study focuses on the GLA01, GLA05 and GLA14 products. The footprints of these waveforms are elliptical, with power distribution having a central maximum, while energy decreases towards the boundary (Harding and Carabajal, 2005).
In this study, a large set of laser returns over Israel has been evaluated against different sets of reference data, including airborne laser scanning, and digital elevation models. The accuracy and reliability of GLAS measurements were assessed in a number of levels beginning with absolute measures against the external topographic data in different regions with different topographic characteristics. This was followed by relative accuracy of the points measured by self-comparison. Finally, an analysis of GLAS raw data was carried for examining the reliability of the energy distribution along its waveform. Results show that high level of inner and outer accuracy is achieved, considering the waveform size and the fact that data are acquired from a spaceborne platform.
2. DATASET AND STUDY AREAS
2.1 GLAS Data Overview
Among the fifteen data products, the GLA01 is the raw level 1 (preliminary) product, which contains the recorded full waveform data arranged in a predefined data structure. The GLA14 is a level 2 product of land surface elevation (following a set of corrections and precise orbit and attitude determination). Due to the potential complexities of land returns, e.g., combined influence of slope, roughness, vegetation, and manmade structures, level 2 land products are obtained by using a land-specific range algorithm (contrasting ones that refer to measurements in polar or ocean regions). Land-specific ranges are defined as the travel time from the GLAS sensor to the centroid of the last mode within the received waveform signal (Brenner et al., 2003). They are stored in the GLA05 data product. Integrating the land-specific range with the precise orbit determination (POD) and precise attitude determination (PAD), and after all instrumental, atmospherical and tidal corrections have been applied, the latitude, longitude, and footprint elevation can be computed (Brenner et al., 2003).
2.2 Deriving Range Measurements from GLAS Waveforms
an assumption is made that the last mode corresponds to the surface and that earlier ones correspond to overlying vegetation and/or manmade features. This assumption is important for operational waveform processing, but it may err in a variety of circumstances, such as: the surface within footprint is composed of multiple discrete surfaces separated by height (e.g., cliffs) and dense vegetation. Nevertheless, these circumstances are likely to be rare (Brenner et al., 2003).
As the transmitted pulse is assumed Gaussian, if the surface topography is Gaussianly distributed, the return should be Gaussian as well. The NSIDC's processing algorithm considers the return as consisting of a sum of Gaussians with an addition of a bias. Leading to the waveform being modeled as: Gaussians composing the waveform, Am is the amplitude of the
m-th Gaussian, is the bias (noise level) of the waveform, tm is the m-th Gaussian position, and m is the standard deviation of the m-th Gaussian (Brenner et al., 2003).
The waveform decomposition algorithm makes use of the second-order derivative of the waveform in order to determine the number of modes, and thereby, the number of Gaussians in the waveform. Brenner et al. (2003) argue that a local maximum is considered a mode if its amplitude is bigger than a certain threshold value. This threshold is determined based on the noise level and its variance. A nonlinear least-squares procedure is used to compute the model parameters (, Am, tm, and m) in Eq. (1), modified to include weights and a priori error estimates on the model parameters.
The existence of other waveform decomposition algorithms such as Hofton et al. (2000a), Persson et al. (2005), or Li (2008) questions whether the NSIDC's algorithm is best suitable for decomposing GLAS waveforms.
2.3 The Geolocation Equation
The transformation of the measured range into a ground coordinate system involves a rotation according to the altimeter attitude and a translation according to its position. This transformation is also known as the geolocation equation. The laser geolocation equation models the incorporation of the different components of a laser altimeter system by means of the transformations between the different reference frames. The form is well established (see Filin, 2001) and is given in
with xl– the footprint location in WGS-84 coordinate system;
x0 – location of the phase center of the GPS receiver; Rw – rotation from the local ellipsoidal system into the WGS-84 geocentric reference frame; RG – rotation from the reference system defined by the local vertical, to the ellipsoidal reference frame; RINS – rotation from the body reference frame to the which is needed for attitude determination of satellite system, a combination of star cameras and INS unit(s) is employed.
2.4 Study Areas
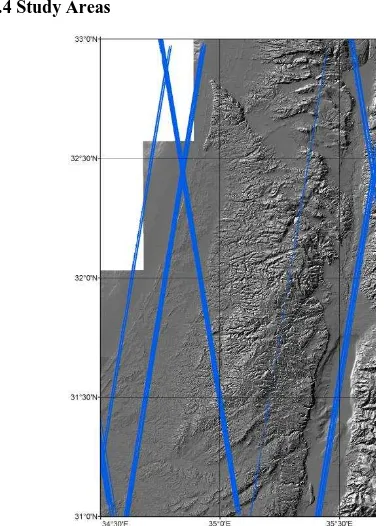
Figure 1. GLAS measurements overlaid on top of a shaded relief map of Israel (Hall, 1994) – 31º07'-32º57'N in latitude
and 33º 58'-35º39'E in longitude.
Figure 1 show an overview of the entire GLAS dataset available over Israel. This study focused on four different localities, i) the Sharon area (32º14'-32º22'N in latitude, and 34º50'-34º53'E in longitude), ii) the Negev (31º11'-31º18'N in latitude, and 34º29'-34º32'E in longitude), iii) Herzliya (32º09'-31º12'N in latitude, and 34º48'-34º53'E in longitude), and iv) Netanya (at 32º20'N 34º52'E). The four regions differ in their characteristics one from the other. Both the Sharon and Negev areas are open regions, but the Sharon area is rather a uniformly leveled area, whereas the Negev is characterized by an undulating topography. Similar to the Sharon area, Herzliya has a leveled topography, but being an urban environment it is characterized by buildings and other manmade structures. The topographic diversity enabled evaluating the effect of different landform shapes on GLAS accuracy and its reliability.
The terrain model that was used for this study is national level DTM, which was acquired by using classical photogrammetric methods. The topographic data consists of a regular grid at a 50×50 m resolution and an additional layer of topographic features (ridges, valleys, etc.) which provides a more detailed and truer to reality topographic representation. The accuracy level of the elevation data is estimated at ±3 m for the regular grid data. Another topographic reference dataset was obtained by an airborne laser scanning survey that was carried out in 2005 using the ALTM 2050 airborne laser scanner. From that campaign data were available in the Herzliya region. The point density is ~0.25 pt/m2. Accuracy assessment of this data is ±0.15 m.
3. METHODOLOGY
offered by GLAS, iii) specific waveform analysis in selected localities aiming to test the resemblance of the waveform data to the surface topography.
3.1 Absolute Height Comparison
In order to assess the accuracy of GLAS data, a comparison of the data derived from GLAS measurements to the topographic data was carried out. Since GLAS footprints are 70 m in diameter, the height has to be interpolated at the locations of the points calculated from GLAS measurements. Conversion from the ellipsoidal heights, provided by GLAS, to the common orthometric height in which the reference topographic data is given, made use of the Earth Gravitational Model 96 (EGM96, Lemoine et al., 1998), whose resolution is of 1°×1°.
Ranges derived from GLAS measurements are the mean elevation of the surface within the footprint. Thus, for comparing GLAS heights to the DEM, or the airborne laser scanning data, the elevations of all points within the laser footprints, were averaged. By comparing the GLAS derived height to the mean height derived from the reference data, the aim is to evaluate accuracy, but also potential offset between datasets.
The comparison was carried out in three different regions: the Sharon and Negev regions and Herzliya. In the first two, the national DEM data was used, while in Herzliya, airborne laser scanning data were available. Notably, only a small number of GLAS points fell within the range of laser scanning data.
3.2 Relative Height Comparison
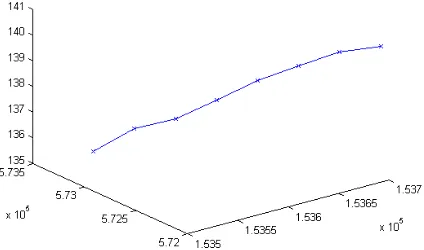
Relative accuracy is an important measure for the inner height determination consistency. As a relative measure it is independent of external data sources and the need to determine absolute heights. Consequently, a test that compared GLAS elevations to derived heights from interpolated values, as derived from their adjacent points along the track, was carried out. Because of the 172 m distance between two consecutive GLAS points, the comparison was limited to tracks over open areas, e.g., the Negev, in which has no extreme surface variations have been observed along the laser-derived profile (e.g., Figure 2).
Figure 2. An example for a profile over which relative height evaluation was carried out
3.3 Waveform Analysis
Finally waveforms were evaluated for their reliability by comparing the energy distribution of multimodal waveforms to the actual topography. Evaluation was in form (number of modes) and in distance between modes. Since most of the
multimodal waveforms are bimodal, the focus was on such. The studied bimodal waveforms were located in selected areas, which are either open ones (free of vegetation) or where manmade structures predate the GLAS mission.
4. RESULTS
4.1 Absolute Height Comparison Results
The comparison at the Sharon region consisted of evaluation of ~1000 points. About 40 of them had elevation differences higher than 15 m. Most of them were characterized by either bimodal or multimodal waveforms. Analysis of potential causes for such offsets explains such differences by the range difference between modes. Following the addition of the range difference between the highest-energy mode to the last one, the height difference has decreased significantly, fitting more or less the surface topography. Following these corrections, only 19 points had elevation difference higher than 15 m. These results suggest that the NSIDC processing method may assume that the strongest energy-wise mode corresponds to the ground, instead of the last mode in the waveform (maybe as a preventive measure against multipath effects).
In addition, some of the multimodal waveforms are characterized by modes which are close to one another, and are likely treated as a single mode. Figure 3 shows one such example, where the actual last mode consists in fact of two needle-like modes. By redefining the single mode into two and applying the necessary offset correction to the actual last mode, the elevation derived from GLAS data fitted better the surface elevation. Such phenomena lead us to assume that within multimodal waveforms, ones which are close to one another are clustered, instead of being considered bimodal (leading to offset ranges).
Figure 3. Multimodal waveform with clustered modes
Figure 4. Height differences histograms in Herzliya: a) both areas, b) urban area, c) open area
The absolute elevation comparison results of all three regions are summarized in Table 1, showing that on average, and following the undulation corrections, the average height difference in all three regions is close to zero. No substantial bias was observed between GLAS and the topographic data. The standard deviation values are similar, with the exception of the Negev region, which has a smaller value, most likely due to the fact that little off-terrain features are found there, unlike the Sharon and Herzliya regions which contain a larger amount of manmade structures.
Region
Statistic Negev Sharon Herzliya
Average 0.19 -0.17 0.13
Standard Deviation 3.58 4.21 4.88
Minimum -22.23 -13.80 -12.16
Maximum 19.52 21.10 28.90
Median 0.15 0.21 0.07
2.5 Percentile -8.93 -8.99 -7.10
97.5 Percentile 6.40 7.90 10.11
Table 1. Height comparison results
4.2 Relative Height Comparison Results
The relative height comparison was performed on data in the Sharon and Negev areas. Both are relatively open, and have little manmade structure within, and monotone in their topography. A total of 1003 points were used for the relative comparison. The data refers to different passes in both regions. For determining the elevation of the intermediate points, several interpolation methods have been tested, with an insignificant difference in results. The elevation of the intermediate points was, therefore determined via a simple linear interpolation.
Table 2 summarizes the results and shows that despite of the large distance between adjacent points along the GLAS track (about 172 m), the accuracy of interpolating the heights at points along the track is high, with a standard deviation of ±1.7 m. This result suggests that temporal comparison using GLAS measurements can be conducted not only over ice but can also be carried out over other surface types. Comparison of
cross-tracks data in Negev has shown no significant difference in elevation (data not shown).
Statistic Value [m]
Average -0.05
Standard Deviation 1.27
Minimum -4.88
Maximum 4.98
Median -0.01
2.5 Percentile -3.26
97.5 Percentile 3.07
Table 2. Relative Comparison Results
4.3 Bimodal Waveform Analysis Results
Studying GLAS bimodal waveforms has shown resemblance to objects within the surface. We demonstrate this in two different localities, the first features an open area with no off-terrain features on it, while the second is within an urban environment.
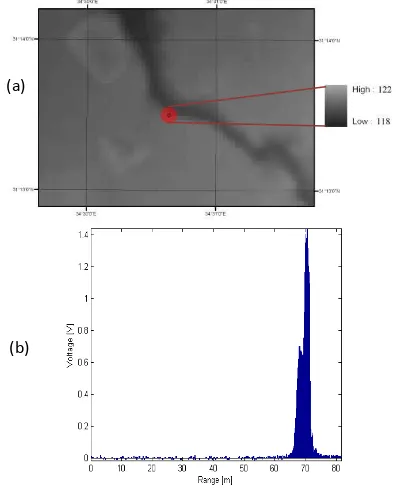
In the Negev region, we demonstrate this using a laser point that was located close to a ravine that crosses the area. The DEM (Figure 5a) shows that the area covered by the waveform has two elevation levels, one on the surface surrounding the ravine and the other in the ravine bottom. Accordingly, the waveform is bimodal (Figure 5b) with difference between modes that suit the height difference.
Figure 5. 3D view of DEM (a) and the waveform (b) at the location of the GLAS measurement
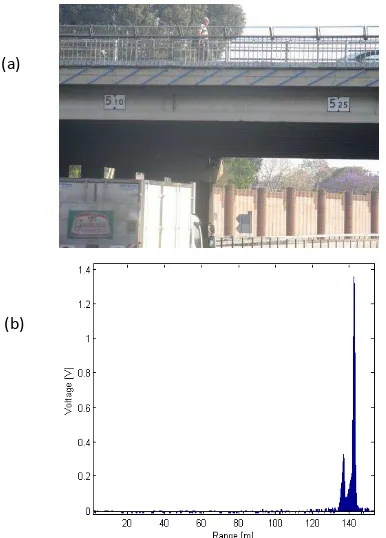
Another example is shown in Figure 6. Two of GLAS bimodal waveforms are located near the Netanya interchange. The road and the bridge form two leveled surfaces separated from one another. The respective waveform is indeed bimodal in form. Furthermore, when comparing the height differences as derived from GLAS data to that of the interchange (Figure 6a), a difference of ~½ meter is noticed. This is about the
(a) (b) (c)
height of the bridge from the lower part to the top level. Both results are indicative to the reliability of the waveform data as well as to the accuracy of its inner measures.
Figure 6. Height limitations for cars driving through the interchange (a), One of the waveforms at the interchange (b)
5. CONCLUSIONS
The results of this study show that the information derived from GLAS is accurate: better than 5 m when compared to the reference data. In addition, the relative comparison, which has been carried out, has confirmed the accuracy and reliability of GLAS data. These results have shown the accuracy of GLAS, despite of the footprint size (70 m in diameter) and the spacing between adjacent measurements (172 m) can be obtained. Moreover, the high accuracy of the relative comparison suggests that a temporal comparison is possible not only over ice, which is the main objective of the ICESat mission.
The bimodal waveform analysis has proven the reliability of GLAS bimodal measurements both in the form of the waveform itself and in the distances between modes inside the waveform. Nonetheless, even though the comparison results show high quality of the GLAS measurements, it may be assumed that improvement can be introduced to the processing algorithm in order to achieve better accuracy of the multimodal measurements.
REFERENCES
Afzal, R.S., Dallas, J.L., Yu, A.W., Mamacos, W.A., Lukemire, A., Schroder, B., Melak, A., 2000. The Geoscience Laser Altimeter System laser transmitter. In: Conference on Lasers and Electro-Optics, OSA Technical Digest. Optical Society of America, Washington, DC, pp. Waveform Analysis for Surface Elevations, Roughness,
Slope and Vegetation Heights. Geoscience Laser Altimeter System (GLAS) – Algorithm Theoretical Basis Document, Version 4.1. Airborne Laser Altimetry Over the Netherlands. ISPRS Workshop on Laser scanning 2007.
Duong , H., Pfeifer, N., Lidenbergh, R., (2006). Analysis of Repeated ICESat Full Waveform Data: Methodology and Leaf-On/Leaf-Off Comparison. ISPRS Workshop on 3D Remote Sensing in Forestry, Feb 2006, Vienna.
Filin, S., 2001, Calibration of airborne and spaceborne laser altimeters using natural surfaces, PhD dissertation, Department of Civil Engineering Environmental and Geodetic Science, The Ohio State University
.
Gardner, C. S., (1992). Ranging Performance of Satellite Laser Altimeters. IEEE Transactions on Geoscience and Remote Sensing, Vol. 30, No. 5.
Garvin, J., Bufton, J., Blair, J., Harding, D., Luthcke, S., Frawley, J., Rowlands, D., 1998. Observations of the Earth’s topography from the Shuttle Laser Altimeter (SLA): laser-pulse echo-recovery measurements of terrestrial surfaces. Phys. Chem. Earth 23, 1053–1068.
GLAS Science Team, (1997). Geoscience Laser Altimeter System Science Requirements.
Hall, J.K., 1994. Digital Shaded-Relief Map of Israel and Environs, Survey of Israel, Jerusalem, Israel.
Harding, D.J., Gesch, D.B. Carabajal, C.C., Luthcke, S.B., (1999). Application of the Shuttle Laser Altimeter in an Accuracy Assessment of GTOPO30, a Global 1-Kilometer Digital Elevation Model. In: Proc. ISPRS Workshop Mapping Surface Structure and Topography by Airborne and Spaceborne Lasers, La Jolla, CA. Int. Archives Photogram. Rem. Sens. 32(3-W14), pp. 81–85.
Harding, D. J., Bufton, J. L., Frawley, J. J., (1994). Satellite Laser Altimetry of Terrestrial Topography: Vertical Accuracy as a Function of Surface Slope, Roughness, and Cloud Cover. IEEE Transactions on Geoscience and Remote Sensing, Vol. 32, No. 2.
Hofton, M. A., Minister, J. B., Blair, J. B., (2000a). Decomposition of Laser Altimeter Waveforms. IEEE Transactions on Geoscience and Remote Sensing, 38(4).
Hofton, M., B. Blair, J. B. Minster, J. R. Ridgway, N. Williams, J. L. Bufton, D. L. Rabine (2000b). An Airborne Laser Altimetry Survey of Long Valley, California. Int. J. Remote Sensing 21(12): 2413-2437.
Lemoine, F. G., Kenyon, S. C, Factor, J. K., Trimmer, R. G., Pavlis, N. K., Chinn, D. S., Cox, C. M., Kolsko, S. M., Luthcke, S. B., Torrence, M. H., Wang, Y. M., Williamson, R. G., Pavlis, E. C., Rapp, R. H., Olson, T. R., (1998). The Development of the Joint NASA GSFC and NIMA Geopotential Model EGM96. NASA Goddard Space Flight Center, Greenbelt, Maryland, 20771, USA, July 1998.
Li, Q., (2008). Decomposition of Airborne Laser Scanning Waveform Data Based on EM Algorithm. The International Archives of the Photogrammetry, Remote
Sensing and Spatial Information Sciences. Vol. XXXVII. Part B1. Beijing 2008.
NSIDC, (2010). The National Snow and Ice Data Center website. http://nsidc.org/data/icesat/index.html (Last access December 2010)
Persson, Å., Söderman, U., Töpel, J., Ahlberg, S., (2005). Visualization and Analysis of Full-Waveform Airborne Laser Scanner Data. ISPRS WG III/3, III/4, V/3, Workshop "Laser Scanning 2005".
Ridgway, J. R., J. B. Minster, N. Williams, J. L. Bufton, W. B. Krabill (1997). Airborne Laser Altimeter Survey of Long Valley California. Int. J. Geophysics, 131: 267-280.
Schenk, T. (2001). Modeling and analyzing systematic errors of airborne laser scanners. Technical Notes in Photogrammetry No. 19, Department of Civil and Environmental Engineering and Geodetic Science, The Ohio State University, Columbus, OH., 40 pages.