FITTING OF PARAMETRIC BUILDING MODELS TO OBLIQUE AERIAL IMAGES
U. S. Panday and M. Gerke
University of Twente, Faculty of Geo-Information Science and Earth Observation – ITC, Department of Earth Observation Science, Hengelosestraat 99, P.O. Box 6, 7500AA Enschede, The Netherlands
panday23994@alumni.itc.nl, gerke@itc.nl
KEY WORDS:3D reconstruction, parametric building model, fitting, plane sweeping, overhang estimation, oblique aerial images, laser scanning
ABSTRACT:
In literature and in photogrammetric workstations many approaches and systems to automatically reconstruct buildings from remote sensing data are described and available. Those building models are being used for instance in city modeling or in cadastre context. If a roof overhang is present, the building walls cannot be estimated correctly from nadir-view aerial images or airborne laser scanning (ALS) data. This leads to inconsistent building outlines, which has a negative influence on visual impression, but more seriously also represents a wrong legal boundary in the cadaster. Oblique aerial images as opposed to nadir-view images reveal greater detail, enabling to see different views of an object taken from different directions. Building walls are visible from oblique images directly and those images are used for automated roof overhang estimation in this research. A fitting algorithm is employed to find roof parameters of simple buildings. It uses a least squares algorithm to fit projected wire frames to their corresponding edge lines extracted from the images. Self-occlusion is detected based on intersection result of viewing ray and the planes formed by the building whereas occlusion from other objects is detected using an ALS point cloud. Overhang and ground height are obtained by sweeping vertical and horizontal planes respectively.
Experimental results are verified with high resolution ortho-images, field survey, and ALS data. Planimetric accuracy of1cmmean and 5cmstandard deviation was obtained, while buildings’ orientation were accurate to mean of0.23◦and standard deviation of0.96◦with ortho-image. Overhang parameters were aligned to approximately10cmwith field survey. The ground and roof heights were accurate to mean of−9cmand8cmwith standard deviations of16cmand8cmwith ALS respectively. The developed approach reconstructs 3D building models well in cases of sufficient texture. More images should be acquired for completeness of overhang results and automatic accuracy check of roof parameters.
1 INTRODUCTION AND RELATED WORK
3D reconstruction of buildings from remote sensing data has wide range of applications. The application areas include environment and city planning, city growth monitoring, virtual tours of cities, cadastre systems, etc. (Englert and G¨ulch, 1996; Suveg and Vos-selman, 2004).
3D reconstruction of buildings from aerial imagery is an active research area in computer vision and photogrammetry. Man-ual processing of aerial images is time consuming and requires highly qualified operator and expensive instruments. Therefore, several automatic and semi-automatic methods of building recon-struction from nadir aerial images have been proposed in liter-ature (Englert and G¨ulch, 1996; G¨ulch et al., 1999; Suveg and Vosselman, 2004). However, only information in vertical direc-tion and none for the sides of an object is obtained from such data sources.
Oblique aerial imagery as opposed to nadir-view imagery reveals greater detail, enabling to see different views of an object taken from different directions (Wang et al., 2008b). Building fac¸ades are visible from oblique images which may be used for auto-mated texture extraction (Zebedin et al., 2006; Grenzd¨orffer et al., 2007). This fac¸ade information can be used to estimate roof overhang and model building’s walls.
The majority of building extraction strategies have two major stages: detectionandreconstruction. The former is used to lo-cate buildings’ position, called region of interest (ROI) while the later one reconstructs the buildings. For this research, buildings’ approximate location as well as their roof type are already known.
3D reconstruction of buildings from oblique aerial images is a relatively new research area in digital photogrammetry. There is no software and tools for automatic reconstruction of buildings from oblique imagery. Thus, considering the problems of nadir aerial images and keeping in mind the advantages of oblique ima-ges, this research aims to develop a proper, accurate, reliable and fully automatic method for 3D reconstruction of single and sim-ple buildings using oblique images.
Though oblique images have been used for texturing and visu-alization for many years (Fr¨uh et al., 2004; Grenzd¨orffer et al., 2007; Wang et al., 2008a), their use for measurement purpose is relatively new. Height calculation of an object from an oblique image is described in (H¨ohle, 2008). A dense matching method in oblique images is shown in (Gerke, 2009). While Mishra et al. (2008) use image descriptors like color, intensity gradients, and texture, Nyaruhuma et al. (2010) employ clues such as buil-ding edges, wall fac¸ades and texture present in oblique images to verify 2D vector data sets.
Automatic detection of rectangular flat roof buildings from multi-view oblique imagery is presented in (Xiao et al., 2010). There a plane sweeping technique is applied in order to identify buil-ding roof type. Hierarchical searching step for plane sweeping together with cross correlation is used to obtain height of a flat roof building.
2 METHODOLOGY
A three step building reconstruction approach is followed in this paper. First, the building roof is reconstructed by a fitting al-gorithm. A plane sweeping technique is then utilized to estimate roof overhang of the building in the next step. Finally, ground height and thus, the building height is obtained by sweeping of horizontal planes. More details can be found in (Panday, 2011).
2.1 Extended parametric building models
As overhangs are not modeled by existing approaches in litera-ture, they have no parameters to represent building’s overhang. Thus, we extended parameters of building models by Suveg and Vosselman (2004) so that complete building with overhang can be estimated. As symmetric properties are exploited in parametric building models, one parameter to represent overhangs in main direction (mo) and the other to represent overhangs from sides (so) are applied. The building models and their parameters are shown in figure 1. We concentrate here on simple, rectangular gable and hip roof buildings only.
(a) a gable roof building (b) a hip roof building
Figure 1: Parametric building models with overhang
2.2 Occlusion test
There are mainly two types of occlusion: i)self-occlusion in which part of an object (building) is obstructed/blocked by other parts of the same object (the building itself), ii) next occlusion type is caused by nearby objects like buildings and trees. If self-occlusion is not detected, edge lines (lines extracted from images) from nearby objects might be paired with the wire frame edge which is invisible in the image. Thus, edge lines corresponding to occluded wire frame edge from the image should not be used in the fitting algorithm. Use of those lines may lead to wrong fitting results. Also occlusion from other objects needs to be de-tected because it helps to make plane sweping algorithm work faster and reduces the risk of getting wrong overhang results.
A wire frame edge is self-occluded if at least one of the planes formed by faces of the building is between the wire frame edge being tested and the camera center that obstructs the camera from viewing the wire frame edge. The intersection points of the face planes with viewing ray determine whether the wire frame edge is occluded in the image.
The method to test for self-occlusion of wire frame edges works as follows: a plane for each building face is formed. A line called viewing ray is defined from camera center at the moment of image acquisition to the midpoint of wire frame edge. Inter-section point of the plane with the viewing ray is checked. If the intersection point lies between the camera center and the mid-point of the wire frame edge being tested, the wire frame edge is assumed to be occluded (cf. figure 2a). The test is repeated for all faces of the building per wire frame edge. If a wire frame edge is occluded from any face of the building, it is taken as occluded wire frame edge.
(a) occluded and visible wire frame edges
(b) viewing ray obstructed by in-finite plane
Figure 2: Self-occlusion test
As a plane is infinite, it can intersect the viewing ray in between the camera center and the midpoint of the wire frame edge even when building face does not obstruct the wire frame edge at all (cf. figure 2b). Hence, two conditions have to be satisfied for a wire frame edge to be occluded: i) the intersection point must lie between the camera center and midpoint of the wire frame edge being tested, and ii) the intersection point must be interior to the face boundary.
The occlusion from nearby objects is used for overhang estima-tion only, which works as follows: laser points interior to the triangle formed by 2D coordinates of wall’s two corner points and camera center are selected first. A plane is formed using the 3D cordinate point of the wall corners and the camera center (cf. figure 3). The number of laser points with their height above the plane height at the (x,y) position is counted. If the count is greater than a preset threshold, the wall fac¸ade is assumed being occluded.
Figure 3: Occlusion from other building. Red dots represents laser points above the plane formed by wall corners and camera center. Black dots are other laser points.
2.3 Roof parameters’ estimation
We aim to have precise values of a building parameters whose approximate values are already given as well as newly introduced parameters for overhang. The algorithm fits roof wire frame edges to their corresponding edge lines extracted from images. It is an iterative least square method which approximates the changes in parameters’ value that are enforced to minimize the squared sum of perpendicular distances between edge lines and their nearest wire frame edge.
ex-tracted edge lines are computed. The exex-tracted edge lines that are within some distance and angle thresholds with one of the visible wire frame edges are selected and fed to fitting algorithm for fine tuning the building parameters.
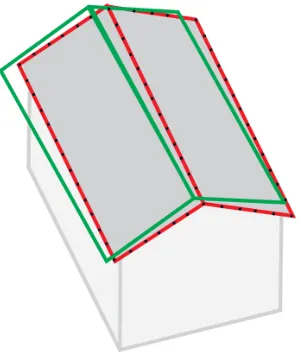
As we are dealing with straight edges only, we take everynth edge pixels as sample points and use their perpendicular distances to the nearest wire frame edge as observations (cf. figure 4). Two end points of the lines should be sufficient, but our strategy indi-rectly represents the length of edge lines. Longer edge lines have more influence in the fitting results which helps to establish a ro-bust system. A linearized observation equation for each sampling point on the edge lines can be produced. For a sampling point j, the observation equation can be written as
E(△uj) =
Where ujis perpendicular distance between the point jand its nearest wire frame, piare parameters, Kis number of parameter and △piis approximate change in ithparameter to be found out.
This algorithm is different from the algorithms by Lowe (1991) and Vosselman (1998). We use every nth
edge pixels in the fitting algorithm whereas Vosselman (1998) employs all pixels within a buffer around wire frame edges. Lowe (1991) uses all edge pixels. As only edge pixels participate in this fitting al-gorithm, unit weights are employed to them which is similar to (Lowe, 1991). In contrast to this, Vosselman (1998) uses gradient magnitude of the pixels as weight since both edge and non-edge pixels participate in his algorithm.
Figure 4: Fitting algorithm used in this research. Wire frame edges (in green), edge lines (in red), sampling points (with black dots) are also shown.
2.4 Overhang estimation
Roof overhangs of a building are found out by sweeping vertical planes. Starting at roof edge obtained from fitting, a vertical plane parallel to a wall fac¸ade is translated in the direction perpendic-ular to the wall. The correlation score is stored at every hypoth-esized position of the wall fac¸ade which is analyzed further to determine the wall location. Location of the wall just determined and roof information are used to obtain overhang.
If images are captured from exactly the same surface, the cor-responding pixels in the images will have similar intensity val-ues. Thus, correlation coefficients for each window will be higher
leading to high correlation ratio/score. If part of the images cover different area, the correlation coefficients for those area will be small and thus, results to low correlation score.
As all walls of a building are not visible in an oblique image, a test is made to check which walls are visible in a particular image. For a wall to be visible, both of its outermost edges must be visible. Images acquired from small viewing angle with the wall result in heavily distorted rectified images. Moreover, very large angle between image views is unfavorable for matching. In addition, very small angle between views leads to poor epipolar geometry. Thus, image pairs are selected based on some angle thresholds.
Since the overhang determined from a flat correlation curve is un-reliable, a test is made to check whether the image pairs have a clear peak. The percentage change of maximum correlation score with its nearest neighbor on both sides
i.e. maximum correlation−nearest point correlation
maximum correlation is employed as a measure of peak. Dividing by the maximum correlation helps to normalize the value between zero to one. This will assist to se-lect threshold more easily. Results from image pairs having no clear peak in the correlation score are dropped. Also image pairs with correlation scores below some threshold are not considered any further. The remaining image pairs are eligible pairs from which the overhang is determined.
As symmetry is exploited in parametric building models, same amount of overhang from opposite sides of the building is as-sumed. In other words, the equal roof overhangs from front and rear of the building are presumed. Similarly, same roof over-hangs from left and right sides are assumed. Thus, this process is repeated for the opposite wall as well and a single overhang para-meter is determined using all observations from both walls. The position of the plane corresponding to the maximum image cor-relation score among all eligible image pairs from front and rear walls gives the location of the walls and thus the main overhang.
Due to different perspectives and occlusion, slightly different a-mount of overhang can be obtained from different eligible image pairs. The difference of estimated overhang with those deter-mined from other eligible pair is used as an internal quality mea-sure.
Likewise, the process is repeated for side overhang which is ob-tained from image information containing left and right building walls.
2.5 Ground height estimation
Four horizontal planes around a building are sweeped in vertical direction to obtain ground heights in a fashion similar to finding wall location. As parametric buildings are represented by a single height, the minimum ground height of four area sections is taken to compute building height.
The process of determining ground height is the same as over-hang estimation described previously in Section 2.4. Instead of vertical plane, a horizontal plane is employed for sweeping. Sim-ilar to overhang estimation, the differences between the ground heights of same area section determined from different oblique image pairs are used as an automatic quality measure.
3 STUDY AREA AND DATASETS
Oblique aerial images are the main data source for this research. High resolution ortho-image was employed to verify planimetric accuracy of the results obtained where as field survey measure-ments were used to assess roof overhangs. Accuracy of the third dimension was assessed with airborne laser scanning (ALS) data.
Oblique images used for this study were acquired in February 2007 by Pictometry Inc. (Blom Aerofilms). The specification of the images is listed in table 1. All images used in this research were oriented using (Gerke, 2011), where scene constraints e.g. linear horizontal, vertical and right-angle get incorporated into the bundle block adjustment. After the self-calibration and bun-dle block adjustment, the RMSE of20cmwas found at check points.
ground sampling distance-GSD (cm) 10-16
Table 1: Specification of oblique images from Pictometry
Ground height and the building height were assessed with ALS data. These data were acquired in March 2007. The average point density of the laser data is20pts/m2 (Vosselman, 2008) with height accuracy of10cm.
The ortho-image used in the study was produced with images captured in March 2008 from Vexcel UltraCam D. The full re-solution ortho-image with nominal Ground Sampling Distance (GSD) of11cmwas available. The mean deviation of≈12cm
with Global Positioning System (GPS) measurements was found.
4 RESULTS AND DISCUSSION 4.1 Roof parameters estimation
Rough building models were reconstructed from ALS data using Point Cloud Mapper (PCM) software. This was done for buil-ding detection, which is not part of this research. Approximate parameters were computed from approximate corner points’ co-ordinates which were taken as initial parameters. 3D wire frames were created from these initial parameters. They were projected to images using camera orientation information of the images. The edge lines were extracted using Burns’ straight lines extrac-tion algorithm (Burns et al., 1986). The parameters’ value used for the algorithm are summarized in table 2. Edge lines within a distance of4pixelsand an angle of10◦around the projected roof wire frame edges were selected.
Perpendicular distance of every 5th
pixel on the edge lines to their nearest wire frame edge was employed as an observation to the fitting algorithm. It determined all roof parameters e.g. length, width etc. of building’s roof.
Planimetric accuracy and building’s orienatation of the fitting re-sults were verified against the high resolution ortho-image. Length and width of buildings were selected as representatives of roof parameters. The length and width of 26 buildings from the test site were assessed. Roof parameters of one building were unac-ceptable, while the algorithm completely failed to find matches of
parameter value bucket width 8 gradient mask 0 minimum no of pixels 15 minimum magnitude 2
vote 0.8
Table 2: Parameters of straight line extracting algorithm
wire frame edges to their edge lines for another one. The remain-ing 24 buildremain-ings’ roof parameters were satisfactorily obtained. The mean and standard deviation of length were0cmand5cm
while that of width were2cmand5cmrespectively. The mean and standard deviation of buildings’ orientation in xy-plane were found to be0.23◦and0.96◦with the ortho-image respectively.
Roof heights of the buildings were evaluated with ALS data. The mean height difference of8cmwas found with the laser data. The standard deviation was8cm.
Other roof parameters like ridge height and length were not as-sessed. Since their representative parameters (both planimetric and height) were already evaluated, explicit assessment of these parameters is unnecessary. Because buildings are shifted in an ortho-image, point coordinate measurement in an ortho-image is unsuitable for accuracy assessment of the absolute positions. On the other hand, accuracy of 2D maps are no better than that of the oblique images used in this research. At the same time, buildings are generalized in maps. Moreover, newly built buildings were unavailable in the map. Therefore, reference point coordinates of buildings were not assessed.
4.2 Roof overhang estimation
A list of visible wall and the images in which it is visible is made. Moreover, the walls with viewing angle (2D angle made by the wall with a line from the wall midpoint to the camera center) less than10◦ were filtered out as images captured from such a small viewing angle suffer a lot from distortion. As small angle between views results to poor epipolar geometry, 15◦theshold on angle between views of the image pairs was also used. The ex-periments were repeated later with 15◦threshold on both viewing angle and angle between image views.
Starting at roof edge position obtained previously, a virtual verti-cal plane was sweeped at every5cm. The two images of wall (as-sumed at vertical plane) were rectified using bilinear interpolation and correlation ratio/score was found using normalized correla-tion coefficient matching method. Matching threshold of0.7was used to decide whether the pixels are matching. The aperture size of7×7gave the best results. The threshold for minimum accept-able correlation score of0.05was chosen. Percentage change in maximum correlation score was used for peak test. A threshold of0.05on this ratio was applied.
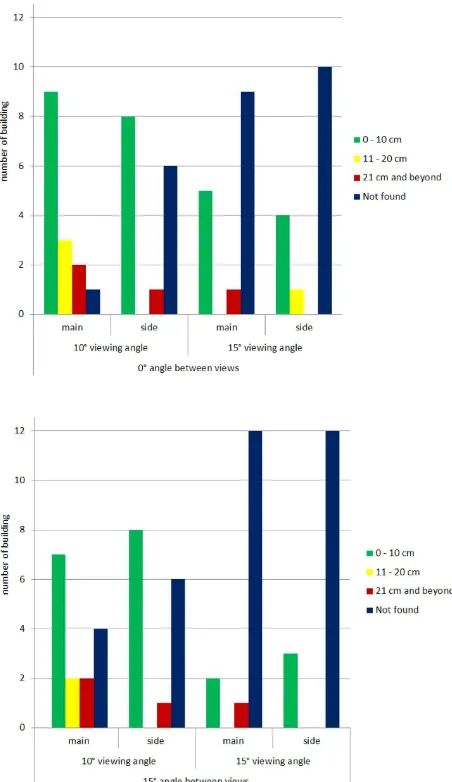
Twenty four buildings were taken for roof overhang comparison with the field survey measurements. None of the two overhangs were obtained for nine buildings. The histogram 5 illustrates the comparison of roof overhangs determined for fifteen buildings. Occlusion from other objects are not considered in this case.
Figure 5: Comparison of roof overhang with field survey mea-surement. Overhangs are estimated without taking into account the occlusion from other objects.
4.3 Ground height estimation
Four 2D horizontal planes were sweeped at every5cmaround four area section of the building. Window size of7×7was used to calculate correlation coefficient. Same threshold for minimum acceptable correlation ratio and peak constraint were applied to oblique images that were used for overhang estimation.
Out of 24 buildings taken for ground height verification, ten buil-dings had acceptable minimum ground height of the four section around the building. The mean and standard deviation of these buildings with laser data were found to be−9cmand16cm re-spectively. As ground height from laser data were taken from road side of the buildings only, seven buildings had acceptable ground height which were not minimum of the four sections. These were cases when the other sides are below the road level. In rest of seven cases, ground heights were unacceptable, proba-bly due to lack of proper texture.
Three area sections around buildings were not planar in major-ity of cases. The areas were occupied either with other buildings or vegetation. Therefore, minimum ground height was mostly found from the area section covering a road. As laser data were
taken from only road section while minimum ground height can be obtained from any sections around the building, the obtained minimum did not match with the reference data for some buil-dings.
5 CONCLUSION AND OUTLOOK
We conclude from this work that complete and realistic 3D buil-ding models with roof overhang can be obtained from oblique aerial images with acceptable accuracy. Redundancy in the in-put data sets are exploited. Differences in overhang values de-termined from different image pairs are delivered as an internal quality measure for overhang estimation. Similarly, deviations in ground heights from different image pairs covering same area sections around the building are presented as quality evaluation for height estimation.
The authors recommend to increase the overlap of images in fu-ture image acquisition. This will enable a more reliable check of roof parameters and completeness of the overhang results. Nadir images can be used to get approximate ground height followed by refinement with oblique images as was done by Panday (2011) in order to reduce computational load.
ACKNOWLEDGEMENTS
We want to thank BLOM Aerofilms for providing the Pictometry dataset of Enschede.
References
Burns, J., Hanson, A. and Riseman, E., 1986. Extracting straight lines. IEEE transactions on pattern analysis and machine intel-ligence 8(4), pp. 425–455.
Englert, R. and G¨ulch, E., 1996. One-eye stereo system for the acquisition of complex 3D building descriptions. Journal for Spatial Information and Decision Making 9(4), pp. 16–21.
Fr¨uh, C., Sammon, R. and Zakhor, A., 2004. Automated texture mapping of 3D city models with oblique aerial imagery. In: Proceedings of the 2nd International Symposium on 3D Data Processing, Visualization and Transmission., pp. 396–403.
Gerke, M., 2009. Dense matching in high resolution oblique air-borne images. In: CMRT09: Object extraction for 3D city models, road databases and traffic monitoring : concepts, al-gorithms and evaluation, Paris, 3-4 September 2009. / ed by U. Stilla, F. Rottensteiner and N. Paparoditis. ISPRS, 2009 pp. 77–82.
Gerke, M., 2011. Using horizontal and vertical building struc-ture to constrain indirect sensor orientation. ISPRS Journal of Photogrammetry and Remote Sensing 66(3), pp. 307–316.
Grenzd¨orffer, G., Guretzki, M. and Friedlander, I., 2007. Pho-togrammetric image acquisition and image analysis of obli-que imagery - a new challenge for the digital airborne system PFIFF. International Archives of Photogrammetry, Remote Sensing and Spatial Information Sciences 36(1/W51), pp. 6.
H¨ohle, J., 2008. Photogrammetric measurements in oblique aerial images. Photogrammetrie, Fernerkundung, Geoinformation (1), pp. 7–14.
Lowe, D., 1991. Fitting parameterized three-dimensional models to images. IEEE Transactions on Pattern Analysis and Ma-chine Intelligence 13(5), pp. 441–450.
Mishra, P., Ofek, E. and Kimchi, G., 2008. Validation of vec-tor data using oblique images. In: Proceedings of the 16th ACM SIGSPATIAL international conference on Advances in geographic information systems, pp. 1–10.
Nyaruhuma, A., Gerke, M. and Vosselman, G., 2010. Line mat-ching in oblique airborne images to support automatic verifica-tion of building outlines. In: Proceedings of ASPRS 2010 an-nual conference : opportunities for emerging geospatial tech-nologies, 26-30 April 2010, San Diego, California, p. 10.
Panday, U. S., 2011. Fitting of parametric building models to oblique aerial images. Master’s thesis, University of Twente, Faculty of Geo-Information Science and Earth Observation (ITC), Enschede, The Netherlands.
Suveg, I. and Vosselman, G., 2004. Reconstruction of 3D buil-ding models from aerial images and maps. ISPRS Journal of Photogrammetry and Remote Sensing 58(3-4), pp. 202–224.
Vosselman, G., 1998. Interactive alignment of parameterised ob-ject models to images. International Archives of Photogram-metry and Remote Sensing 32, pp. 272–278.
Vosselman, G., 2008. Analysis of planimetric accuracy of air-borne laser scanning surveys. International Archives of Pho-togrammetry, Remote Sensing and Spatial Information Sci-ences 37, pp. 99–104.
Wang, M., Bai, H. and Hu, F., 2008a. Automatic texture acqui-sition for 3D model using oblique aerial images. In: First In-ternational Workshop on Intelligent Networks and Intelligent Systems, 2008. ICINIS’08, pp. 495–498.
Wang, Y., Schultz, S. and Giuffrida, F., 2008b. Pictometry’s pro-prietary airborne digital imaging system and its application in 3D city modelling. International Archives of Photogram-metry, Remote Sensing and Spatial Information Sciences 37, pp. 1065–1069.
Xiao, J., Gerke, M. and Vosselman, G., 2010. Automatic detec-tion of buildings with rectangular flat roofs from multi-view oblique imagery. In: PCV 2010 - ISPRS Technical Commis-sion III Symposium on Photogrammetry, Computer ViCommis-sion and Image Analysis, Vol. XXXVIII, Saint Mand, France, pp. 251– 256.