INVESTIGATING THE CAPABILITY OF IRS-P6-LISS IV SATELLITE IMAGE FOR
PISTACHIO FORESTS DENSITY MAPPING (CASE STUDY: NORTHEAST OF IRAN)
F. Hoseini a, A. A. Darvishsefat b, *, N. Zargham c
a MSc Graduated, Faculty of Natural Resources, University of Tehran, Iran - [email protected]
b
Prof., Faculty of Natural Resources, University of Tehran, Iran - [email protected]
c
Associate Prof., Faculty of Natural Resources, University of Tehran, Iran - [email protected]
KEY WORDS: IRS-P6-LISS IV, Ground Truth, Pistachio Forests, Forest Density, Iran
ABSTRACT:
In order to investigate the capability of satellite images for Pistachio forests density mapping, IRS-P6-LISS IV data were analyzed in an area of 500 ha in Iran. After geometric correction, suitable training areas were determined based on fieldwork. Suitable spectral transformations like NDVI, PVI and PCA were performed. A ground truth map included of 34 plots (each plot 1 ha) were prepared. Hard and soft supervised classifications were performed with 5 density classes (0-5%, 5-10%, 10-15%, 15-20% and > 20%). Because of low separability of classes, some classes were merged and classifications were repeated with 3 classes. Finally, the highest overall accuracy and kappa coefficient of 70% and 0.44, respectively, were obtained with three classes (0-5%, 5-20%, and > 20%) by fuzzy classifier. Considering the low kappa value obtained, it could be concluded that the result of the classification was not desirable. Therefore, this approach is not appropriate for operational mapping of these valuable Pistachio forests.
* Corresponding author.
1. INTRODUCTION
Pistachio (Pistacia vera) natural forests are one of the most important forest reserves in Iran which are considerable for their conservational and economical conditions. Providing spatial information and thematic maps are essential for recognize recognizing and manage managing these valuable forests. Unfortunately, there is not enough and comprehensive information related to this area.
Forest canopy play a significant role in forest production, climate and ecosystem functions. Information describing forest canopy is essential for monitoring and sustainable management. There is a high urgency to develop new methods to map forest canopy in an efficient and timely manner. Remote sensing techniques are applied due to their synoptic and repetitive nature and ability to be utilized in areas which are not easily accessible. There are a variety of approaches that have been used to map forest canopy: (1) object-based classification [Dorren et al., 2003], (2) Maximum likelihood forest canopy density mapper (4) artificial neural network [Joshi et al., 2006]. Due to importance of forest density maps, various satellite data and forest stands, continuing of these researches is needed. The main objective of this study is to investigate the capability of IRS-P6-LISS IV image for Pistachio forests density mapping in Khorasan province of Iran.
2. METHODOLOGY
2.1 Study area
The study area in this research covered 500 hectares of the Khajekalat pistachio forest of Khorasan province in northeast of Iran at the border to Turkeminestan (36° 56′ 56″ N and 49° 53′ 54″ (Figure 1). This area is characterized by warm summer and cold winter with low precipitation which is located on 500-1243 meters above sea level.
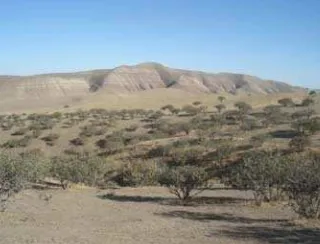
Pure stands of pistachio (Pistacia vera) with rarely associate species as Zygophylum eurypterum & Amygdalus scoparia in forms of bush, shrub and high trees are observed [Revised Plan of Pistachio Forest of Khajehkalat Studies, 2009]. Forest structure consists of coppice and high stands with low density (<25%) as sown in figure 2.
Figure 1. Location of the study area in Iran
Figure 2. Overall view of the study area International Archives of the Photogrammetry, Remote Sensing and Spatial Information Sciences, Volume XXXIX-B8, 2012
XXII ISPRS Congress, 25 August – 01 September 2012, Melbourne, Australia
2.2 Ground truth map
To assess the capability of IRS-P6-LISS IV images for forest density mapping, an accurate ground truth was prepared through fieldwork, since there is no update aerial photo or other very high resolution images. An inventory grid of 500m×500m and 34 plots (each plot 1 ha) with random systematic distribution were designed on a topographic map. Coordinates center of the samples were entered to a handheld GPS. After revealing the plots in forest, their densities were estimated qualitatively in density classes of 0-5%, 5-10%, 10-15%, 15-20% and > 15-20%. There was no forest area with density more than 25% in the study region. Due to coppice forest and low BHD of trees, number of trees in hectare could not be an appropriate parameter to estimate the density. Therefore, percent of tree canopy cover was estimated in each sample plot. The resulted density vector map was converted to raster format (Figure 3). Finally a ground truth map with 3 classes was produced to be compared with map resulted of satellite image analysis.
Figure 3. Sample ground truth overlied on the satellite image of the study area
3. DATA
3.1 Satellite data and geometric correction
A subset of a map oriented IRS-P6-LISS IV with 3 bands (B3, B3 and B4) and 10m resolution dated 31-August 2007 has been used. The image underwent level 1G processing (geometrically and radiometrically corrected) and had no cloud cover. The subset was rectified to another precise orthorectified IRS-P6 from the same region and year with GCP method (RMSe<5m). The nearest neighbour resampling method was performed to produce image with the same resolution of ground truth (5m). The image was geocoded to the UTM coordinate system.
3.2 Image processing
In order to extract more accurate information from satellite data, various suitable enhancements such as principal component analysis [Eastman, 2006] and band rationing were performed. Since the canopy cover is very low, distance-based vegetation indices were also calculated to reduce influence of
soil background using soil line parameters [Alavipanah, 2003]. These parameters were estimated based on regression analysis of Red and NIR reflection of different soil types existed in the study area.
3.3 Image classification
Supervised classification methods were used for image analysis. The training set into 5 density classes was defined.
The best spectral band-sets were selected using bhattacharrya distance and transformed divergence criteria based on training areas. Classification utilizing original and synthetic bands with maximum likelihood (ML), minimum distance to mean (MD) and fuzzy classifier was performed. Since the primary results indicated spectral interference between some density classes, these classes were merged together and the classifications were repeated. In order to eliminate single pixels deviating from the neighbourhood, a majority filter (7×7 pixels = 35m×35m) was done on the resulted maps. Accuracy assessment of classification outputs was accomplished through the use of error matrices detailing producer, user and overall accuracy and an overall kappa statistic [Congalton & Green, 1999].
4. RESULTS
-Desired coincidence between crest and valley layers of digital topographic maps and the rectified satellite image indicated high precisian of the image rectification.
-The ground truth map included of five density classes (0-5%, 5-10%, 10-15%, 15-20% and > 20%) was prepared for about 7% of the study area (Figure 3).
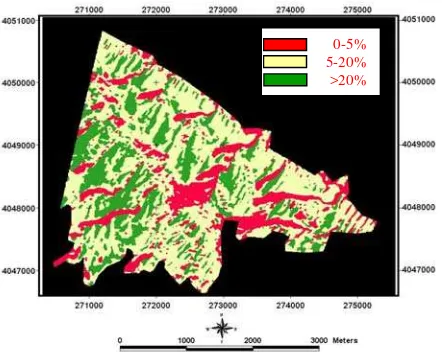
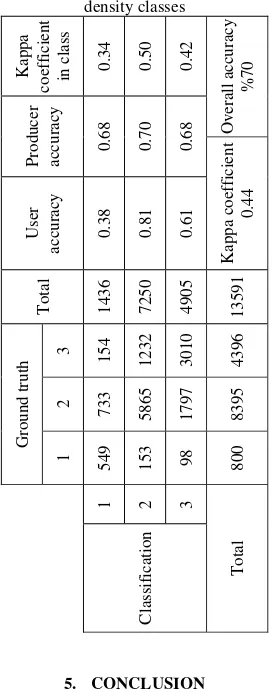
-Classification outputs with 5 density classes showed undesirable overall accuracy and kappa coefficient of 50% and 0.31 respectively. Merging some classes with spectral similarity improved the result. The best result of forest density classification was acquired by fuzzy classifier with 3 classes (0-5%, 5-20%, >20%). The overall accuracy and kappa coefficient were 70% and 0.44, respectively (Table 1). Figure 4 presents the result of recent classification.
Figure 4. Map of canopy density with three classes resulted from fuzzy classifier (UTM Zone 41, WGS84)
0-5%
5-20%
>20%
International Archives of the Photogrammetry, Remote Sensing and Spatial Information Sciences, Volume XXXIX-B8, 2012 XXII ISPRS Congress, 25 August – 01 September 2012, Melbourne, Australia
Table 1. Error matrix of the best classification with three
Based on this investigation, fuzzy and maximum likelihood classifiers indicated almost the same and the highest overall accuracy and kappa coefficient. According to the best band sets, the distance-based vegetation indices could improve the classification results slightly.
Considering the low kappa coefficient (0.44), even if reaching to pretty good overall accuracy (70%), the result of classification was not desirable because forest canopy is a continuous variable and the decision boundaries do overlap [Skidmore et al., 1988]. Remotely sensed data and classification methods applied in this research could not well classify forest density as a continuous variable in this low density forested area. Similar research confirms this too [Joshi et al., 2006]. Overall, it could be concluded that this approach is not appropriate for operational mapping of vast Pistachio forests. Higher spectral and spatial satellite data or multispectral digital aerial photos such as UltraCam images and object-based classification should be investigated as an alternative approach. In this case, the tree crowns could be detected and sum of areas per ha can be used for density estimation.
6. REFERENCES
Alavipanah, S. K., 2003, Remote sensing application in the earth science. University of Tehran Publication, 478 pp.
Congalton, K.G. and Green, K., 1999. Assessing the accuracy of remotely sensed data: Principles and practices. New York, NY: Lewis Publishers, 137 pp.
Dorren, L.K., Maier, A.B. and Seijmonsbergen, A.C., 2003. Improved Landsat-based forest mapping in steep mountainous terrain using object-based classification. Forest Ecology and Management, 183, 31-46 (2003).
Eastman, J. R., 2006. IDRISI Andes Guide to GIS and Image Processing. CLARK University, Version 15.00, 327 pp.
Joshi, C., Leeuw, J. D., Skidmore, A. K., Duren, I. C. V. and Oosten, H. V., 2006. Remotely sensed estimation of forest canopy density: a comparison of the performance of four methods. International Journal of Applied Earth Observation and Geoinformation, 8, 84-95.
Revised Plan of Pistachio Forest of Khajehkalat Studies, 2009. Natural Resources General Office of Razavi Khorasan Province, 139 pp.
Skidmore, A. K., Forbes, G.W. and Carpender, D.J., 1988. Non-parametric test of overlap in multispectral classification. International Journal of Remote sensing, 9, 777-785.
International Archives of the Photogrammetry, Remote Sensing and Spatial Information Sciences, Volume XXXIX-B8, 2012
XXII ISPRS Congress, 25 August – 01 September 2012, Melbourne, Australia