ON-LINE WAVELENGTH CALIBRATION OF PULSED LASER FOR CO
2DIFFERENTIAL ABSORPTION LIDAR
Chengzhi Xiang a, b, Xin Ma a, b*, Ge Han c, Ailin Liang a, b, Wei Gong a, b
a State Key Laboratory of Information Engineering in Surveying, Mapping and Remote Sensing, Wuhan
University, Luoyu Road 129, Wuhan 430079, China - (cxiang, maxinwhu, ireneliang, weigong) @whu.edu.cn b
Collaborative Innovation Center for Geospatial Technology, Luoyu Road 129, Wuhan 430079, China c
International School of Software, Wuhan University, Luoyu Road 129,Wuhan 430079, China - [email protected]
Commission I, WG I/2
KEY WORDS: On-line wavelength calibration, Pulsed laser, Multi-wavelength scanning, Energy matching
ABSTRACT:
Differential absorption lidar (DIAL) remote sensing is a promising technology for atmospheric CO2 detection. However, stringent wavelength accuracy and stability are required in DIAL system. Accurate on-line wavelength calibration is a crucial procedure for retrieving atmospheric CO2 concentration using the DIAL, particularly when pulsed lasers are adopted in the system. Large fluctuations in the intensities of a pulsed laser pose a great challenge for accurate on-line wavelength calibration. In this paper, a wavelength calibration strategy based on multi-wavelength scanning (MWS) was proposed for accurate on-line multi-wavelength calibration of a pulsed laser for CO2 detection. The MWS conducted segmented sampling across the CO2 absorption line with appropriate number of points and range of widths by using a tunable laser. Complete absorption line of CO2 can be obtained through a curve fitting. Then, the on-line wavelength can be easily found at the peak of the absorption line. Furthermore, another algorithm called the energy matching was introduced in the MWS to eliminate the backlash error of tunable lasers during the process of on-line wavelength calibration. Finally, a series of tests was conducted to elevate the calibration precision of MWS. Analysis of tests demonstrated that the MWS proposed in this paper could calibrate the on-line wavelength of pulsed laser accurately and steadily.
* Corresponding author
1. INTRODUCTION
As one of the most important greenhouse gases, carbon dioxide (CO2) is widely accepted as the main cause of climate change [1, 2]. Atmospheric CO2 concentration has increased by over 100 parts per million (ppm) from approximately 280 ppm to 400 ppm since the Industrial Revolution. Detection of atmospheric CO2 has been received increasing attention. However, the natural geographic distribution and temporal variability of CO2 sources and sinks are not well understood [3, 4]. In this case, precise monitoring of atmospheric CO2 concentration is imminent to analyse the nature and processes of carbon sources and sinks.
To address these issues, several systems have been developed to explore atmospheric CO2 with different techniques. Passive instruments, such as GOSAT and OCO-2, use spectroscopy of reflected near-infrared sunlight to retrieve the total column CO2 abundance [5, 6]. As a represent of active detection technology, DIAL
has also been widely used to detect atmospheric CO2
[7-10]
. This technique can not only measure the columnar CO2 but also provide vertical profiles of CO2 concentration distribution. However, DIAL systems are complex and have high technical requirements for atmospheric CO2 measurements. To achieve
high-precision CO2 measurements, stringent wavelength accuracy and stability are required. The wavelength of emitted laser must be locked in the absorption peak (on-line wavelength) and valley (off-line wavelength) with long-term stability. Otherwise, small wavelength deviations could cause a sharp increase in the error of the CO2 concentration inversion.
Many studies have been conducted on the on-line wavelength calibration, and a series of wavelength stabilization systems have been developed, which significantly improve the detection precision of DIAL [11-14]
. However, most of them are continuous-wavelength (CW) modulation systems, and on-line wavelength calibration is achieved by the calibration of a CW injection seed laser under the assumption that the wavelength of the output laser can be precisely controlled by the injection seed process. Until recently, limited knowledge has been available for the on-line wavelength calibration of pulsed lidar. In the DIAL system of pulsed laser, low signal to noise ratio (SNR) was generated by the inevitable energy fluctuations of pulsed laser. The demand of wavelength stabilization is higher, and the accuracy and stability are more difficult to guarantee. Furthermore, precision of CO2 detection remains difficult to achieve because the absorption line of CO2 is narrow, about 0.1599 nm between the absorption peak and valley. As a result,
sounding atmospheric CO2 at a high level of precision is more difficult through the DIAL system of pulsed laser.
In this paper, an on-line wavelength calibration strategy based on the multi-wavelength scanning (MWS) was proposed for accurate on-line wavelength calibration of a pulsed laser for CO2 detection. The MWS conducted segmented sampling across the CO2 absorption line with appropriate number of points and range of widths by using a tunable laser. Complete absorption line of CO2, including the absorption peak and valley, can be obtained through a curve fitting. Then, the on-line wavelength can be easily found at the peak of the absorption line, avoiding strict locking of on-line wavelength. The MWS has the characteristics of simple, fast and stable. For a better performance, another algorithm called the energy matching was also introduced in the MWS to eliminate the backlash error of tunable laser during the process of on-line wavelength calibration.
2. PRINCIPLES AND METHODS
2.1 DIAL principle
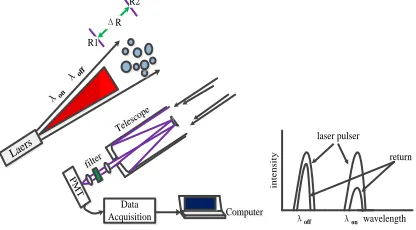
DIAL is an promising means for the detection of CO2, water vapor, temperature, humidity and aerosols [3, 15]. The diagram of the ground-based DIAL is shown in Fig. 1. In the experiment of atmospheric composition detection through the DIAL system, two lasers with similar wavelengths are transmitted. One laser is in the center of the detected components absorption peak to obtain the maximum absorption, called the on-line wavelength ( on); the other is near the valley of absorption, making the absorption as small as possible, called the off-line wavelength ( off). The lidar calibration constant for the lidar, A is the light area of the receiving telescope, c is the speed of light, τ is the laser pulse duration, β (λ, r) is the backscatter coefficient of the atmosphere, α0(λ, r) is the extinction coefficient of the atmosphere (excluding the trace gas under study), Ng (r) is the number of trace gas density, and σg (r) is the absorption cross section of the trace gas.
When the laser wavelength range is small and the time frame is short, several atmospheric parameters change slightly with the wavelength. These parameters can be regarded as constants in the DIAL system. Furthermore, closely neighboring spectral lines are often adopted for actual atmospheric CO2 measurement. Consequently, a small change of wavelength implies a negligible change in the target reflectivity, system efficiency, and other factors, such as the atmospheric attenuation [16, 17].
Dividing Eqn.(1) for on-line and off-line wavelengths, respectively, returns the range-resolved atmospheric CO2 concentration, expressed as
2 1
Figure 1. Diagram of the ground-based DIAL
2.2 On-line wavelength calibration based on multi-wavelength scanning (MWS)
The MWS conducted segmented sampling across the CO2 absorption line with appropriate number of points and range of widths. In practical, the number and wavelength interval of points are various and can be adjusted in accordance to the situation. The general principle is that, all points are spread on both sides of the absorption peak, points those close to the absorption peak are relatively dense, while those away from the absorption peak are sparse. In this study, wavelength sampling is divided into three sections: two sections are away from the absorption peak on both the left and right sides while another section is near around the absorption peak.
The process of on-line wavelength calibration by absorption peak. In this study, the starting and ending wavelength are set at 1572 nm and 1573 nm, respectively. The wavelength scanning interval is 20 pm at 1572 nm, and it can be described as ~3 pm at absorption line was conducted through three sections. The redefined starting and ending wavelengths of first section are set to 1572.10 nm and 1572.16 nm, respectively. For the second and third sections, these
parameters are about 1572.16 nm and 1572.20 nm; 1572.20 nm and 1572.25. The scanning intervals of the first and third sections are about 10 pm, while the second section is about 3 pm. When reiterating this process to the redefined starting wavelength, the first reverse backlash will appear. Because this backlash is caused by the grating rotation, the actual wavelength will be on the right side of the set value. Then, a second backlash appears when the hyperfine scan is started.
(3) A curve fitting is conducted to obtain position of the absorption peak exactly, and calculate the difference value between the exact wavelength and the starting wavelengths in step (2).
(4) Set the wavelength to the starting value in step (2) with a third backlash, and then adjust the wavelength in accordance with the difference value calculated in step (3) with a forth backlash.
In addition, the backlash effect of a tunable laser must be considered in the process of on-line wavelength calibration. It can be noted from the process that there are four backlashes in the calibration of on-line wavelength, two of them are positive backlashes and the other two are negative backlashes (supposing the backlash of scanning from left to right is positive). Then, four preceding backlashes will offset each other if the drifts of wavelength caused by backlashes are same, the wavelength at the CO2 absorption peak will be accurately determined. However, this method will be invalid when the drifts of wavelength caused by backlashes are not same. To solve this problem, another algorithm called the energy matching was introduced in the MWS to eliminate the backlash error of tunable lasers during the process of on-line wavelength calibration.
The process of the energy matching method is as follows:
(1) A wavelength scanning is conducted with starting wavelength of ��; and the curve of energy ratio-wavelength can be obtained.
(2) Find the wavelength of largest energy ratio from the curve of energy ratio-wavelength and mark it as
� .
(3) Set the wavelength to the starting value of �1, which can take any value between �� and � . The wavelength of output laser is not consistent with �1 because of a backlash was produced in this step as the reverse of stepper motor in tunable laser. Mark the wavelength of output laser as �1’.
(4) The energy ratio of �1 was obtained and the energy ratio of output laser was measured by a high-precision infrared detector.
(5) Take Δ� as the moving interval to start moving with small step from �1’. Measure the energy ratio of laser continuously and match it with the energy ratio of �1.
(6) Repeat step (5) until a wavelength with the same energy ratio of �1 is located accurately. Then the wavelength is marked as �2, which is the theoretical wavelength of �1. The moving steps is recorded and marked as n. The difference between �1’ and �2 can be calculated by nΔ�.
(7) Calculate the difference between �2 and � , marking it as Δ�’, and the difference between �1’ and
� can be obtained by nΔ�+Δ�’, which was marked
asΔ�’’.
(8) Jump the wavelength of laser from �1’ to � with the interval of Δ�’’. This process has no backlash as there is no reverse of stepper motor in tunable laser; and the wavelength at the CO2 absorption peak will be located accurately.
Feasibility analysis is conducted to demonstrate that the method of energy matching can eliminate the backlashes of tunable lasers and determinate the position of on-line wavelength accurately. First, due to the value of backlash is small, so difference between
�1’ (the actual wavelength of output laser when the starting wavelength is set as �1) and �2 (the theoretical wavelength of �1)is small. �2 can be located accurately by the energy matching with small time-consuming. In addition, there are two backlashes in the process, produced in Step (3) and Step (5), respectively. The one produced in Step (3) can be eliminated by the difference between �� and � , as the difference of them is a constant value and not affected by backlashes. The other one produced in Step (5) can be eliminated by the energy matching between �1’ and �2.
Start
Coarse scanning
Fine scanning
Wavemeter
Curve fitting
Obtain �
Energy ratio-wavelength curve
Jump to the position of
�1(�1<� )
Energy matching (Take� as the moving interval)
The energy ratio of a
output laser matches with the energy ratio of �1
No
Obtain �2 (the wavelength with the same energy ratio of �1)
Yes
Obtain n (the moving steps that recorded)
Calculate Δ�’ (the difference between �2 and � )
CalculateΔ�’’=n Δ�+Δ�’ (the difference between �1’
and � )
Jump the wavelength of laser from �1’ to � with the
interval of Δ�’’
End
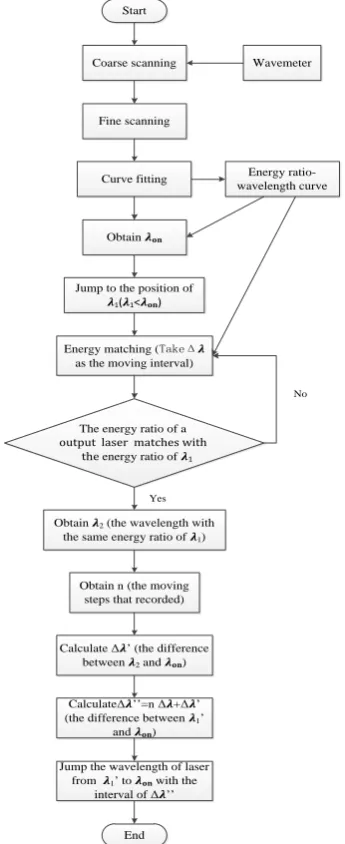
Figure 2. Flow chart of on-line wavelength calibration by MWS
The flow chart of on-line wavelength calibration is shown in Fig.2. With the location of on-line wavelength obtained by multi-wavelength scanning (MWS) and the elimination of backlashes in tunable lasers by energy matching, a calibration of on-line wavelength can be achieved accurately.
3. RESULTS AND DISCUSSION
The proposed method is tested by the examination of laboratory measurement data acquired by a 16 m gas absorption cell in our wavelength control unit. The result shows that the method is effective in calibrating the on-line wavelength of our DIAL system.
In our system, a dye laser is used to generate lasers of different wavelengths. The laser of the target wavelength is generated via difference frequency mixing between the fundamentals of the Nd:YAG laser (1064 nm) and the dye laser (634 nm), which is pumped by the second harmonic of the Nd:YAG (532 nm). As a consequence, the wavelength of the output laser can be changed by tuning the dye laser whose wavelength is changed by a stepper motor [18]. The fluctuation of laser emission system which takes dye laser as the source of tunable laser is high, about 10% at around 1.6 um region. In order to eliminate or reduces the influences, we normalized the lidar signal by a dual-differential method using two absorption cells.
The system configuration of the wavelength control unit is shown in Fig. 3 [19]. A total of 8% of the pulsed laser lights transmitted from the laser system is used as the laser source of the wavelength control unit. The laser is then tapped to 90:10 using a one-sided antireflection-coated glass, which is marked as M1. The lights of the 10% are transmitted to a wavemeter as the laser source of coarse calibration, and those of the remaining 90% are split by half using a semi-transmitting reflecting mirror, which is marked as M2. Two identical laser lights are then transmitted to the 16 m absorption cells: one is full of pure CO2, and the other is a vacuum. Both lights transmitted through the 16 m absorption cell are detected by an infrared detector, and the laser intensity is collected by an oscilloscope, in which the trigger signal comes from the laser system. The connecting lines marked as 1, 2, and 4 are bayonet nut connectors, whereas those marked as 3, 5, and 6 are commercial cables. The absorption line of CO2 can be obtained by the ratio of the intensity of two branches laser.
Laser system 7 8
Figure 3. System configuration of the wavelength control unit
In the system of the wavelength control unit, a high-speed sampling oscilloscope with sample rate of 20 GS/s is used to capture the whole laser energy waveform after the beam has passed through the absorption cell. Based on the stored half-sinusoidal wave information, the integral method can be applied to calculate the energy intensity more accurately. A segmented sampling across the CO2 absorption line was conducted through three sections. The starting and ending wavelengths of first section are set to 1572.10 nm and 1572.16 nm, respectively. For the second and third sections, these parameters are about 1572.16 nm and 1572.20 nm; 1572.20 nm and 1572.25. The scanning intervals of the first and third sections are about 10 pm, while the second section is about 3 pm. Fig. 4 is the result of the MWS with Gaussian fitting.
1572.08 1572.12 1572.16 1572.20 1572.24
Figure 4. Result of the MWS with Gaussian fitting on one absorption peak
Given that the actual wavelength of the transmitted laser is always inconsistent with the setting wavelength, the result of on-line wavelength calibration cannot be validated on the basis of theoretical wavelength. In this study, the distance between two absorption peaks is measured to verify the wavelength calibration accuracy. Subtracting the distance measured between two adjacent absorption peaks and the theoretical distance of these peaks, we can consider that the proposed method is accurate and effective for long-term stability if the result is within a certain error range. The result of the MWS on two absorption peaks is shown Fig. 5.
1571.8 1571.9 1572.0 1572.1 1572.2 1572.3 1572.4 1572.5 1572.6 1572.7 -0.6 Figure 5. Result of the MWS on two absorption peaks
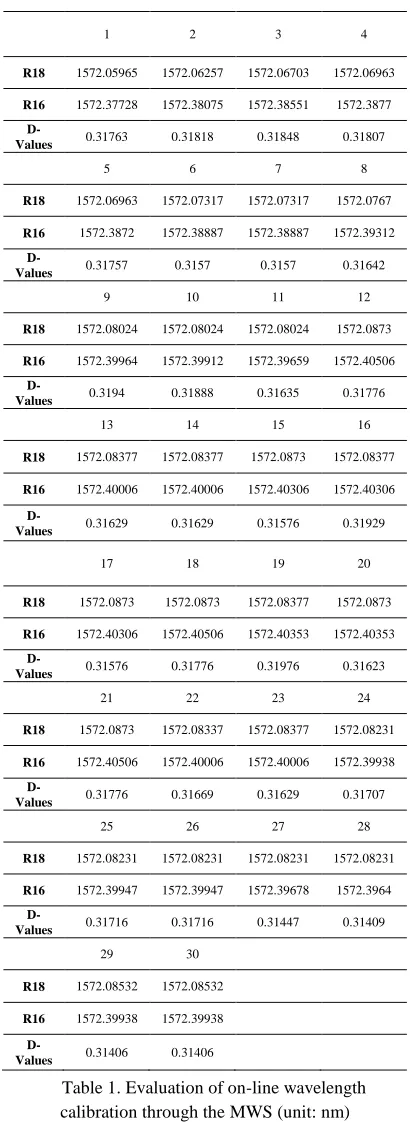
Thirty groups of on-line wavelength calibration experiments are performed at the R16 and R18 regions with a gas cell. The spanned wavelength range is set from 1,571.95 nm to 1,572.65 nm to obtain two absorption peaks in the scanning experiments. The
scanning intervals that away from the absorption peak is about 25 pm, while that close to the absorption peak is about 3 pm. The result of the on-line wavelength calibration of the laboratory experiments was analysed and the distances between the two absorption peaks are shown in the Table 1. For convenience, the phrase of difference values is abbreviated as D-Values.
1 2 3 4
R18 1572.05965 1572.06257 1572.06703 1572.06963
R16 1572.37728 1572.38075 1572.38551 1572.3877
D-Values 0.31763 0.31818 0.31848 0.31807
5 6 7 8
R18 1572.06963 1572.07317 1572.07317 1572.0767
R16 1572.3872 1572.38887 1572.38887 1572.39312
D-Values 0.31757 0.3157 0.3157 0.31642
9 10 11 12
R18 1572.08024 1572.08024 1572.08024 1572.0873
R16 1572.39964 1572.39912 1572.39659 1572.40506
D-Values 0.3194 0.31888 0.31635 0.31776
13 14 15 16
R18 1572.08377 1572.08377 1572.0873 1572.08377
R16 1572.40006 1572.40006 1572.40306 1572.40306
D-Values 0.31629 0.31629 0.31576 0.31929
17 18 19 20
R18 1572.0873 1572.0873 1572.08377 1572.0873
R16 1572.40306 1572.40506 1572.40353 1572.40353
D-Values 0.31576 0.31776 0.31976 0.31623
21 22 23 24
R18 1572.0873 1572.08337 1572.08377 1572.08231
R16 1572.40506 1572.40006 1572.40006 1572.39938
D-Values 0.31776 0.31669 0.31629 0.31707
25 26 27 28
R18 1572.08231 1572.08231 1572.08231 1572.08231
R16 1572.39947 1572.39947 1572.39678 1572.3964
D-Values 0.31716 0.31716 0.31447 0.31409
29 30
R18 1572.08532 1572.08532
R16 1572.39938 1572.39938
D-Values 0.31406 0.31406
Table 1. Evaluation of on-line wavelength calibration through the MWS (unit: nm)
The mean value of the D-Values is 0.31687 nm. The theoretical value between R16 and R18 is about 0.3171 nm, which obtained from the HITRAN 2012. It can be noted from the Table 1 that the method of
MWS can achieve enough accuracy of on-line wavelength calibration.
In addition, a long time energy monitor was conducted to test the stability of our wavelength control system. After the on-line wavelength calibration using the MWS, the laser of the on-line wavelength is then imported to the gas absorption cell of 16 m range, and the value of residual energy is obtained using the oscilloscope, following the collection procedures. Similarly, the location of the off-line wavelength is determined through the equation of off = on+0.1599, which is in accordance to the distance between the on-line and off-line wavelength from HITRAN 2012. The laser of the off-line wavelength is then imported to the gas absorption cell of 16 m range, and the value of residual energy is obtained. Energy monitoring is conducted once every 2 seconds; the values of residual energy of the on-line and off-line wavelengths are monitored about 1 hour, respectively. The result of energy monitor is shown in the Fig.6. The result demonstrated that the stability of our wavelength control system is fine, and the calibration of on-line wavelength by the MWS is stable enough for the atmospheric CO2 detection.
-200 0 200 400 600 800 1000 1200 1400 1600 1800 2000
-0.8 -0.6 -0.4 -0.2 0.0 0.2 0.4
On Off
L
o
g
a
ri
th
mi
c
e
n
e
rg
y
ra
ti
o
(a
.u
.)
No.
Figure 6. The energy monitor of on-line and off-line wavelengths
4. CONCLUSIONS
In this paper, an on-line wavelength calibration strategy based on the multi-wavelength scanning (MWS) was proposed for accurate on-line wavelength calibration of a pulsed laser, which is helpful to obtain accurate vertical profiles of atmospheric CO2 concentration. The principle of DIAL and the process of on-line wavelength calibration by the MWS were introduced. In addition, another algorithm called the energy matching was introduced in the MWS to eliminate the backlash error of tunable lasers during the process of on-line wavelength calibration. The feasibility analysis was conducted to demonstrate that the method of energy matching can eliminate the backlashes of tunable lasers and determinate the position of on-line wavelength accurately.
The MWS has the characteristics of simple, fast and sufficient accuracy. A total of 30 laboratory experiments on on-line wavelength calibration were conducted to assess the applicability of the proposed method. The mean accuracy of the on-line wavelength calibration was calculated to be 2.3 pm. In addition, a
long time energy monitor was conducted to test the stability of our wavelength control system. The result demonstrated that the MWS method can be used for the on-line wavelength calibration of pulsed laser accurately and steadily.
ACKNOWLEDGMENTS
This work was supported by the National Nature Science Foundation of China (No. 41127901) and the Program for Innovative Research Team in University of Ministry of Education of China (No. IRT1278).
REFERENCES
[1] Team CW, Pachauri R, Reisinger A. IPCC fourth assessment report: climate change 2007 [J]. IPCC, Geneva, Switzerland. 2007.
[2] Change IC. The Physical Science Basis. Working Group I Contribution to the Fifth Assessment Report of the Intergovernmental Panel on Climate Change [J]. Cambridge, United Kingdom and New York, USA. 2013.
[3] Behrendt A, Wagner G, Petrova A, Shiler M, Pal S, Schaberl T, et al., editors. Modular lidar systems for high-resolution 4-dimensional measurements of water vapor, temperature, and aerosols. Fourth International Asia-Pacific Environmental Remote Sensing Symposium 2004: Remote Sensing of the Atmosphere, Ocean, Environment, and Space; 2005: International Society for Optics and Photonics.
[4] Cox PM, Betts RA, Jones CD, Spall SA, Totterdell IJ. Acceleration of global warming due to carbon-cycle feedbacks in a coupled climate model [J]. Nature. 2000;408(6809):184-187.
[5] Hammerling DM, Michalak AM, Kawa SR. Mapping of CO2 at high spatiotemporal resolution using satellite observations: Global distributions from OCO-2[J]. Journal of Geophysical Research: Atmospheres. 2012;117(D6).
[6] Chevallier F, Maksyutov S, Bousquet P, Bréon FM, Saito R, Yoshida Y, et al. On the accuracy of the CO2 surface fluxes to be estimated from the GOSAT observations [J]. Geophysical Research Letters. 2009;36(19).
[7] Fiorani L, Saleh W, Burton M, Puiu A, Queißer M. Spectroscopic considerations on DIAL measurement of carbon dioxide in volcanic emissions [J]. J. Optoelectron. Adv. M. 2013;15:317-325.
[8] Gibert F, Flamant PH, Bruneau D, Loth C. Two-micrometer heterodyne differential absorption lidar measurements of the atmospheric CO2 mixing ratio in the boundary layer [J]. Applied optics. 2006;45(18):4448-4458.
[9] Fix A, Büdenbender C, Wirth M, Quatrevalet M, Amediek A, Kiemle C, et al., editors. Optical parametric oscillators and amplifiers for airborne and spaceborne active remote sensing of CO2 and CH4.
SPIE Remote Sensing; 2011: International Society for Optics and Photonics.
[10] Singh UN, Yu J, Petros M, Refaat T, Reithmaier K, editors. Development of a pulsed 2-micron integrated path differential absorption lidar for CO2
measurement. SPIE Optical Engineering+
Applications; 2013: International Society for Optics and Photonics.
[11] Kameyama S, Imaki M, Hirano Y, Ueno S, Kawakami S, Sakaizawa D, et al. Feasibility study on
1.6 m continuous-wave modulation laser absorption spectrometer system for measurement of global CO2 concentration from a satellite [J]. Applied optics. 2011;50(14):2055-2068.
[12] Kameyama S, Imaki M, Hirano Y, Ueno S, Kawakami S, Sakaizawa D, et al. Development of 1.6
m continuous-wave modulation hard-target differential absorption lidar system for CO2 sensing [J]. Optics letters. 2009;34(10):1513-1515.
[13] Koch GJ, Dharamsi AN, Fitzgerald CM, McCarthy JC. Frequency stabilization of a Ho: Tm: YLF laser to absorption lines of carbon dioxide [J]. Applied optics. 2000;39(21):3664-3669.
[14] Sun X, Liu J, Zhou J, Chen W. Frequency stabilization of a single-frequency all-solid-state laser for Doppler wind lidar [J]. Chinese Optics Letters. 2008;6(9):679-680.
[15] Behrendt A, Wulfmeyer V, Riede A, Wagner G, Pal S, Bauer H, et al., editors. Three-dimensional observations of atmospheric humidity with a scanning differential absorption lidar. SPIE Europe Remote Sensing; 2009: International Society for Optics and Photonics.
[16] Gong W, Han G, Ma X, Lin H. Multi-points scanning method for wavelength locking in CO2 differential absorption lidar [J]. Optics Communications. 2013;305:180-184.
[17] Gong W, Liang A, Han G, Ma X, Xiang C. Sensitivity of on-line wavelength during retrieval of atmospheric CO2 vertical profile [J]. Photonics Research. 2015;3(4):146-152.
[18] Xiang Chengzhi, Gong Wei, Ma Xin, Cheng Xuewu. A method to eliminate the backlash error of
tunable laser [J]. ACTA OPTICA SINICA.
2014;34(9):161-169.
[19] Gong W, Ma X, Han G, Xiang C, Liang A, Fu W. Method for wavelength stabilization of pulsed difference frequency laser at 1572 nm for CO2 detection lidar [J]. Optics express. 2015;23(5):6151-6170.