POINT CLOUD ORIENTED SHOULDER LINE EXTRACTION IN LOESS
HILLY AREA
LI mina,b, YANG xina,b,, XIONG liyanga,b
a Key Laboratory of Virtual Geographic Environment of Ministry of Education Nanjing Normal University No.1 Wenyuan Road,
Nanjing, China
b Jiangsu Center for Collaborative Innovation in Geographical Information Resource Development and Application. Nanjing, China
- (limin2652035, xxinyang, xiongliyang)@163.com
Commission III, WG III/2
KEY WORDS: Point cloud, Proceedings, Terrestrial 3D Laser Scanner, shoulder line, DEM, Loess hilly
ABSTRACT:
Shoulder line is the significant line in hilly area of Loess Plateau in China, dividing the surface into positive and negative terrain (P-N terrains). Due to the point cloud vegetation removal methods of P-(P-N terrains are different, there is an imperative need for shoulder line extraction. In this paper, we proposed an automatic shoulder line extraction method based on point cloud. The workflow is as below: (i) ground points were selected by using a grid filter in order to remove most of noisy points. (ii) Based on DEM interpolated by those ground points, slope was mapped and classified into two classes (P-N terrains), using Natural Break Classified method. (iii) The common boundary between two slopes is extracted as shoulder line candidate. (iv) Adjust the filter gird size and repeat step i-iii until the shoulder line candidate matches its real location. (v) Generate shoulder line of the whole area. Test area locates in Madigou, Jingbian County of Shaanxi Province, China. A total of 600 million points are acquired in the test area of 0.23km2, using Riegl VZ400 3D Laser Scanner in August 2014. Due to the limit Granted computing performance, the test area is divided into 60 blocks and 13 of them around the shoulder line were selected for filter grid size optimizing. The experiment result shows that the optimal filter grid size varies in diverse sample area, and a power function relation exists between filter grid size and point density. The optimal grid size was determined by above relation and shoulder lines of 60 blocks were then extracted. Comparing with the manual interpretation results, the accuracy of the whole result reaches 85%. This method can be applied to shoulder line extraction in hilly area, which is crucial for point cloud denoising and high accuracy DEM generation.
* Corresponding author
1. INTRODUCTION
Terrestrial laser scanners (TLS) provide detailed and highly accurate 3D data rapidly and efficiently (Axelsson 1999, R 2003, Bitelli, Dubbini et al. 2004, Bornaz and Rinaudo 2004, Barnea and Filin 2013). The applications of TLS instruments continue to increase. The massive point cloud data acquired by TLS record three-dimensional information, however they
contain many “noise” points due to great number of obstructions in natural environments. Every “noise” point
mainly vegetation point leads to incorrect surface modelling and need to be filtered and cleaned before surface modelling. Many scholars have researched the de-noisy algorithms and methods (Kraus and Pfeifer 1998, Axelsson 1999, Bleyer and Gelautz 2004, Ding, Ping et al. 2005, Filin and Pfeifer 2006, Jutzi and Stilla 2006, Biosca and Lerma 2008, Barnea and Filin 2013, Pirotti, Guarnieri et al. 2013). Our experiments shows that these algorithms and methods have good effects except for steep slope. Li et.al (2011) developed an effective double-filtering algorithm combining rough-double-filtering and precise filtering to solve this problem (Li, Wu et al. 2011). Ma et.al (2013) proposed a vegetation filtering method of TLS point cloud (Ma and Li 2013). There are some drawbacks in the mentioned methods to meet the practical applications.
Loess shoulder lines are the most important landform demarcations for geographical analysis, soil erosion modelling and land use planning in the Loess Plateau area of China.
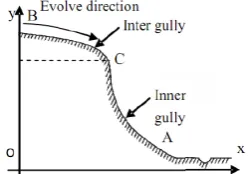
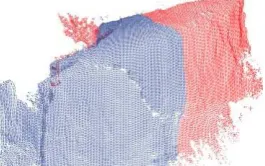
Figure.1 illustrates a hypothetical profile representing the point of morphological variation between the inner-gully area (AC) and the inter-gully (BC) between the loess positive and negative terrains (P-N terrains) (Zhou, Tang et al. 2010). The tool of RiScan software have been used to remove “noise” points with point cloud data of this area. Due to the topographical variation in the loess landform, the surfaces generated by the vegetation removal point cloud data are incorrect, which is Figure.2 shows the detail of vegetation removal point cloud which is incorrect surface.
Figure 1. Illustration of loess shoulder line profile(Yan, Tang et al. 2014)
Therefore, the shoulder line should be extracted to separate surface into positive terrain and negative terrain and removing
“noise” points respectively. Many methods of shoulder line extraction have been proposed based on DEM, which can be referenced (Lu, Qian et al. 1998, Xiao and Tang 2007, Zhou,
The International Archives of the Photogrammetry, Remote Sensing and Spatial Information Sciences, Volume XLI-B3, 2016 XXIII ISPRS Congress, 12–19 July 2016, Prague, Czech Republic
This contribution has been peer-reviewed.
Tang et al. 2010, Zhang, Tang et al. 2012, Yan, Tang et al. 2014). However, the method of high precise shoulder line extraction based on point cloud data is still unsolved because of
the “noise” points. Therefore, the main objectives of this paper are :1) to propose a new method to extract shoulder line based on point cloud for helping remove vegetation points and promise the correct surface modelling; 2) to realize the method automatically based on finding some law in point cloud data.
Figure 2. Incorrect surface generated by ordinary vegetation removal method. The left part of red points representing real vegetation points was removed correctly, while the right part representing land surface was removed wrongly.
2. TEST DATA
Test area belongs to loess hilly area and locates in Madigou, Jingbian County, Shaanxi Province, China. The climate in this area is semi-arid continental climate, the annual average temperature is 7.8℃, and the annual average precipitation is
395mm. The whole area contains a gully about 600 meters in length and its watershed, consisted of positive and negative terrains. The elevation difference is 151 meters. The main gully develops from west to east, and many young gullies develop on both sides of slopes.
The point cloud data was acquired in the test area of 0.23km2, using Riegl VZ400 3D Laser Scanner in August 2014. The total number of points exceeds 600 million and the average density of whole area is 2600 points per square meter. Considering the massive point cloud data and limited computing performance, 11 random and small sample areas around shoulder line were selected in this paper (Figure 3). Among them, 6 sample areas (black rectangle, 1-6) were used to find out the quantitative relation between filter grid size and point statistical characteristics. Others (yellow rectangle, t1-t5) were used to verify the relation.
Figure 3. The point cloud data of Madigou and the distribution of sample areas
3. METHODOLOGY
The average surface slope is usually lower than 25 degrees while in the inner-gully area, the slope suddenly gets steep over 35 degrees (Luo 1956). The slope variation is an important basis for identifying shoulder line. Due to the original point cloud contains lots of vegetation points, the removal of
vegetation points is needed for surface modelling. Therefore, a method of shoulder line extraction based on rough-filtering and slope grading was proposed.
Figure 4. Workflow of shoulder line extraction based on point cloud
The workflow is as below:
(I) Select ground points by using a grid filter. In order to remove most of vegetation points, a grid with certain size was used to separate original points into different grids. The lowest point in each grid would be selected easily. We have considered that the selected would also be non-ground points. Jin et.al (2013) have noticed the probability of ground points is greatest by using this approach (Jin, Yang et al. 2013). Due to the large difference of density in each sample area, the grid size needs adapt to the optimal grid sizes for every sample area.
(II) Interpolate DEM and classify the slope map. DEM was interpolated using ground points. Zhang (2014) proved that for DEM generation in loess landform, the Kriging method is better than Inverse Distance Weighted (IDW) and Nearest Neighbour Interpolation (Zhang 2014). Therefore, Kriging method was used in this paper. Then slope was mapped and classified into two classes, using Natural Break Classified method. Tang et.al (2006) compared several grading methods and found the Natural Break Classified have a better effect on identifying the slope variation (Tang and Song 2006).
(III) Extract shoulder line candidate. Due to two classes of slope were classified by slope grading, the positive terrain and negative terrain can be distinguished easily. The common edge of them was regarded as shoulder line candidate. But the existing vegetation points resulted in broken polygons in both two slopes. So interactive tools were used to eliminate broken polygons and the longest common edge was then extracted.
(IV) Estimate the accuracy of result. We estimate the accuracy by manual interpretation in 3D visualization environment. If the extracted line deviated too much from the real location, the filter grid size need adjustment and repeat step I-III until the shoulder line candidate matches its real location.
4. RESULT
4.1. Accuracy assessment
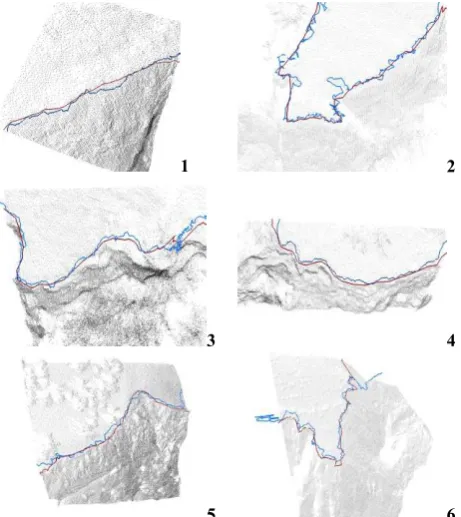
The optimal filter grid sizes of 6 sample areas were determined so that the most correct shoulder lines were extracted. Figure.5 shows shoulder line of each sample area (in 3D visualization environment). It was found that extracted shoulder lines using this method were coincident with manual digitalization results.
The International Archives of the Photogrammetry, Remote Sensing and Spatial Information Sciences, Volume XLI-B3, 2016 XXIII ISPRS Congress, 12–19 July 2016, Prague, Czech Republic
This contribution has been peer-reviewed.
1 2
3 4
5 6
Figure.5. Shoulder lines with original point clouds. Red line is manual digitalization result, and blue line is automatic extraction result using our method.
To evaluate quantitatively the accuracy of results, another assessment approach was used. A buffer with a certain radius around the manual digitalization results was generated firstly, and length of extraction result outside this buffer area (Lb) was then computed. The proportion between Lb and the whole length is an indicator which illustrated deviation rate. The lower deviation rate means higher accuracy of shoulder line and vice versa. Table 1 shows the deviation rate of each automatic extraction result.
Sample area ID
0.5m radius of buffer 1m radius of buffer
1 0% 0%
2 8% 0%
3 30% 27%
4 0% 0%
5 24% 12%
6 47% 1%
Table 1. Deviation rate of each shoulder line with 0.5m and 1m buffer radius
4.2. Relation between filter grid size and point density
The extracted shoulder lines were various when using different filter grid sizes. If the grid size is oversize, the selected ground points have no enough ability to simulate land surface. Then the slope classification was vague, causing the extracted shoulder line was far away from its real location. Conversely, if the grid size is undersize, the result line contains too much detailed information and is easily influenced by the vegetation points around shoulder line. Therefore, grid size optimization is the key to realize shoulder line extraction automatically in this method.
Figure 6. The relation between filter grid size and point density
A hypothesis was proposed in experiments that grid size was related to point density of each area. The optimal filter grid size of each sample area was analysed with their density. The result shows that the optimal filter grid size varies in diverse sample area, and a power function relation (y = 141.82x-1.202) exists between filter grid size (y) and point density (x) (Figure 6).
Examination area ID
Filter grid size computed by function
Filter grid size obtained by trials
t1 0.13 0.12
t2 0.12 0.15
t3 0.56 0.5
t4 0.18 0.2
t5 0.07 0.1
Table 2. Optimal filter grid size of each examination area (unit: m)
To verify the function relation, 5 examination areas were used to compute the filter grid size according to their point density. At the same time, in order to compare with it, a number of trials were conducted in each examination area to find optimal grid size. The result shows that the function can be used to determine optimal filter grid size of examination area (Table.2). This will help to extract shoulder line automatically in whole area.
4.3. The shoulder line extraction of whole area.
Due to the massive point cloud, the whole area was divided into 60 blocks by area. The optimal filter grid size was determined by using above function and shoulder line of each block was extracted and spliced into a complete shoulder line (Figure 7). It is worth nothing that the topological tolerance of two adjacent endpoints was less than 0.2 meter generally, which can be spliced by software automatically. Manual splicing was also supplement for final shoulder line generation.
Figure 7. Shoulder line of whole area
Compared with manual digitalization result, the deviation rate of the whole result is 15%, which shows the good performance and respectively high accuracy of proposed method. Meanwhile, there is a weakness that if shoulder line is inconspicuous in some parts of area, the result would contain more wrong details
The International Archives of the Photogrammetry, Remote Sensing and Spatial Information Sciences, Volume XLI-B3, 2016 XXIII ISPRS Congress, 12–19 July 2016, Prague, Czech Republic
This contribution has been peer-reviewed.
and should be revised manually.
5. CONCLUSION AND FUTURE DEVELOPMENT
This paper proposed a method to extract shoulder line based on point data. It was tested in loess hilly area and the result shows that the deviation rate of this method is only 15%, and contains even more details than manual digitalization result. This can be applied for removing “noise” points in the slope and high-precision surface modelling.
Another important discovery is that the filter grid size of sample area was related to point density in this area. 5 examination areas were used to verify the function, and the result shows that this function relation is universally. This can be helpful to extract shoulder line automatically. However, its applicability was still uncertain in other landforms.
An issue existing in this paper is low efficiency which needs to solve urgently. Parallel computing algorithm designing may be helpful for our method.
ACKNOWLEDGEMENT
We are grateful for the financial support from the National
Natural Science Foundation of China (Grant No.41271438). A Project Funded by the Priority Academic Program Development of Jiangsu Higher Education Institutions (No.164320H116).
REFERENCES
Axelsson. P., 1999. Processing of laser scanner data— algorithms and applications. ISPRS Journal of Photogrammetry and Remote Sensing, 54(2),pp. 138-147.
Barnea. S., S. Filin., 2013. Segmentation of terrestrial laser scanning data using geometry and image information. ISPRS Journal of Photogrammetry and Remote Sensing, 76,pp. 33-48.
Biosca. J. M., Lerma. J. L.,.2008. Unsupervised robust planar segmentation of terrestrial laser scanner point clouds based on fuzzy clustering methods. ISPRS Journal of Photogrammetry and Remote Sensing, 63(1),pp. 84-98.
Bitelli, G., Dubbini. M., Zanutta. A., 2004. Terrestrial laser scanning and digital photogrammetry techniques to monitor landslide bodies. International Archives of Photogrammetry, Remote Sensing and Spatial Information Sciences, 35(Part B 5),pp. 246-251.
Bleyer. M., Gelautz. M., 2004. A layered stereo algorithm using image segmentation and global visibility constraints. Image Processing, 2004. ICIP'04. 2004 International Conference on, IEEE.
Bornaz. L., Rinaudo.F., 2004, Terrestrial laser scanner data processing. XXth ISPRS Congress Istanbul.
Ding. Y., Ping. X,. Hu. M., 2005, Range image segmentation based on randomized hough transform. Pattern Recognition Letters, 26(13),pp. 2033-2041. (In Chinese)
Filin. S., Pfeifer. N., 2006, Segmentation of airborne laser scanning data using a slope adaptive neighborhood. ISPRS Journal of Photogrammetry and Remote Sensing, 60(2),pp. 71-80.
Jin. S., Yang. H., Wang. L., 2013, Research on Slope Filtering of Point Cloud Data Based on Gridding LIDAR. GEOMATICS & SPATIAL INFORMATION TECHNOLOGY, 36(6),pp. 154-156. (In Chinese)
Jutzi. B., Stilla. U., 2006. Range determination with waveform recording laser systems using a Wiener Filter. ISPRS Journal of Photogrammetry and Remote Sensing, 61(2),pp. 95-107.
Kraus. K., Pfeifer. N., 1998, Determination of terrain models in wooded areas with airborne laser scanner data. ISPRS Journal of Photogrammetry and Remote Sensing, 53(4),pp. 193-203.
Li. Y., Wu. L., Liu. H., Zhang. J.,Liu. C., 2011, Double-Filtering Algorithm for Dense Point Cloud with Steep Slope.
Geography and Geo-Information Science, (01),pp. 7-10+11. (In Chinese)
Lu. G., Qian. Y., Zhen. Z., 1998, Study on Automated Extraction of Shoulder Line of Valley from Grid Digital Elevation Data. Scientia Geographica Sinica, (06),pp. 567-573. (In Chinese)
Luo. L., 1956, A Tentative Classification of Landforms in the Loess Plateau. ACTA GEOGRAPHICA SINICA, (03),pp. 201-222. (In Chinese)
Ma. D., Li. B., 2013, Vegetation Filtering in Gully Region of Loess Plateau Based on Laser Scanning Point Cloud's Intensity Attenuation Model and Its Terrain Construct. Transactions of the Chinese Society of Agricultural Engineering, (15),pp. 162-171+301. (In Chinese)
Pirotti, F., Guarnieri. A., Vettore. A., 2013, Ground filtering and vegetation mapping using multi-return terrestrial laser scanning. ISPRS Journal of Photogrammetry and Remote Sensing, 76,pp. 56-63.
Staiger. R., 2003, Terrestrial laser scanner technology, systems and applications. 2nd FIG Regional Conference Marrakech. 1. Morocco.
Tang. G., Song. J., 2006, Comparision of Slope Classification Methods in Slope Mapping from DEMs. Journal of Soil and Water Conservation, (02),pp. 157-160+192. (In Chinese)
Xiao. C., Tang. G., 2007, Classification of Valley Shoulder Line in Loess Relief. Arid Land Geography, (05),pp.: 646-653. (In Chinese)
Yan, S., Tang. G., Li. F., Zhang. L., 2014, Snake model for the extraction of loess shoulder-line from DEMs. Journal of Mountain Science, 11(6),pp. 1552-1559.
Zhang. J., 2014, Interpolation of Point Clouds Data Based on Kriging Interpolation, Chang'an University. (In Chinese)
Zhang. L., Tang. G., Li. F., Xiong. L., 2012, A Review on Research of Loess Shoulder-Line. Geography and Geo-Information Science, (06),pp. 44-48. (In Chinese)
Zhou. Y., Tang. G., Yang. X., Xiao. C., Zhang. Y., Luo. M., 2010. Positive and negative terrains on northern Shaanxi Loess Plateau. Journal of Geographical Sciences, 20(1),pp. 64-76.
The International Archives of the Photogrammetry, Remote Sensing and Spatial Information Sciences, Volume XLI-B3, 2016 XXIII ISPRS Congress, 12–19 July 2016, Prague, Czech Republic
This contribution has been peer-reviewed.