THE NEW HYPERSPECTRAL SENSOR DESIS ON THE MULTI-PAYLOAD
PLATFORM MUSES INSTALLED ON THE ISS
R. Müller a, J. Avbelj a, E. Carmona a, A. Eckardt d, B. Gerasch a, L. Graham c, B. Günther d, U. Heiden a, J. Ickes b, G. Kerr a, U. Knodt e, D. Krutz d, H. Krawczyk a, A. Makarau a, R. Miller b, R. Perkins b, I. Walter d
a
German Aerospace Center (DLR), Earth Observation Center (EOC), D-82234 Wessling, Germany – [email protected] b
Teledyne Brown Engineering, 300 Sparkman Drive NW Huntsville, AL 35805, USA – [email protected] c
GeoCue LLC, 9668 Madison Blvd., Suite 202, Madison, AL 35758, USA – [email protected] d
German Aerospace Center (DLR), Optical Sensor Systems (OS), Rutherfordstraße 2, 12489 Berlin, Germany – [email protected] e German Aerospace Center (DLR), Strategie und Vernetzungen, Linder Höhe, 51147 Köln, Germany – [email protected]
Commission I, WG I/5
KEY WORDS: hyperspectral, multi-user platform, ISS, geometric correction, atmospheric correction
ABSTRACT:
The new hyperspectral instrument DLR Earth Sensing Imaging Spectrometer (DESIS) will be developed and integrated in the Multi-User-System for Earth Sensing (MUSES) platform installed on the International Space Station (ISS). The DESIS instrument will be launched to the ISS mid of 2017 and robotically installed in one of the four slots of the MUSES platform. After a four month commissioning phase the operational phase will last at least until 2020. The MUSES / DESIS system will be commanded and operated by the publically traded company TBE (Teledyne Brown Engineering), which initiated the whole program. TBE provides the MUSES platform and the German Aerospace Center (DLR) develops the instrument DESIS and establishes a Ground Segment for processing, archiving, delivering and calibration of the image data mainly used for scientific and humanitarian applications. Well calibrated and harmonized products will be generated together with the Ground Segment established at Teledyne. The article describes the Space Segment consisting of the MUSES platform and the instrument DESIS as well as the activities at the two (synchronized) Ground Segments consisting of the processing methods, product generation, data calibration and product validation. Finally comments to the data policy are given.
.
1. INTRODUCTION
Imaging spectroscopy or hyperspectral remote sensing is based on the characterization of Earth’s surface materials and processes through spectral measurements of the light interacting with matter. The potential of spaceborne imaging spectrometers has long been exploited to monitor the Earth’s surface and atmosphere and to provide valuable information for the better understanding of a large number of environmental processes. Currently the availability of spaceborne imaging spectroscopy data is quite poor (Guanter 2015).
Teledyne Brown Engineering (TBE) located in Huntsville, Alabama, USA and the German Aerospace Center (DLR), Germany will develop and operate a hyperspectral instrument integrated in the Multi-User-System for Earth Sensing (MUSES) platform installed on the International Space Station (ISS). The DLR Earth Sensing Imaging Spectrometer (DESIS) instrument will be launched to the ISS mid of 2017 with a four month commissioning phase followed by an operational phase at least until 2020. The instrument DESIS is developed by DLR and delivered to TBE for integration into MUSES. TBE operates, commands and monitors DESIS with its own Ground Segment including processing, calibration, monitoring, validation and data dissemination. DLR and TBE will benefit from establishing and cooperating on the implementation of the program. TBE is licensed by the “National Oceanic and Atmospheric Administration” (NOAA) to operate the MUSES platform with the DESIS instrument. TBE will license the Instrument Data for scientific and humanitarian use only (these are image data and auxiliary data of the MUSES Platform like inertial measurements, Star Tracker attitude measurements, orbit data, calibration and instrument housekeeping data
relevant to the processing of the image data) to DLR. Scientific use includes
• basic and application oriented research
• projects by national and international educational or research institutions or by governmental institutions • development and demonstration of future applications for
scientific and/or operational use
• preparation and execution of government-funded education, research and development programs
TBE will operate the MUSES / DESIS space system, which includes image tasking, data archiving, product dissemination and monitoring. In close cooperation between TBE and DLR calibration data will be shared and consistent products generated.
2. THE MULTI USER PALTFORM MUSES
Hz) and a Miniature Inertial Measurement Unit (sampling rate 50 Hz) providing a 10 Hz attitude measurement after filtering. ISS GPS data provide position and velocity vectors and time tags (sampling rate 1 Hz) serving as a master time for the MUSES instruments with an accuracy of ±250 µs. The predicted viewing capability of MUSES, when operating at the ISS orbit inclination of 51.6°, will enable the DESIS instrument to scan about 90% of the populated Earth with a 3-5 day average cadence. The daily download capacity is 225 GBit. The launch of MUSES is planned for Q1, 2017 via SpaceX-11.
Figure 1 MUSES platform with the four slots for different instruments. The hyperspectral sensor DESIS will be integrated in one of the large slots. (© Teledyne Brown Engineering. All rights reserved.)
3. THE HYPERSPECTRAL SENSOR DESIS
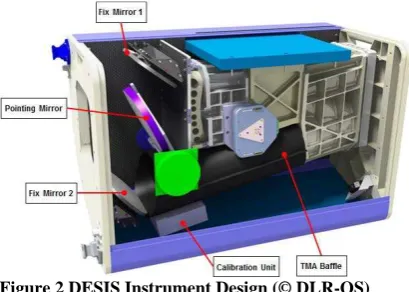
The DESIS hyperspectral instrument (see Figure 2 for the main components) is realized as a pushbroom imaging spectrometer spectrally sensitive over the Visible Near Infrared (VNIR) range from 400 to 1000 nm with a minimum spectral sampling distance of 2.55 nm employing a 2-dimensional back illuminate Complementary Metal Oxide Semiconductor (CMOS) detector array from BAE (CIS2001).
Figure 2 DESIS Instrument Design (© DLR-OS)
An on-board programmable binning up to a factor of four is possible with the positive side effect of a reduced download data volume. The Signal-to-Noise Ratio (SNR) for the maximum and minimum spectral sampling distances is shown in Figure 3. The across direction of the array is used for the spatial resolution and the along direction for the spectral resolution (channels). The optical design is based on the Offner-type grating spectrometer widely used in hyperspectral imaging. The Ground Sampling Distance (GSD) at nadir view depends on the flight altitude of the ISS and is about 30 m at the reference altitude of 400 km resulting in a swath width of about 30 km. The electronic shutter mechanism is realized as a rolling shutter, in which each channel collects light during the same
period of time, but the time light collection starts and ends is slightly different for each channel resulting that spectral pixels integrate different surface areas. The read out sequence of the channels starts with the first (lowest wavelength) and last channel (highest wavelength), and ends in the middle of the spectral range, which cumulates the largest time delay according to one pixel size. The rolling shutter mode compared to the global shutter mode allows higher frame rates.
Figure 3 Signal-to-Noise Ratio (SNR) for the spectral sampling of 2.55 nm (lower curve) and the 4x binning with 10.21 nm spectral sampling (upper curve). Simulation based on Modtran with standard mid latitude summer atmosphere (Albedo: 0.3; Sampling 0.2 nm). (© DLR Optical Systems)
DESIS is equipped with a POI consisting of two fixed and one rotating mirror in front of the entrance slit that allows, by rotating one mirror, a forward and backward viewing change up to ±15° w.r.t. the nominal (e.g. nadir) view. The POI can be operated in a static mode with 3° angle steps for the viewing direction and in a dynamic mode with up to 1.5° change in viewing direction per seconds. This change in viewing direction allows – besides normal Earth data takes – acquiring experimental data to produce e.g. stereo or Bidirectional Reflectance Distribution Function (BRDF) products and continuous observations of the same targets on ground (FMC forward motion compensation). The POI can be also operated in calibration mode to minimize the external light fields and allowing on-board calibration measurements.
The DESIS instrument specifications are given in Table 1.
Instrument Design Parameters
Telescope F# / Focal Length
3 / 320 mm, telecentric
FOV 4.4°
IFOV 0.004°
GSD @ Nadir 30 m @ 400 km (reference height)
Swath @ Nadir ~30 km @ 400 km flight altitude
Spectral Range 400 – 1000 nm
Spectral Sampling 2.55 nm for 235 bands
Programmable binning on-orbit (up to 4x)
Spectral Channels 235 @ no binning
117 @ 2 band binning 78 @ 3 band binning
Instrument Design Parameters
SNR @ 550 nm 205 sampled at 2.55 nm
406 binned to 10.21 nm
Quantization 12 bits (plus one gain bit)
Spatial Pixels 1024
Radiometric Linearity > 95% (10%-90% FWC)
MTF @ Nyquist (no
FPA size 1056 (spatial) x 256 (spectral) pixel
Max. Frame rate 232 Hz (RS)
Pixel Quantization 12 bit plus 1 bit for low and high gain setting
Pointing Unit BRDF mode: 11 measurement positions
±15° ( every 3°) with 20 arcmin accuracy FMC mode: Rotation speed 0,6°/sec and 1,5°/sec with 0.06° accuracy
Table 1 DESIS Instrument Specifications
Besides a pre-flight spectral, radiometric and geometric calibration and characterisation of the instrument in laboratory, the instrument contains an on-board calibration unit comprising different monochromatic and white light LEDs between 400 and 1000 nm. The calibration unit is located close to the POI mirror in front of the DESIS instrument, and allows the illumination of the full spectrometer FOV with color and white light. The calibration unit is characterised in laboratory and temperature controlled in orbit within 1 K.
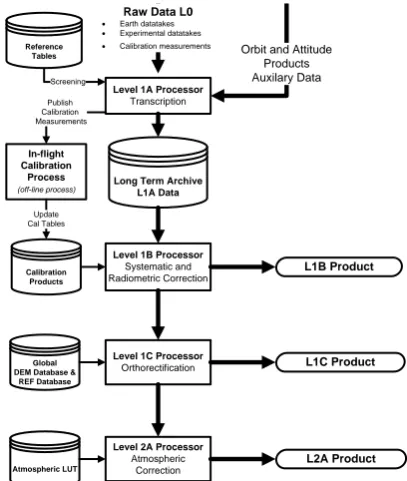
4. THE PROCESSING SYSTEM AND PRODUCTS
The DESIS products are derived from tiled data takes of size 1024x1024 pixels (~30x30 km²), which are generated within an automatic processing chain. Identical processing chains are implemented at DLR and TBE Ground Segment. At TBE the processors are running in a cloud based system (© Amazon Cloud). Following the definitions of the European Space Agency ESA the DESIS products are specified as given in Table 2
Product Level 0 (L0) – internal product
Raw data after restoration of the chronological data sequence for the instrument(s) operating in observation mode, at full space/time resolution with all supplementary information to be used in subsequent processing (e.g. orbital data, health, time conversion, etc.) appended. Level 0 data are time-tagged. The precision and accuracy of the time-tag shall be such that the measurement data may be localized to accuracy compatible with the user’s requirements.
Product Level 1A (L1A) – internal product; archive Level 0 data with corresponding radiometric, spectral and geometric (i.e. Earth location) correction and calibration computed and appended, but not applied.
Product Level 1B (L1B) – deliverable
Level 1A data not re-sampled, quality-controlled and radiometrically calibrated, spectrally characterised, geometrically characterised, annotated with satellite position and pointing, landmarks and preliminary pixel classification (e.g. land/water/cloud mask). The Level 1b product consists of
Top of Atmosphere (TOA) radiance (W.m-2.sr-1.μ m-1).
Product Level 1C (L1C) - deliverable
Level 1b data orthorectified, re-sampled to a specified grid. Image sampling shall be performed using a selectable re-sampling method including at least bi-cubic convolution interpolation and nearest neighbour.
Product Level 2A (L2A) - deliverable
Earth located pixel values converted to ground surface reflectance, i.e. after atmospheric corrections.
Table 2 DESIS Product Definitions
DESIS level 1A products – namely Earth image scenes, on-board calibration measurements, dark current measurements and experimental products - will be long-term archived together with the corresponding metadata, while level 1B products (systematically and radiometrically corrected data), level 1C products (geometrically corrected data), level 2A products (atmospherically corrected data) will be processed on demand and delivered to the user community (see Figure 4 for the DESIS processing chain and the products).
Figure 4 Processing chain and product generation
4.1 Transcription Processor (L1A)
The Level 1A Processor collects information from the different data streams, extracts and interprets the information, and evaluates and derives additional information for long term storage. The functionality of the Level 1A Processor comprises the following tasks.
• Screening of the data includes the inspection (comparison to reference tables) of all status information, temperatures, currents and voltages, which are available in the virtual channel (VC) of the DESIS instrument data.
• Extraction and evaluation of Dark Current (DC) measurements before and after each datatake with 128 frames each. Mean and standard deviations of the DC frames are compared to reference values.
• Preparation of Earth data takes, which includes tiling of the data take (1024x1024 spatial pixels), annotating metadata for further processing and quicklook generation.
• Processing of calibration data takes and publishing to the off-line calibration process, which derives new calibration tables.
4.2 Systematic and Radiometric Conversion Processor (L1B)
The L1B processor corrects the data for systematic effects and converts them to physical at-sensor radiance or TOA values based on the calibration tables valid for the specific time period. The correction includes the following tasks
• Dead pixel flagging
• Dark signal correction using linear interpolated dark signal values derived from the dark signal measurements before and after each datatake
• Non-linearity response correction using the valid calibration tables (see section 5.2)
• Spectral referencing using the spectral calibration database (see section 5.3)
• Radiometric referencing using the valid radiometric calibration table (see section 5.1)
• Generation of data quality indicators like abnormal pixel masks, band-to-band correlations, bad line and bad column mask.
• Radiometric conversion towards at-sensor radiance values Output products are the TOA radiance data cubes, quality layers and metadata (e.g. orbit and attitude measurements, geometric calibration values, spectral channel information). The L1B product comprises all information for further processing.
4.3 Orthorectification Processor (L1C)
Orthorectification is the process to generate map conform products by removing geometric distortions caused by the sensor internal geometry, the satellite motion during data acquisition and the terrain related influences. The DESIS L1C processor produces orthoimages employing the technique of the rigorous model of Direct Georeferencing (DG) (Müller 2012). The Line-of-Sight model (LoS) forms the basis of DG and is derived from the collinearity equation. LoS in this context means the view direction of each pixel at any instance of time. The sensor internal geometry of the hyperspectral image will be extensively characterized in the laboratory by highly accurate measurements of the direction angles of single illuminated pixels (gravity center of the pixel) to the (adjusted) collimator axis. For each pixel the two angles on object side completely describe the internal camera geometry. This also includes (possible) geometric keystone effects. The mounting angles with respect to the attitude measurement system (body coordinate frame) are refined in the commissioning phase by geometric calibration procedures due to the gravity release and temperature influence. The star tracker measurements are combined by Kalman filtering with the angular measurements of the inertial measurement unit. These (unit) quaternions are finally transformed from the Earth Centered Inertial frame (ECI) to the Earth Centered Rotated frame (ECR). A GPS provides the satellite position (and velocity) with a rate of 1 Hz. The attitude and position measurements are interpolated (e.g. Lagrange interpolation) for each scan line of the image. Within an iterative process the intersection points of the LoS vectors for each pixel and the Digital Elevation Model (DEM) is determined and leads to 3D points in object space.
The object points of the grid are expressed in an Earth bound Cartesian coordinate frame and are transformed to a user
selectable map projection system (e.g. UTM with the zone derived from the center coordinates of scene as well as the neighbouring zones, geographic projection). Within the map projection system image resampling is performed towards 30 m pixel spacing in case of UTM and 1 arcsec in case of Geographic projection. Different selectable resampling methods (e.g. nearest neighbour, bi-linear, cubic convolution) to generate the final orthorectified products are offered to the customer. The geometric accuracy of the orthorectification is crucial for overlaying the data with existing data sets, maps, or in geographic information systems (GIS) and using them for evaluations like change detection, map updating, and others like enhanced atmospheric correction using terrain information (see chapter of Atmospheric Correction Processor). Therefore, an improvement of the LoS model shall be achieved by ground control points (GCP), which are extracted automatically from reference images of superior geometric quality using image matching techniques. As a global reference image database the Landsat-8 panchromatic images with an absolute geometric accuracy of 12 m circular error at 90% confidence level and 14 m ground resolution is foreseen (USGS 2016).
In a first step, tie points between the uncorrected image and the reference image are determined by intensity based matching (Müller 2012). Supplementing the height values, interpolated from the DEM, to the found tie points a set of full qualified GCP are derived. In a second step, the GCP sets serve as input to improve the LoS model parameters within a least squares adjustment process. GCP outlier detection is included in the matching processes itself as well as in the least squares adjustment.
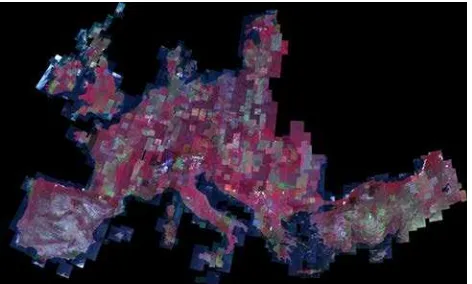
The feasibility of the approach to extract GCP from reference images for a refinement of the DG model within an operational environment has been successfully demonstrated at different projects. For example the production of two European coverages by orthorectification of SPOTS 4 HRVIR, Spot 5 HRG and IRSP-6 LISS III scenes. Figure 5 shows the mosaic of the orthorectified scenes covering main parts of Europe. A relative geometric accuracy of 10 m RMSE w.r.t. the reference images has been achieved. About 450 GCP per 1000 km² (~size of one DESIS scene) have been extracted automatically.
Figure 5 Example of orthorectified products derived from Spot 4 HRVIR, Spot 5 HRG and IRS-P6 Liss III data using automatically extracted GCP information from reference images for sensor model refinement. The overall geometric accuracy w.r.t. the reference is ~10m RMSE linear.
4.4 Atmospheric Correction Processor (L2A)
Input for the atmospheric correction processor is the L1C product. For the atmospheric correction over land a combined atmospheric and topographic processing is possible, provided the geometric absolute accuracy of the DESIS orthoimage is sufficient. A geometric accuracy better than one pixel size is required for this combined topographic / atmospheric correction in order to avoid artefacts caused by the inaccurate co-registered DEM and orthorectified image.
The MODTRAN-5.3.3 (moderate resolution atmospheric transmission) code is employed to model properties of the solar reflective spectrum (from 400 to 2500 nm). It supports a sufficiently high accuracy for the absorption simulation (water vapour, ozone, oxygen, carbon dioxide etc.). It also includes a rigorous treatment of the coupled scattering and absorption processes. Moreover, it offers a set of representative aerosol models (rural or continental, urban, maritime, desert). Therefore, MODTRAN-5.3.3 is selected to compile a database of atmospheric correction look-up tables (LUT) with a high spectral resolution of 0.4 nm to enable the processing of the 2.55 nm (binned 10.21 nm) channel bandwidths of DESIS. This “monochromatic” or fine spectral resolution database has to be resampled with the DESIS channel filter curves. The advantage of compiling a “monochromatic” database is twofold. First it gives the possibility of quickly resampling it with updated spectral channel filter functions avoiding the necessity to run time-consuming radiative transfer calculations for the solar and view geometry pertaining to the acquired scenes and second to account for spectral smile corrections.
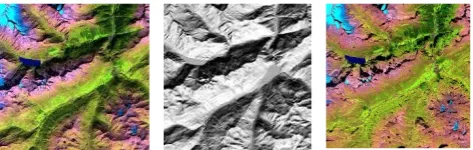
The atmospheric correction accounts for flat and rugged terrain (see Figure 6), and includes haze/cirrus detection algorithms.
Figure 6 Example of topographic correction. Left image: without topographic correction; Middle: slope image derived from a DEM; Right: with topographic correction. (Example Spot-5 scene from Switzerland)
Output products will be the ground reflectance cube, maps of the aerosol optical thickness and atmospheric water vapour, and masks of land, water, haze, cloud, shadow and snow (Makarau 2014a, Makarau 2014b)
5. INFLIGHT SPECTRAL, RADIOMETRIC AND
GEOMETRIC CALIBRATION
Inflight calibration refers to all measurements and data analyses aiming to assess radiometric, spectrometric and geometric characteristics of the DESIS hyperspectral instruments in orbit. DESIS will undergo extensive characterization and calibration measurements before launch and will be re-calibrated after launch by updating the calibration tables (Hollstein 2015). The DESIS calibration unit (see Figure 7 for the layout and Figure 2 for the location of the calibration unit) consists of a number of different monochromatic and white LEDs with wavelengths between 400 and 1000 nm. The shape of the emitted light beam of the calibration unit allows monochromatic and spectrally broad-band illumination within the full spectrometer FOV. Pre-defined combinations of LED’s will be operated at the same time to simulate different illumination scenarios. The unit will be positioned in the spectrometer optical beam by the corresponding position of the pointing unit
mirror. The switched-off calibration unit serves as dark reference.
Figure 7 Principal design of the DESIS Calibration Unit, which shows three lines with each eight monochromatic LED's and one white LED (© DLR-OS)
5.1 On-board Radiometric Calibration
The DESIS instrument will be radiometrically calibrated (represented by the initial calibration values �0 for each pixel on the focal plane) in laboratory before launch to establish the relation between the recorded digital numbers (DN), resulting from the analogue-digital conversion of the initially measured electrophysical parameters (charge, voltage, current), to radiometric values, i.e. spectral radiances. Based on these measurements the calibration unit is radiometrically characterised, which is assumed to be stable over time. Assuming further a linear relation (see also section 5.2) between incoming light and recorded digital number the calibration table updates (�) are performed by
�= �0��
�������− ������,������� �� − ������
with (�� − ������) the current on-board calibration measurements and (���������− ������,�������) the previous
calibration measurements using the light field of the LED.
5.2 Radiometric Non-Linearity
For the correction of radiometric non-linearity of the individual pixels measurements are performed with the on-board calibration unit. Because the incoming radiance is proportional to the sensor integration time the correction table δDN for the measured DN values is determined at different integration times (e.g. 10-100 sample points over the dynamic range).
5.3 On-board Spectral Calibration
On-board spectral calibration is the task to adjust the pre-launch determined assignments of the focal plane pixels to their (center) wavelengths. The current baseline is to use the nearly monochromatic LED’s at eight different wavelengths between 400 nm and 1000 nm. Wavelength shifts are derived from the evaluation of averaged monochromatic measurements of the illumination with the coloured LED’s.
5.4 In-flight Geometric Calibration
image matching failed, are expected to need a highly accurate sensor model (see section 4.3).
6. INSTRUMENT MONITORING
In contrary to the instrument calibration, the monitoring of the DESIS instrument analyses the long-term behaviour of the calibration values and the (health) status information from the housekeeping data. The major outcomes of instrument monitoring are trend and statistical analyses to document the instrument stability and accuracy over the lifetime and detection of malfunctions. The following monitoring tasks are performed • Dark values, mainly w.r.t. the temperature at the focal plane • Radiometric characteristics, mainly w.r.t. radiometric
stability
• Spectral characteristics, mainly w.r.t. spectral stability • Linearity, mainly w.r.t. temporal stability
• Instrument status, mainly temperatures, currents and voltages
• Signal-to-Noise Ratio
• Dead and suspicious pixel map monitoring
7. VALIDATION AND QUALITY CONTROL
Validation is the process of assessing, by independent means, the quality of data products as defined by the Committee of Earth Observation Satellites (CEOS). Besides an online data quality evaluation by means of generic quality indicators (e.g. band-to-band correlations or analysis for striping and banding) three vicarious validation approaches are currently planned by DLR (some further collaborations being under discussion). • Validation over well-known Calibration Sites like CEOS
Landnet sites or CEOS Pseudo-Invariant-Calibrations-Sites, which allows an absolute assessment and comparison with existing sensor systems.
• Cross-Comparison, where simultaneous data acquisitions of DESIS and a reference sensor (e.g. airborne survey along with ground truth data) are used to compare simulated TOA from the reference data with the derived DESIS products. • Local homogenous sites, which allows relative assessments
of e.g. SNR Ratio or Modulation Transfer Function (MTF).
Additionally in-flight geometric validation periodically assesses the possible changes of geometric parameters during satellite life time for the available L1C Earth Products. The geometric validation is carried out by automatic image matching methods using L1C Earth Products and orthoimages from flat and mountainous areas of superior quality (e.g. better than 10 m absolute accuracy).
8. PRODUCT FORMATS
L1B/L1C/L2A data products are generated by the corresponding processor(s) that, under request, are delivered to the user. The products are derived from the long-term archived L1A Earth internal product by subsequently calling the processors within the chain. The requested data product is delivered to the user as a single zip file. The zip file contains the product components in the form of individual files accessible by the user after unzipping the product file. For each tile within an Earth datatake a L1B, L1C or L2A product file is generated at the processing level requested by the user.
Besides the hyperspectral image (one tile) provided as a Geotiff file the product contains
• Metadata in xml format with
• General information like acquisition time, bounding polygon, sun-target-sensor geometry, spectral band referencing, …
• Information on processing parameters like resampling mode, ozone column,…
• Quality information like data screening results, instrument configuration,…
• Information for further processing like position and attitude, calibration values,…
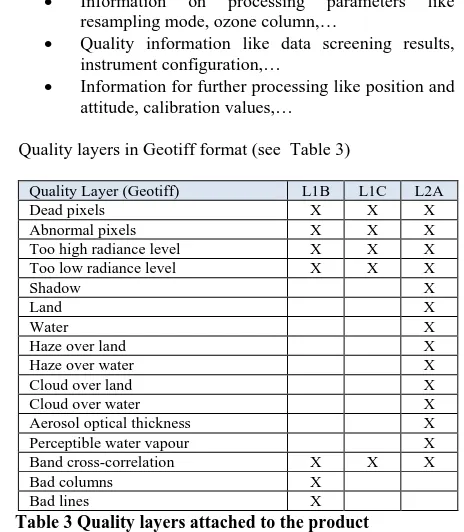
• Quality layers in Geotiff format (see Table 3)
Quality Layer (Geotiff) L1B L1C L2A
Dead pixels X X X
Abnormal pixels X X X
Too high radiance level X X X
Too low radiance level X X X
Shadow X
Land X
Water X
Haze over land X
Haze over water X
Cloud over land X
Cloud over water X
Aerosol optical thickness X
Perceptible water vapour X
Band cross-correlation X X X
Bad columns X
Bad lines X
Table 3 Quality layers attached to the product
9. DATA POLICY
The DESIS instrument will be operated by Teledyne and only Teledyne will receive the raw data from the ISS. Teledyne has the exclusive right to license or transfer image data for commercial use. For scientific and humanitarian purposes, DLR has the right to task DESIS or request data from the archive (see Figure 8). In these cases and if no conflicts with the commercial activities appear, Teledyne will hand over the data to DLR. Therefore, Teledyne provides DLR a license to the instrument data DLR receives for scientific and humanitarian use. The parties will attempt to schedule DLR’s tasking requests so that tasking is generally balanced throughout the calendar year. For scientific purposes only, DLR can share DESIS scientific data with other scientific organizations. Any commercial use of these instrument data is prohibited without Teledyne’s prior written permission. All end users of the instrument data provided to DLR for scientific use will be required to enter into a data license agreement among DLR and Teledyne acknowledging the limited use license.
REFERENCES
Guanter, L., Kaufmann, H., Segl, K., Förster, S., Rogass, C., Chabrillat, S., Küster, T., Hollstein, A., Rossner, G., Chlebek, C., Straif, C., Fischer, S., Schrader, S., Storch, T., Heiden, U., Müller, A., Bachmann, M., Mühle, H., Müller, R., Habermeyer, M., Ohndorf, A., Hill, J., Buddenbaum, H., Hostert, P., van der Linden, S., Leitao, Pedro J., Rabe, A., Doerffer, R., Krasemann, H., Xi, H., Mauser, W., Hank, T., Locherer, M., Rast, M., Staenz, K., Sang, B. (2015) The EnMAP Spaceborne Imaging Spectroscopy Mission for Earth Observation. Remote Sensing (7), Seiten 8830-8857. MDPI. DOI: 10.3390/rs70708830. ISSN 2072-4292.
Hollstein, A., Rogass, C., Segl, K., Guanter, L., Bachmann, M., Storch, T., Müller, R., Krawczyk, H.; (2015) EnMAP Radiometric Inflight Calibration, Post-Launch Product Validation, and Instrument Characterization Activities. In: IEEE International Geoscience and Remote Sensing Symposium (IGARSS) 2015, Seiten 1-4. IEEE Xplore. IGARSS 2015, 26.-31. Jul. 2015, Milano, Italy.
Makarau, A., Richter, R., Müller, R., Reinartz, P. (2014a) Haze detection and removal in remotely sensed multispectral imagery. IEEE Transactions on Geoscience and Remote Sensing, 52 (9), Seiten 5895-5905. IEEE Xplore. DOI: 10.1109/TGRS.2013.2293662. ISSN 0196-2892.
Makarau, A., Richter, R., Müller, R., Reinartz, P. (2014b) Spectrally consistent haze removal in multispectral data. In: Image and Signal Processing for Remote Sensing XX, 9244, Seiten 1-7. SPIE. SPIE Remote sensing Europe, 22-25 September 2014, Amsterdam, Netherlands. ISBN 9781628413076.
Müller, R., Krauß, T., Schneider, M., Reinartz, P. (2012) Automated Georeferencing of Optical Satellite Data with Integrated Sensor Model Improvement. Photogrammetric Engineering and Remote Sensing (PE&RS), 78 (1), Seiten 61-74. American Society for Photogrammetry and Remote Sensing. ISSN 0099-1112.
Richter, R., (1996) A spatially adaptive fast atmospheric correction algorithm. International Journal of Remote Sensing, 17(6), pp. 1201-1214
Richter, R. (2011) Atmospheric Correction Methods for Optical Remote Sensing Imagery of Land. In: Advances in Environmental Remote Sensing Remote Sensing Applications. Taylor & Francis, London. Seiten 161-172. ISBN 978-1-4200-9175-5.