IMPLEMENTATION AND EVALUATION OF A MOBILE MAPPING SYSTEM BASED
ON INTEGRATED RANGE AND INTENSITY IMAGES FOR TRAFFIC SIGNS
LOCALIZATION
M. Shahbazi a, M. Sattari b, S. Homayouni c, M. Saadatseresht c,*
a
Department of Applied Geomatics, Université de Sherbrooke, 2500 Boulevard de l'Université, Sherbrooke, Québec,
Canada - mozhdeh.shahbazi@usherbrooke.ca
b
Department of Geomatics Engineering, University of Isfahan, HezarJerib Street, Isfahan, Iran - sattari@eng.ui.ac.ir
cDepartment of Geomatics Engineering, University of Tehran, North Amriabad Street, Tehran, Iran - (homayounis,
msaadat)@ut.ac.ir
Commission V, ICWG V/I
KEY WORDS: Digital, Mobile, Mapping, Automation, Integration, Recognition, Detection, GPS/INS
ABSTRACT:
Recent advances in positioning techniques have made it possible to develop Mobile Mapping Systems (MMS) for detection and 3D localization of various objects from a moving platform. On the other hand, automatic traffic sign recognition from an equipped mobile platform has recently been a challenging issue for both intelligent transportation and municipal database collection. However, there are several inevitable problems coherent to all the recognition methods completely relying on passive chromatic or grayscale images. This paper presents the implementation and evaluation of an operational MMS. Being distinct from the others, the developed MMS comprises one range camera based on Photonic Mixer Device (PMD) technology and one standard 2D digital camera. The system benefits from certain algorithms to detect, recognize and localize the traffic signs by fusing the shape, color and object information from both range and intensity images. As the calibrating stage, a self-calibration method based on integrated bundle adjustment via joint setup with the digital camera is applied in this study for PMD camera calibration. As the result, an improvement of 83% in RMS of range error and 72% in RMS of coordinates residuals for PMD camera, over that achieved with basic calibration is realized in independent accuracy assessments. Furthermore, conventional photogrammetric techniques based on controlled network adjustment are utilized for platform calibration. Likewise, the well-known Extended Kalman Filtering (EKF) is applied to integrate the navigation sensors, namely GPS and INS. The overall acquisition system along with the proposed techniques leads to 90% true positive recognition and the average of 12 centimetres 3D positioning accuracy.
* Corresponding author. This is useful to know for communication with the appropriate person in cases with more than one author. 1. INTRODUCTION
MMS integrates imaging (mapping) sensors and the navigation ones in order to provide the geo-spatial data of remotely sensed points from a mobile platform. While updating the spatial information system databases is a time and cost consuming process with respect to the traditional surveying techniques, MMS provides the capability of data acquisition in a faster, cheaper and more qualified manner (Laurent et al., 2010). Automatic traffic sign recognition from an equipped mobile platform has been a challenging issue for many. Having unique properties, road signs are distinguishable from other road objects. These distinctions comprise specific color format and signature pattern, shape and size, reflective surface, priority of being visible to drivers and limited height. There are several inevitable problems coherent to most of the recognition methods. Improper appearance of a sign in video due to poor illumination, sun position, surface reflectance, color fading, disorientation form ideal position and motion blur are among them (Shahbazi et al., 2011b). On the other side, there are conventional issues associated with the positioning problem, utilizing two or more digital cameras or/and the laser scanners. As a proposed solution to these problems, this study overviews the implementation and evaluation of an operational MMS for detection, recognition and 3D localization of traffic signs. This
project has been performed under the collaboration of the University of Tehran and the University of Isfahan.
The main characteristic of this system is the combination of its mapping sensors. Unlike other systems, which use Laser scanners or/and multiple digital cameras, the developed MMS comprises one range camera based on Photonic Mixer Device (PMD) technology and one standard 2D digital camera. In recent years, Time-of-Flight (ToF) devices, based on Photonic Mixer Device (PMD) technology, are becoming increasingly popular solutions in 3D imaging applications (Van den Bergh et al., 2011). Known as range cameras, this new generation of active devices can capture range, amplitude and intensity images simultaneously with one array sensor at video rates. They have several advantages in comparison with traditional 3D data acquisition systems such as laser scanners or stereo cameras. First, no scanning mechanism is required, and only one sensor is needed to capture 3D data without getting involved in different stereo analysis problems. In addition, rapid imaging provides the possibility of real time mapping and localization (Shahbazi et al., 2011a). Since the main application of the developed MMS is to automatically localize the traffic signs, the PMD images make this process more practical. The reflectivity of signs surfaces along with background suppression ability and active sensing of the PMD camera make the signs sharply visible in its intensity images. Besides the image
descriptors, utilizing the object-based information provides more robust and reliable detection and recognition. The overall proposed system overcomes the conventional illumination, disorientation, scaling and partial occlusion issues in the process. The signs 3D coordinates are simply computed from a single PMD image.
The total structure of this paper is dedicated to briefly overview the operational process of implementing the data acquisition system, Section 2, and explaining the proposed algorithms for detection-recognition-localization (DRL) of traffic signs in Section 3. Afterwards, in Section 4, the experimental results are discussed and concluded thereafter in Section 5.
2. DATA ACQUISITION SYSTEM
2.1 The Overview
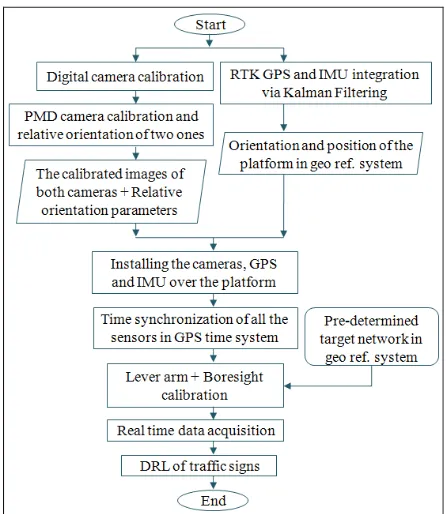
To summarize the implementation process of data acquisition system, three steps of calibration, synchronization and integration are applied, as indicated in the following diagram (Figure 1).
Figure 1. The overall implementation procedure of the MMS
2.2 Imaging Sensors Calibration
As implied before, a digital (Canon Power Shot SX1 IS) and a PMD range camera (PMD[vision]-O3) are included in this system.
Calibration of the digital camera in this study is performed by the conventional photogrammetric calibration method, a computational method whereby camera parameters are estimated in a bundle adjustment solution (Fraser, 1997). Range cameras based on PMD technology operate on the Time of Flight (ToF) concept to provide distance information. The PMD chip is based on CMOS technology, which also provides an automatic suppression of background light, allowing the device to be utilized outdoor as well as indoor (Moller, 2005). In addition to depth, two other values are calculated at each
pixel; signal strength of the received signal (amplitude) and the gray-scale value (intensity). Due to several systematic error sources, however, proper calibration of this camera is mandatory in order to perform reliable range sensing. To do so, the calibration method presented by the authors’ previous work (Shahbazi et al., 2011a) is applied. The algorithm is an integrated range camera self-calibration in combination with a digital camera. This method could overcome the problems inherent to the small FoV and low resolution of the range camera. It could also provide optimum estimates of the model parameters by incorporating the systematic errors and external parameters into the bundle adjustment based on weighted least squares criteria. Moreover, the relative orientation parameters of two cameras are determined at the same procedure. The readers are referred to (Shahbazi et al., 2011a) for the details. Briefly explaining, three observation correction equations are considered. Two equations present the lateral cameras systematic error model (Δx, Δy). They are applied to image coordinates of observations (x, y) for both digital and PMD camera, evidently with different parameter values:
2 4 2 2 electronic biases, namely affinity and shear.
The third equation is designed to model the systematic error (Δρ) associated with range observations (ρ) of PMD as follows: terms. Terms c4,c5 are the signal propagation delay also known as the clock-skew error terms. Variables R and C are row and column of the pixel. Finally, c6,c7,c8 are intensity related error terms and I is the gray scale value of pixel in intensity image of PMD camera.
2.3 Navigation and Direct Geo-referencing with GPS/INS
The navigation sensors include a GPS antenna (Leica GPS system 500) which performs accurate positioning in real time kinematic (RTK) mode and an inertial measurement unit (XSENSE MTI IMU).
The RTK GPS provides the high accurate differential positioning with carrier-phase differential GPS technique. The readers are addressed to (Seeber, 2003) for further information. The XSENSE MTI IMU is constructed of MEMS grade gyroscopes and accelerometers. The drift-free rotations of the IMU body-fixed system (b), with 0.05 degrees of angular resolution, in accordance to local magnetic system (m) are outputted. They are interiorly calibrated by means of gravimeters and 3D magnetometers. Besides, the 3D acceleration data is outputted via the accelerometers by 0.2 m/s2 accuracy.
Although double-integration of acceleration leads to high rate relative position data, the accumulating error increases rapidly by time. Therefore, the best way to provide high rate-high accurate position data would be to integrate the GPS and IMU position and velocity observations.
To operate such integration, the relation of IMU body fixed system (b) with the geo reference system (e), here WGS84, should be clarified. The first step to establish such equation is to determine the rotation matrix which parallels the local magnetic system to the geodetic one (n). The only difference between these two is the magnetic declination angle (D) between the magnetic north and true local azimuth. In this project, this value is derived from the World Magnetic Model. The rotation matrix
n m
R which is able to rotate a vector from magnetic to geodetic local system will be as:
cos sin 0
Secondly, the rotation matrixRnemust be designed to rotate the geodetic local system and parallel it with WGS84 reference system. It is technically determined by the geodetic latitude and longitude of the point (φ, λ):
sin cos sin cos cos
sin sin cos sin cos
cos 0 sin
Finally, the rotation matrix e b
R from body-fixed to geo reference system is defined:
R is the rotation matrix formed by Euler angles outputted by the IMU.
Afterwards, it is time to extract the pure acceleration due to movement ( e
aG ), in geo reference system, out of the total acceleration ( b
f
G
) measured by the accelerometers in body-fixed system:
gG is the earth gravitation vector at each point which is calculated by means of WGS84 ellipsoid gravity model and
earth
Ω is the skew symmetric matrix of earth rotation rate. The relative velocity and position in geo reference system WGS84 can now be numerically computed by integrating the kinematic acceleration over time.
According to mathematical characteristics of Kalman Filtering, it is introduced as an optimal option for improving the
functionality of inertial navigation systems specially while integrating with absolute positioning systems such as GPS (Grewal et al., 2007). Kalman Filtering is a two stage iterative process: prediction and correction.
At the prediction stage, the state vector of next moment, YJG−( )t ,
and its covariance matrix, P tJG−( ), are estimated by the state
vector in the previous moment, Y ( )t0
+
JG
, and its covariance
matrix, P t+( )0 .
In the above equation, T is the transaction matrix of state vector from t0 to t, and e is the transaction matrix of observations of the noisy sensor and Ce is their covariance matrix.
When the observations of the other sensor, L, come up, the correction is applied to the state vector. Keeping in mind that the observations of the other sensor (GPS) are also dependent to the state vector (Equation 8), the update equations will be defined as Equation 9:
( ) ( ). ( )
2.4 MMS Platform Calibration
In order to determine the full orientation of imaging system with respect to the geo reference system, the lever arm and boresight calibrations are mandatory. The lever arm is the offset vector between the camera perspective center and GPS antenna centre. The boresight angles are the rotations from the imaging coordinate system of camera (C) to the body-fixed system of the IMU (b). As mentioned in Section 2.2, the PMD camera is fixed relative to the digital camera. Therefore, the platform calibration is only performed for the digital camera.
To do the task, a controlled network of 8 points is established by multi-height targets (Figure 2). Their coordinates are accurately measured by static DGPS, in the geo reference system. The platform is placed in front of the targets and convergent images are acquired by the digital camera. At the same time rotation data of IMU ( e
b
R ) and position data of GPS
( e GPS
XG ) are recorded. Applying a photogrammetric resection to the images leads to the exterior orientation parameters of the digital camera in the geo reference system (XCe
G
, e C
R ).
Therefore, the lever arm offset ( e GPS C
DG − ) and the boresight
rotation matrix ( b C
R ) can be determined as follows:
.
e e e
GPS C GPS C
b b e
C e C
D
X
X
R
R R
−
=
−
=
G
G
G
(10)
Figure 2. The pre-installed targets to calibrate the platform
3. DRL OF TRAFFIC SIGNS
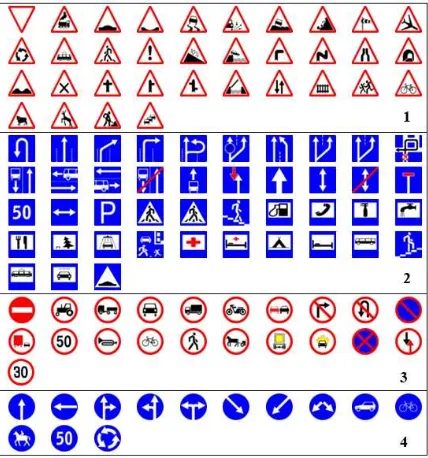
The overall detection and recognition process of the traffic signs is shown in the diagrams of Figure 3. This algorithm has been suggested in the authors’ previous article (Shahbazi et al., 2011b). As implied in the diagram, the final stage of recognition is a template matching based technique which relies on a priori prepared data base. The data base is indicated in Figure 4.
Figure 3. The proposed DRL algorithm
Prior to starting the main DRL process, the video sequences acquired by the digital camera are first interlaced by Bob de-interlacing method. This procedure makes the so-called saw tooth type edge distortion or interlaced lines disappear from the video frames while preserving their original full quality. The motion blur introduced to the images as a result of platform velocity is also numerically reduced by estimating the proper degradation kernel at each frame by considering the instantaneous velocity of the camera.
Figure 4. Template database of traffic signs
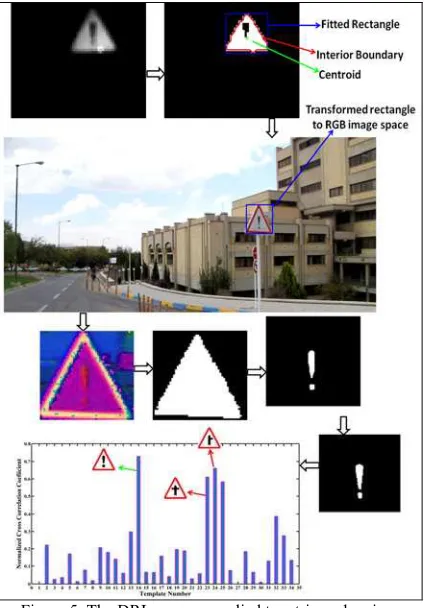
The readers are evidently referred to (Shahbazi et al., 2011b) for detailed information on the DRL algorithm. An example of the process for a triangular sign is depicted in Figure 5.
Figure 5. The DRL process applied to a triangular signs
3.1 3D Localization
Extracting the 3D coordinate of each remote point, seen in one PMD images, is now possible by the following method. As mentioned in Section 2.2, the orientation parameters of perspective centre of the PMD camera relative to the image system of digital camera (ω ϕ κ2, 2, 2,Δ Δ ΔX, Y, Z) are measured through the calibration process.
Assuming that the object coordinates ( , , )e i i i
X Y Z of an image
point ( ,x yi i PMD) is required and e Nav
XG , e b
R are the outputs of navigation system for the corresponding image, then the following equation shall be applied.
,
1 2 2 2 3 2 ,
. .
.( ( ). ( ). ( ). . )
e i
e e e b
i Nav GPS C b C i
i p PMD C b T
i b e i p PMD
PMD
X X
Y X D R R Y
Z Z
x x
R R R R R y y
f
λ
ω
ϕ
κ
−
Δ
⎡ ⎤ ⎡ ⎤
⎢ ⎥ = − + ⎢Δ ⎥
⎢ ⎥ ⎢ ⎥
⎢ ⎥ ⎢Δ ⎥
⎣ ⎦ ⎣ ⎦
−
⎡ ⎤
⎢ ⎥
+ ⎢ − ⎥
⎢ − ⎥
⎣ ⎦
G G
(11)
In Equation 11,λiis the imaging scale at that point which is simply calculated knowing the true depth of the point, ρi,from the range image of PMD:
2 2 2
, ,
( ) ( )
i i
i p PMD i p PMD PMD
x x y y f
ρ
λ
=− + − +
(12)
where fPMD is the principal distance of the PMD camera.
4. EXPERIMENTAL RESULTS
Preliminary, for the detailed results and values of imaging sensors calibrations, please refer to (Shahbazi et al., 2011a). However, it is noteworthy to mention that an average improvement of 83% in RMS of range error and 72% in RMS of coordinate residual, over that achieved with basic calibration, was realized in an independent accuracy assessment. Our proposed calibration method also achieved 25% and 36% improvement on RMS of range error and coordinate residual, respectively, over that obtained by integrated calibration of the single PMD camera. The average error remained on range observations after the calibration is 8.84 millimeters.
The unique time system to synchronize all the sensors is considered to be the GPS time system in this study. In order to avoid the expensive synchronizing circuits, synchronization via the computer is suggested. Since all the sensors are logging their data directly to the computer and data time is recorded by the computer clock, then it would be enough to maintain the difference of computer and GPS time systems.
For this reason, a Bluetooth GPS receiver is applied to log its time data every one second to the computer. When their differences are calculated every second, any other epoch at computer system can be converted to GPS time system by a linear interpolation. Figure 6 implicates the GPS seconds in blue and computer times, after applying the UTC corrections, in red. Here exists an average time difference of 6.899 seconds with 0.014 seconds variance.
Figure 6. Comparison of GPS and computer time systems
In Figure 7, the integrated test path in UTM system is represented. The impact of Kalman Filtering on adjusting the accumulating error of inertial navigation system can be noticed at the zoomed zone.
Figure 7. Test path before and after integration via EKF
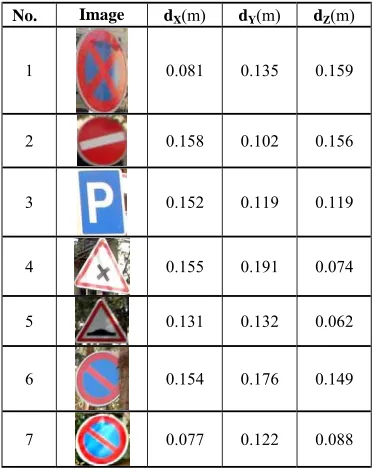
A few examples of traffic signs recognized in this road are depicted in Table 1.
For each sign, its true 3D position is also measured manually by static DGPS. The results are compared with the coordinates derived from our system. The last columns show the absolute difference of the manually measured and automatically computed coordinates. The average values of the differences for all the test dataset are 0.110, 0.131 and 0.120 meters in three Cartesian directions of WGS84 reference system. The RMS error of positioning in X,Y and Z directions are 0.116, 0.136 and 0.125 meters respectively.
As a result, 90% true positive recognition is achieved. Referring to Table 1, samples 6 and 8 are correctly detected even with partial occlusion; signs 1, 3, 4 are validly recognized even in spite of the disorientation and scaling problems; signs 3, 4, 5, 7 are also correctly recognized despite the illumination variations. All the programs are implemented by MATLAB programming on an Intel Core2 Duo CPU 2.2 GHz / 789 MHz. The detection process takes averagely 0.0285 seconds; the detection and recognition processes totally consume 0.4063 seconds; and extracting the 3D coordinate of an image point needs only 0.0002 seconds.
Table 1. Examples of recognized traffic signs
5. CONCLUSION
This paper reviewed the complete implementation of a mobile mapping system for automatic detection, recognition and localization of traffic signs. As a distinction from all the conventional MMS, thanks to the PMD range camera, the developed system is able to extract the 3D coordinates of objects in less than 0.0002 seconds and only from a single image. With combining the shape, color and object-based observation and regarding the distinguishing characters of traffic signs, the proposed algorithm is capable of reliably detecting and recognizing the traffic signs and overcoming the pre-mentioned issues regarding illumination, disorientation, scaling and partial occlusion. As the result of accurate calibration of range errors and efficient integration of navigation data by EKF, an average RMS error of 12 centimeters in positioning has been observed by this system.
REFERENCES
Fraser, C.S., 1997. Digital camera self-calibration. ISPRS J. Photogramm., 52, pp. 149-159.
Grewal, M.S., Weill, L.R., Andrews A.P, 2007. Global Positioning Systems, Inertial Navigation, and Integration. John Wiley & Sons Publication.
Laurent, S., Jerome, N., Thomas, G., 2010. Global environment interpretation from a new mobile mapping system. In:
Proceedings of IEEE Intelligent Vehicles Symposium , San Diego, CA, USA, pp. 941-948.
Moller, T., Kraft, H., Frey, J., 2005. Albrecht, M., Lange R. Robust 3D Measurement with PMD Sensors. In: Proceedings of
the First Range Imaging Research Day, ETH Zurich,
Switzerland.
Seeber, G., 2003. Satellite Geodesy: 2nd Completely Revised
and Extended Edition. Walter de Gruyter, Berlin and New York.
Shahbazi, M., Homayouni, S., Saadatseresht, M., Sattari, M., 2011a. Range Camera Self-Calibration Based on Integrated Bundle Adjustment via Joint Setup with a 2D Digital Camera.
Sensors, 11(9), pp. 8721-8740.
Shahbazi, M., Sattari, M., Homayouni, S., Saadatseresht, M., 2011b. Object-based traffic sign detection and recognition from integrated range and intensity images. In: Proceedings of IASTED SIP and ACTAPRESS, Texas, USA, Vol. 13.
Van den Bergh, M., Van Gool, L., 2011. Combining RGB and ToF cameras for real-time 3D hand gesture interaction. In:
Proceedings of the IEEE Workshop on Applications of Computer Vision, Kona, HI, USA, pp. 66-72.