SIMPLIFIED 3D CITY MODELS FROM LIDAR
J. Lesparre, B.G.H. Gorte
Optical and Laser Remote Sensing sec., Geoscience and Remote Sensing dept., Civil Engineering and Geosciences fac., Delft University of Technology, the Netherlands - (j.lesparre, b.g.h.gorte)@tudelft.nl
Commission II, WG II/1
KEY WORDS: LiDAR, Point Cloud, TIN, Data Reduction, Segmentation, Reconstruction, 3D City Model
ABSTRACT
Aerial laser scan data is widely used to produce 2½D digital elevation models automatically. However, creating full 3D city models from this data is a complex task. A simplified 3D model, like a 2½D model with vertical walls will be easier to produce automatically, especially when the model is not produced to look nice, but just to give realistic results in an analysis or a simulation. To be able to include vertical walls in a 2½D model we extend the TIN data structure in such way that the height of a vertex is stored implicitly in a way that allows multiple heights and efficient processing at the same time. To generate the city model we first apply data reduction in planar areas of an initial TIN. Next, we segment the TIN into planar segments for the ground, walls and roof planes. Finally, we intersect the segments to obtain a 2½D model with slightly slanted walls, which should be adjusted to become exactly vertical. The results for simulated point cloud data are near-perfect. Real aerial laser scan data are more challenging, but the method still gives promising results.
1. INTRODUCTION
1.1 Background
There is a number of well-known applications that greatly benefit from the availability of 3D city models, such as telecommunication network planning, line-of-sight analysis, run-off modelling, and urban climate simulation. In many cases, including those just mentioned, a perfect visual appearance of the model and the highest-possible level of geometric detail are not required. It is, however, important that the models can be created fully automatically, even more so as different applications may require different degrees of detail, and the optimal level depends on accuracy requirements at one hand and on computational feasibility of the application at the other.
A suitable data source for 3D models is nowadays given by Moreover, roof overhangs, underpasses, viaducts and other structures requiring full 3D geometry are not (or at best very poorly) represented in aerial data. Additional terrestrial acquisition would be needed for full 3D city models. Creating full 3D models from point clouds is a complex task, which is still not fully automated, despite extensive research (Oude Elberink, 2008). For some applications a 2½D model is good enough, which is easier for the spatial analysis too. However, the usual shortcoming of 2½D models is that these cannot represent vertical walls explicitly.
1.2 Objective
In this paper, we present an approach to generate a 2½D model with vertical walls fully automatically. This simplified 3D model is to be used in simulations and other applications that do not need perfect visual appearance.
1.3 Approach
The creation of the 2½D model occurs in several steps. After generation of an initial Triangulated Irregular Network (TIN) data reduction is applied, by progressively removing points that are co-planar (within a tolerance) with all their surrounding points (those participating in the point's set of triangles). Meanwhile, the triangulation is adapted. The next step combines adjacent triangles into segments, as long as all participating points are coplanar. On the fly, a topological vertex-triangle-segment data structure is maintained and the plane parameters are stored as attributes in the segments. Also the boundaries between segments become available. The points are projected in their respective planes, which may result in vertices at boundaries having two (or more) different z values. A last step distinguishes that segments are intersected to create straight segment boundaries. The walls will be represented by near-vertical segments, which should be adjusted to exactly vertical walls.
To store these vertical walls we propose to extend the TIN data structure with a concept that, loosely speaking, is found in extrusion models as well: a polygon that is bounded by the footprint of a building is raised 'above' the terrain to the height of that building. In contrast to extrusion, the lifted polygon does not have a single height, but is further segmented to represent the roof shape. We do this on the basis of only the point cloud, to not have to rely on edges from 2D maps (a constrained TIN) to identify as walls, since 2D maps are often of lower quality
International Archives of the Photogrammetry, Remote Sensing and Spatial Information Sciences, Volume XXXIX-B2, 2012 XXII ISPRS Congress, 25 August – 01 September 2012, Melbourne, Australia
than the point cloud data (e.g. less precise, less complete, or less up-to-date).
The final product is an automatically generated city model, which combines realistic geometry with a compact data volume. The model is stored using an extended 2½D TIN data structure, which provides a 2D topology for the model elements (such as roof planes and terrain) and allows for vertical walls separating them.
2. METHOD
2.1 TIN Generation
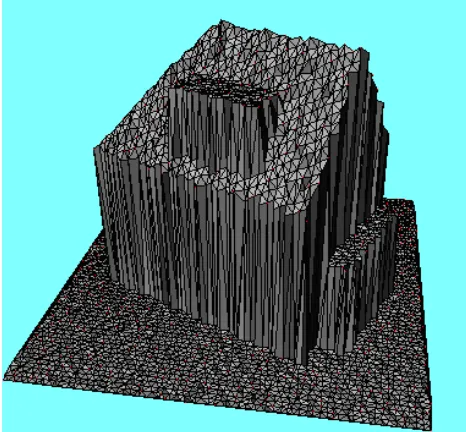
The input for our method is a 3D point cloud from aerial laser scanning or automatic stereo photogrammetry. A 2D Delaunay triangulation (Fig. 1) is created using the well-known Triangle software (Shewchuk, 1997).
Figure 1. 3D view of a 2D Delaunay TIN of a simulated point cloud of a simple building.
2.2 Data Structure
For efficient processing of the data, we restructure it into stars (Gorte & Lesparre, 2012). A star covers a vertex and all triangles in which it participates. In these stars, the x and y coordinate of the central vertex are stored, but not the z coordinate. Additionally, the set of all the triangles in which the vertex participates are stored in anti-clockwise order. For each triangle, the vertex numbers are stored and a segment number (which is still unique in this stage). Later, each segment can consist of multiple triangles. The triangle numbers are stored for each segment, together with the plane parameters a, b and c (as in z = ax + by + c) of that segment. In the end, segments should correspond to planar surfaces like roof planes. Note that this implicitly assigns each vertex a height. However, a vertex participating in two or more segments will have a different z coordinate in each segment (Fig. 2 & 3). This data structure, therefore, allows vertical walls. Several data structures with
capabilities between 2½D and 3D have been proposed previously (Pilouk, 1996; Gröger & Plümer, 2003; Tso & al., 2005). In addition, we introduce methods to generate models adhering to our data structure.
Vertices / stars x, y, triangle1, …, trianglek
Triangles vertex1, vertex2, vertex3, segment Segments #vertices, #triangles, a, b, c
Table 1. The data structure consists of stars, triangles and segments.
Figure 2. Simple building as a TIN with vertical walls. Roof and terrain triangles are explicit parts of the model, as are vertical lines connecting positions at different heights of a point. Slanted lines at walls are not part of the model, but are added by the rendering software.
Figure 3. Orthogonal view of the building in Figure 2, showing coloured segments, triangles and x, y vertices that sometimes occur at different heights.
2.3 TIN Data Reduction
Data reduction speeds up further processing of the TIN. Therefore, the stars are used to remove vertices that are planar with all their neighbours. Vertices are considered
co-International Archives of the Photogrammetry, Remote Sensing and Spatial Information Sciences, Volume XXXIX-B2, 2012 XXII ISPRS Congress, 25 August – 01 September 2012, Melbourne, Australia
planar, when they do not deviate more from the least squares fitted plane through their neighbours than a threshold. The threshold we use is typically at least twice the expected standard deviation of the measurement noise. After removing the central vertex, the star is retriangulated and neighbouring stars are updated accordingly to this new triangulation. With each removed vertex, the total number of triangles reduces by two. It is important not to remove all vertices within the co-planarity threshold simultaneously, since in this way the vertices in a gently curved surface would al be removed. Therefore, we iteratively remove vertices in order of decreasing planarity and do not remove vertices of which a neighbour have been removed in the same iteration step. In this way, a maximum of one third of the vertices is removed in each iteration step. The iteration stops when no more vertices are within the threshold (Fig. 4).
Figure 4. Result of data reduction on the TIN of Figure 1.
2.4 TIN Segmentation
After the data reduction, TIN segmentation recursively groups triangles into planar segments and segments into larger planar segments. Two triangles/segments a and b are merged when a distance function d(a, b) is smaller than a threshold. The function d(a, b) is the maximum of the distance functions d(a→b) and d(b→a), where d(a→b) is the maximum of all distances between the points of a and the plane of segment b (Gorte, 2002; Geibel & Stilla, 2000). However, instead of the vertical distance we now use the perpendicular distance to be able to segment very steep planes like walls too (Fig. 5).
For some vertices, all neighbouring triangles become part of the same segment. These vertices are removed and their stars retriangulated.
2.5 Segment Adjustment
After segmentation, vertices on the border of two (or more) segments will have a different height for each segment. In addition, the walls are still slightly slanted instead of exactly vertical. These inconsistencies should be adjusted, for instance by least squares estimation. We did not yet implement this.
However, we do correct positions of the vertices that are in 2 or 3 segments to the segment plane intersection lines (Fig. 6).
Figure 5. Result of TIN segmentation of the TIN of Figure 4. Note that many vertices appear at a different height in each segment they are part of. This results in the jagged edges of the wall segments.
Figure 6. Result of adjustment of the points on the intersection lines of the segmented TIN of Figure 5.
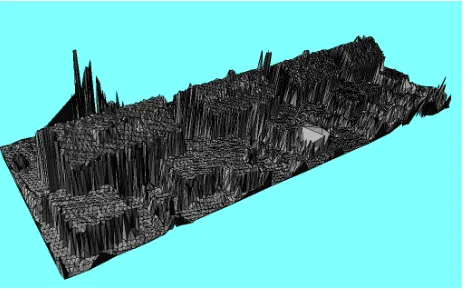
Figure 7. Triangulated aerial laser scan data used for evaluating the method.
International Archives of the Photogrammetry, Remote Sensing and Spatial Information Sciences, Volume XXXIX-B2, 2012 XXII ISPRS Congress, 25 August – 01 September 2012, Melbourne, Australia
3. RESULTS
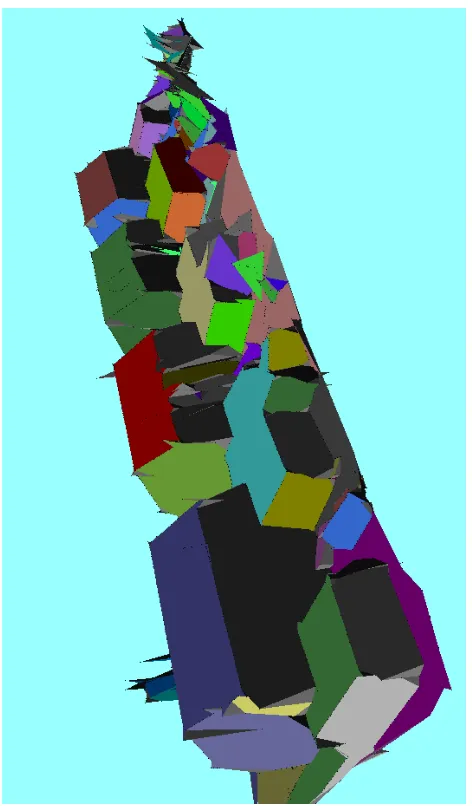
We applied the method described above to a sample of 13 949 points from aerial laser scanning point cloud data of 70 by 20 metres from Wijhe, the Netherlands (Fig. 7). We used a threshold of 0.2 metre for the data reduction and 0.5 metre for the segmentation. The result is a TIN with 231 segments (Fig. 8).
Figure 8. Result of our method applied on the data of Figure 7.
4. EVALUATION
Trees and other vegetation are modelled poorly, which is no surprise, as these do not consist of planar segments. Aspects like outliers, data gaps, vegetation (like thick ivy on the buildings) and small objects complicate the correct modelling. Nevertheless, the basic shapes of the buildings are modelled well. Of course, the walls are still slightly slanted and the vertices at the intersection of more than two segments are not at the optimal position, but we plan to improve this by least squares adjustment. The data reduction from a point cloud of 13 949 points to 231 topologically connected segments will enable efficient further processing of the data for simulations or other applications.
5. CONCLUSIONS
For many applications, 3D city models point cloud data are useful. These applications often do not need a perfect visual appearance, but a simplified 3D model like a 2½D model with vertical walls suffices. However, it is important that such model can be generated fully automatically and that it reduces the amount of detail to a level that enables efficient further analysis. We presented an approach to obtain such model by 2D triangulation, data reduction of planar parts, TIN segmentation and adjusting the segment intersections. For efficient processing, we adapted the traditional TIN data structure. In this paper we demonstrate it by using our method on synthetic point cloud data, where it gives near perfect results. We also present it on real aerial laser scan data, where aspects like outliers, data gaps, vegetation and small objects deteriorate the results. Further research is needed for handling these problems. We are currently implementing an algorithm to make the walls exactly vertical by least squares adjustment of the segments too.
REFERENCES
Geibel, R. and U. Stilla, 2000. “Segmentation of Laser Altimeter Data for Building Reconstruction: Different Procedures and Comparison”. International Archives of Photogrammetry and Remote Sensing, vol. 33, part B3, pp. 326-334.
Gorte, B.G.H., 2002. “Segmentation of TIN-Structured Surface Models”, Joint Conference on Geo-spatial theory, Processing and Applications, Ottawa, Canada, 8 - 12 July.
Gorte, B.G.H., and J. Lesparre, 2012. “Representation and reconstruction of triangular Irregular Networks with Vertical Walls”. 7th International 3D GeoInfo Conference, Québec, Canada, 16 - 17 May.
Gröger, G., and L. Plümer, 2003. “Exploiting 2D Concepts to Achieve Consistency in 3D GIS Applications”. In: Hoel, E. and P. Rigaux (eds.), Proceedings of the 11th International Symposium on Advances in Geographic Information. ACM Press, New York (NY), USA, pp. 78–85.
Oude Elberink, S., 2008. Acquisition of 3D Topography: Automated 3D Road and Building Reconstruction Using Airborne Laser Scanner Data and Topographic Maps. PhD thesis, ITC, University of Twente, Enschede, the Netherlands.
Pilouk, M., 1996. Integrated Modelling for 3D GIS. PhD thesis, ITC, Enschede, the Netherlands.
Shewchuk, J. R., 1997. Delaunay Refinement Mesh Generation. PhD thesis, Computer Science Dept., Carnegie Mellon University, Pittsburgh (PA), USA.
Tse, R.O.C., M. Dakowicz, C.M. Gold and D. Kidner, 2005. “Building Reconstruction Using LIDAR Data”. Proceedings of the 4th ISPRS Workshop on Dynamic and Multi-dimensional
GIS, Pontypridd (Wales), UK, pp. 156-161.
International Archives of the Photogrammetry, Remote Sensing and Spatial Information Sciences, Volume XXXIX-B2, 2012 XXII ISPRS Congress, 25 August – 01 September 2012, Melbourne, Australia