EMPIRICAL ACCURACY ASSESSMENT OF MMS LASER POINT CLOUDS
K Mano a, *, K Ishii a, M Hirao a, K Tachibana a, M Yoshimura a, D Akca b, A Gruen b
a
PASCO Co., 1-1-2 Higashiyama, Meguro-ku, Tokyo, 153-0043, Japan (koonua2121, kiaizh9728, moaasr8719, kainka9209, mairtu1698)@pasco.co.jp b
4DiXplorer AG, Institute of Conservation and Building Research ETH Zuerich, Wolfgang-Pauli-Strasse 27, CH-8093, Zuerich, Switzerland
(agruen, devrim)@ 4dixplorer.com
Commission ICWG V/I
KEY WORDS: Laser scanning, Point Cloud, Accuracy, mobile, Experiment
ABSTRACT:
This paper describes on the accuracy assessment for the Mobile Mapping System (MMS) point clouds and its practical experiments. In recent years 3D measurement technologies have advanced significantly. Especially, MMS has been becoming to be common as one of 3D measurement instruments. We have to consider the effective accuracy assessment method stands on the measurement mechanism of MMS point cloud. For these backgrounds, we propose the accuracy assessment by applying the Least Squares 3D (LS3D) surface matching method. Our accuracy assessment consists of “1)Data quality assessment, 2)Precision accuracy assessment, 3)Absolute accuracy assessment and 4)Relative accuracy assessment”. In order to examine our accuracy assessment, we had conducted an actual MMS run at Minato-Mirai, Yokohama, Japan. Through the practical experiments and actual evaluation, we confirmed that our proposed method is the effective for the MMS point cloud accuracy assessment. As future works, we have a plan to compare with terrestrial laser point clouds as the cross-sensor accuracy assessment.
1. INTRODUCTION
This paper describes on the accuracy assessment for MMS point cloud, and its practical experiments. In recent years, 3D measurement technologies have advanced significantly so that various kinds of 3D measurement systems have been becoming available. The difference of 3D measurement systems is due to mainly a sort of platform. Especially, the vehicle mounted 3D measurement system is called MMS. Recently, MMS has been becoming to be common as one of 3D measurement instruments. MMS is integrated several different sensors and have to work together well and efficiently in order to record the object of interest accurately. So we have to consider the effective accuracy assessment method on the measurement mechanism of MMS measurement.
On the other hand, MMS laser scanner instrument can measure geographical features as point cloud. The characteristic of MMS point cloud is the existence of various 3D shapes with vertical planes such as buildings. If we apply these planes for matching targets, it can be done more effectively.
For these reasons, we propose the accuracy assessment under the consideration of MMS point cloud characteristics. And we examine our approach in its practical experiments.
2. MOBILE MAPPING SYSTEM
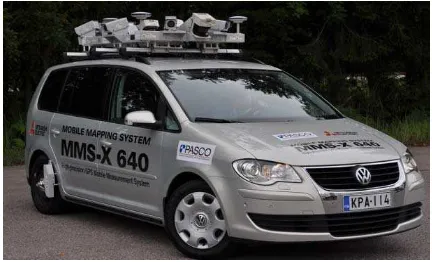
In general, the MMS configures laser scanner, camera, Global Positioning System (GPS), Inertial Measurement Unit (IMU) and odometer. In this study, our used system is Mitsubishi Electronic Corporation MMS type-x640 (Figure 1). It consists of three GPS receivers, IMU, odometer, six digital cameras and four laser scanners. The laser scanner is SICK LMS291. And this laser scanner is possible to measure within 30m distance. By considering this specification, the measurement range of MMS laser scanner is defined to be 15m distance away from the vehicle trajectory. Four laser scanners settings are showed in Figure 2. Arrowed lines show four central laser beams directions. The upper forward laser scanner is L1, the lower forward laser scanner is L2, the upper backward laser scanner is the L3 and the lower backward laser scanner is L4 respectively.
Figure 1. MELCO MMS Type-x 640
International Archives of the Photogrammetry, Remote Sensing and Spatial Information Sciences, Volume XXXIX-B5, 2012 XXII ISPRS Congress, 25 August – 01 September 2012, Melbourne, Australia
Figure 2. Four laser scanners’ irradiation direction
3. PROPOSED ACCURACY ASSESSMENT
3.1 Least Squares 3D surface Matching Concept
The LS3D surface matching is the extension method of 2D least squares image matching and has the same matching idea and concept. This approach is generic in the sense that it can be applied to point cloud derived image matching algorithm from images. This LS3D surface matching is an advanced co-registration point clouds methodology (Gruen and Akca, 2005; Akca, 2010).
The aspects of LS3D surface matching method can evaluate fully 3D geometry by comparing surface to surface. At least more than two different point clouds are necessary to do this matching. It defined that one point cloud is template, the other is search. Actual matching is archived by least squares minimization of a goal function, which measures the Euclidean distances between the template and search surface elements. On the other hand, various shapes of plane such as structures walls and road surface can be recognized on MMS point cloud. If we apply these planes as matching targets, the matching can be done effectively. According to mentioned situations, the authors adopted LS3D surface matching for an accuracy assessment of MMS point clouds
3.2 Accuracy Assessment procedure
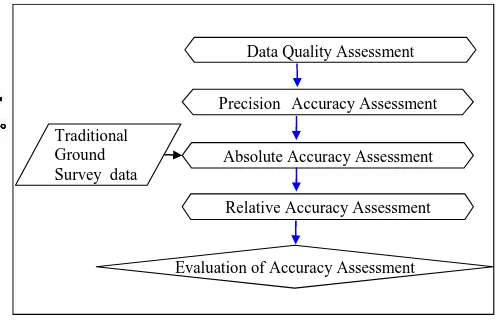
The MMS measurement data is processed and generate point clouds through post-processing. At the same time, the vehicle trajectory and surrounding view imageries are also obtained. In our accuracy assessment, we apply not only point clouds but also trajectory. Here our proposed accuracy assessment consist of 1)Data quality assessment, 2)Precision accuracy assessment, 3)Absolute accuracy assessment and 4)Relative accuracy assessment under the consideration of our MMS characteristics. Figure 3 shows our proposed accuracy assessment procedure. Followings are detailed explanations of all assessments.
Traditional
Figure 3. Accuracy Assessment Procedure
3.2.1 Data Quality Assessment
This assessment is preparation for the accuracy assessment. In order to avoid an unsuitable data for the accuracy assessment, insufficient data is detected by how many numbers of satellite signals are receiving and Dilution of Precision (DOP) using vehicle trajectory.
3.2.2 Precision Accuracy Assessment
In terms of the MMS, precision is related to the system and the geometry of point positioning devise. It is evaluated the system quality in this assessment. In order to check how many portions are overlapped between two point clouds from four same path point clouds. In this case, we examined point clouds combinations such as L1-L2, L1-L3, L1-L4, L2-L3, L2-L4 and L3-L4.
3.2.3 Absolute Accuracy Assessment
In this assessment, it is examined the point cloud positioning reality by comparison with ground surveyed Ground Control Points (GCP) and measured GCPs on the point cloud. The ground surveyed GCPs positions are measured by Kinematic GPS survey and traditional ground survey.
3.2.4 Relative Accuracy Assessment
Both precision and absolute accuracy assessments are evaluated based upon only once measurement data. However MMS is possible to accumulate measurements as multi-temporal data. So it is examined the point positioning repeatability on time temporal point clouds. Evaluation method is the almost same way as precision accuracy assessment method.
4. EXPERIMENTAL MEASUREMENT
4.1 Setting up of Test Site
First of all, test site decided according to the following conditions
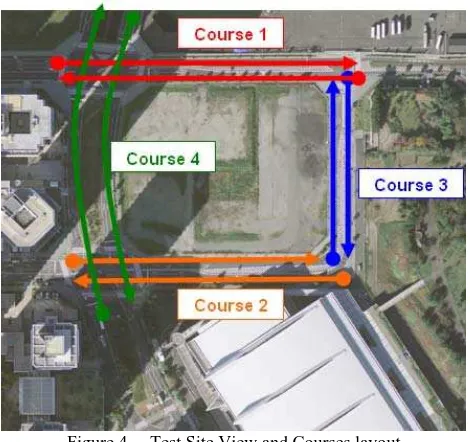
1. to be open area with good GPS receiving conditions 2. to exist vertical structures along measurement courses 3. to allocate validation target deployment areas Test site set up at Yokohama Mirai, Japan. Minato-Mirai is the bay-side region and test site is a size of approximately 200m x 200m area. On the other hand, there is the big exhibition building in south side and tall buildings in the west side. Figure 4 shows test site view and courses layout. It is possible to be carried out measurements under both good and bad GPS receiving conditions.
International Archives of the Photogrammetry, Remote Sensing and Spatial Information Sciences, Volume XXXIX-B5, 2012 XXII ISPRS Congress, 25 August – 01 September 2012, Melbourne, Australia
Figure 4. Test Site View and Courses layout
4.2 Measurement
4.2.1 MMS Measurement:
The MMS measurement was executed on November 2nd 2011. Four measurement courses were designed and 24 paths data was obtained. The relationship between measurement courses, paths, velocities and data quality assessment result are summarized in Table 1. At each course, we obtained two times of data at different movement directions and different velocities basically. Two different speeds were decided by the consideration of high dense point cloud generation and normal dense point cloud generation.
4.2.2 GCP Measurement
This measurement was done on October 21, 22 and 25th 2011. In order to obtain reference features positions as GCPs, kinematic GPS and traditional ground surveys were executed. First, two independent close-shape traverse frames along the both sides of measurement courses were set up. Second, reference features positions as GCPs were introduced by using two close-shaped traverse features positions. In this case, buildings walls, road surfaces and small boards which we put were adopted as reference features.
5. RESULTS OF ACCURACY ASSESSMENT
5.1 Data Quality Assessment
Table 1 shows measurement summary and the result of data quality assessment. The maximum length of GPS baseline analysis was 3.4km. All of course-1 and 3 measurements were done with good GPS signal receiving conditions. Because over six numbers of GPS satellites signals were receiving. However all of course-2 and 4 measurements were carried out under the bad GPS receiving conditions. Because less than five numbers of GPS satellites signals were receiving.
In following assessments, we focused on course-1 and 4 data. Because course-1 measuremesnts were performed under the best GPS conditions. Course-4 measurements were the worst conditions.
Table 1. Summary of measurement paths / courses Results of Data quality Assessment
5.2 Precision Accuracy Assessment
In between point clouds combinations, almost no overlapped potions were confirmed except lower lasers’ and upper lasers’ combinations. According to mentioned before reason, we only focused on lower lasers’ (L2-L4) and upper lasers’ combination (L1-L3). Table 2 shows the result of Precision Accuracy Assessment. It was recognized that an average difference between whole L2 point cloud and whole L4 point cloud was 3.6cm as RMS error introduces by LS3D surface matching. And an average difference between L1 and L3 point clouds was also recognized. According to the same way as before, its average RMS error was 9.2cm.
From these results, RMS error in upper lasers’ combination is bigger than lower combination. However lower lasers’ combination indicates that its combination point cloud has enough precision accuracy.
Average of RMS error (cm) 1
3
Course velocity
(km/h)
Table 2. Results of Precision Accuracy Assessment
5.3 Absolute Accuracy Assessment
Using 69 GCPs, the differences between ground surveyed GCPs and measured GCPs on the point cloud were calculated for coerse1 measurements point clouds Table 3 shows the result of absolute accuracy assessment. It was confirmed that maximum RMS error was 4.3cm in Z axes. However other RMS errors were smaller than Z axes RMS. This indicates that this MMS can provide the point cloud with enough absolute accuracy in comparison with laser instrument specification.
International Archives of the Photogrammetry, Remote Sensing and Spatial Information Sciences, Volume XXXIX-B5, 2012 XXII ISPRS Congress, 25 August – 01 September 2012, Melbourne, Australia
L2 L4 L2 L4 L2 L4
X -1.5 0.6 -5.5 7.0 2.1 0.9
Y 0.7 1.1 5.6 -5.4 1.7 1.9
Z 2.6 2.6 11.6 13.9 4.3 3.4
AXES
Mean difference
(cm)
Maxisimum defference
(cm)
RMS (cm)
Table 3. Results of Absolute Accuracy Assessment
5.4 Relative Accuracy Assessment
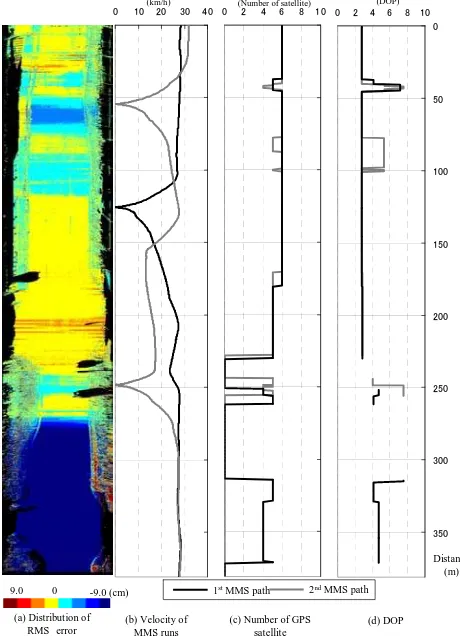
The differences between point clouds at different time and for the same course (course-4) using same laser scanner (L2) were obtained by LS3D surface matching. Figure 5 is the results of relative accuracy assessment. (a) corresponds to the spatial difference distribution. (b) is vehicle velocity. (c) is how many satellites are receiving. (d) is the DOP respectively.
According (a), it is confirmed that the difference were almost
±3cm. However bigger differences (light-blue potion in this figure) were identified only in the range of unstable vehicle velocity speed. And minus differences also were indentified (dark blue potion in this figure) only in the range under the bad GPS receiving conditions
(a) Distribution of RMS error
(b) Velocity of MMS runs
(c) Number of GPS satellite
(d) DOP Distance
(m)
(km/h) (Number of satellite) (DOP)
0
0.099.0 0 -0.09-9.0 (cm) 1stMMS path 2ndMMS path
Figure 5. Result of Relative Accuracy Assessment
6. CONCLUSIONS
In this study, we proposed the accuracy assessment for the MMS point clouds. Our proposed accuracy assessment consists of “1)Data quality assessment, 2)Precision accuracy assessment, 3)Absolute accuracy assessment and 4)Relative accuracy assessment”. And we examined our approach in its practical experiments. Through our experiments, we confirmed the followings “1) system quality, 2) point cloud positional reality, 3) point positional repeatability”. Thus, we confirmed that our proposed methodology is effective for the MMS point cloud accuracy assessment.
As future works, we have a plan to compare with terrestrial laser point clouds as the cross-sensor accuracy assessment.
REFERENCES
Akca, D., 2010. Co-registration of surfaces by 3D Least Squares matching. Photogrammetric Engineering and Remote
Sensing, 76 (3), pp. 307-318.
Gruen, A., Akca, D., 2005. Least squares 3D surface and curve matching. ISPRS Journal of Photogrammetry and Remote
Sensing, 59 (3), pp. 151-174.
International Archives of the Photogrammetry, Remote Sensing and Spatial Information Sciences, Volume XXXIX-B5, 2012 XXII ISPRS Congress, 25 August – 01 September 2012, Melbourne, Australia