3D MODELLING OF AN INDOOR SPACE USING A ROTATING STEREO FRAME CAMERA SYSTEM
J. Kang a, I. Lee a, *
a Dept. of Geoinformatics, University of Seoul, 163 Seoulsiripdearo, Dongdaemun-gu, Seoul, 02504, Korea - (jeongin23, iplee)@uos.ac.kr
Commission VI, WG VI/4
KEY WORDS: Indoor 3D Modelling, Rotating Stereo Frame Camera System, Fish-eye Lens, Accuracy Evaluation
ABSTRACT:
Sophisticated indoor design and growing development in urban architecture make indoor spaces more complex. And the indoor spaces are easily connected to public transportations such as subway and train stations. These phenomena allow to transfer outdoor activities to the indoor spaces. Constant development of technology has a significant impact on people knowledge about services such as location awareness services in the indoor spaces. Thus, it is required to develop the low-cost system to create the 3D model of the indoor spaces for services based on the indoor models. In this paper, we thus introduce the rotating stereo frame camera system that has two cameras and generate the indoor 3D model using the system. First, select a test site and acquired images eight times during one day with different positions and heights of the system. Measurements were complemented by object control points obtained from a total station. As the data were obtained from the different positions and heights of the system, it was possible to make various combinations of data and choose several suitable combinations for input data. Next, we generated the 3D model of the test site using commercial software with previously chosen input data. The last part of the processes will be to evaluate the accuracy of the generated indoor model from selected input data. In summary, this paper introduces the low-cost system to acquire indoor spatial data and generate the 3D model using images acquired by the system. Through this experiments, we ensure that the introduced system is suitable for generating indoor spatial information. The proposed low-cost system will be applied to indoor services based on the indoor spatial information.
* Corresponding author
1. INTRODUCTION
More and more people usually spend their time not on the outdoor but on the indoor environment. This tendency is constantly increased, which is proven by the fact that people spend more than 90% of their lifetime in indoor space (U.S.EPA, 2015). Accordingly, the demand of location based and awareness services for indoor areas is being increased. This demand opens a new market particularly in indoor areas.
The current indoor spaces become complex and large thanks to the advance of architectural technology. Many services based on indoor spatial models have been used in various field. Therefore, it is necessary to develop effective techniques of acquiring and creating indoor spatial information for services which are using structural information of internal space. Accordingly, various studies have been conducted on the indoor modelling to applicate at the services based on the indoor models.
Recently, the general method for generating the indoor 3D model is using the laser scanner and images. Díaz-Vilariño, et al. (2015) studied on 3D modelling of indoor environments using images and point clouds, Ikeda et al. (2006) and Biber et al. (2004) proposed the method of 3D indoor environment modelling with omnidirectional images and point cloud. But this method has disadvantage that the geometry of the generated models not represented in detail than method using images (Oh and Lee, 2011). The method using only images can generate the model which has high details, but it needs the large number of images to generate the 3D indoor models (Biber et al., 2004). It also required big memory to store the images, so it is not
efficient. And in the previous studies, most of the technologies for indoor data acquisition are from the outdoor data acquisition techniques (Zlatanova et al., 2013). But the indoor spaces have constraints such as the limited size unlike the outdoor spaces. So, to acquiring the data, the sensors are mounted on the moving platforms such as robot, trolley or human with a backpack. However, the movement of the moving platforms cannot be free because there are many objects in the indoor spaces.
In this study, we thus proposed a low-cost indoor data acquisition system, the rotating stereo frame camera system. The system equipped with the two frame cameras and a rotating platform. It can obtain the indoor data at several positions in the indoor spaces and acquire the images of the indoor spaces while the platform rotates. So, it can acquire all of the indoor space scenes in the small number of images and thus the system can effectively acquire the image data of the indoor space.
To evaluate the possibility of the indoor modelling using the rotating stereo frame camera system, we selected test bed and acquired image data sets using the system. And we combined input image data sets that have the different stereo condition to check the result in accordance with the input data condition besides basically getting from the system (the system acquires image data set of camera stereo). From these data, we generated the indoor 3D models using a photogrammetric commercial software, PhotoScan. And we performed qualitative and quantitative analysis of generated indoor 3D models. From the results, generated models using the proposed system and the PhotoScan will be utilized in services which are not inquiring high accuracy.
2. ROTATING FRAME CAMERA SYSTEM AND DATA ACQUISITION
2.1 Rotating Stereo Frame Camera System
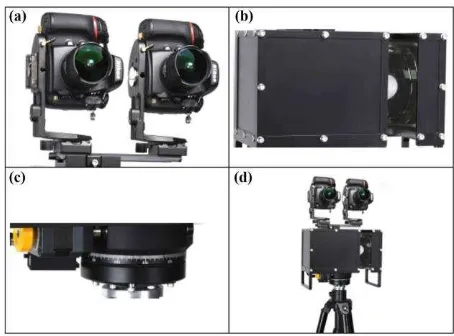
The proposed system, rotating stereo frame camera system (Figure 1(d)), consists of two frame cameras (Figure 1(a)) and a rotating platform (Figure 1(b)). Two cameras are mounted to the left and right of the rotating platform and they are spaced about 14 centimeters. And each camera is equipped with fish-eye lens. Two cameras acquire frame images at the same time when the platform is rotating. The system proposed in this study has the advantage of being able to acquire the data in a narrow space.
Figure 1. The Rotating Stereo Frame Camera System
2.2 Data Acquisition
In this study, we selected an indoor space which size is 8.0 * 10.0 * 2.5(m). And we acquired image data sets using proposed system and also obtained object control points (OCPs) using a total station for experiments.
2.2.1 Acquiring the Object Control Points (OCPs): Coordinates of the OCPs of the test bed have to be obtained based on the reference coordinate system of space. But for the indoor spaces, the reference coordinate system does not exist. So, in this study, we defined the reference system, Figure 2, particularly in an indoor space by selecting a main corner in the room as the origin of the reference system and determine the three edges intersected at the origin as each axis of the system (Oh and Lee, 2012). Based on the defined reference coordinate system, we acquired coordinates of OCPs from the objects such as blackboard, terminal box, fluorescent lamps in the test bed.
Figure 2. Define the Reference Coordinate System of the Test Bed
2.2.2 Acquiring the Images of the Test Bed: The image data sets are acquired in two positions and heights in the test bed shown in Figure 3.
Figure 3. Image Acquisition in the Test Bed
Image data sets acquiring using the proposed system were taken one image every time the rotating body rotates 10°. When the platform is rotated 360°, thirty-six images are acquired from each camera. So, in this study, we acquired eights data set that consists of 36 images from a single camera. Table 1 shows camera, position and height information about each image data set acquired from a single camera.
Camera Position Height(m) 1
Left
Position 1 Height 1
2 Height 2
3
Position 2 Height 1
4 Height 2
5
Right
Position 1 Height 1
6 Height 2
7
Position 2 Height 1
8 Height 2
Table 1. Information of the Acquired Dataset using the System
3. GENERATION OF INDOOR 3D MODELS AND ACCURACY EVALUATION
To generate the indoor 3D model of the test site from acquired data sets, we selected a photogrammetric commercial software, PhotoScan. In this study, we made stereo data sets with various conditions by combining two data sets that have a different camera, position, and height in Table 1. From these stereo data sets, we selected three input data sets by performing simple test. And we used the entire image data as the input data for comparison the generated models from stereo data sets. For the last data set, we performed more experiments for results analyses such as results depend on the number of inputting OCPs or images.
3.1 Experimental data
To evaluate accuracy of the indoor 3D models according to an input data set, we made stereo data sets shown as in Table 2.
(1) Camera Stereo
(2) Height Stereo
(3) Position Stereo Position Height Position Camera Camera Height 1
Position1 Height 1 Position 1 Left Left Height 1
2 Height 2 Right Height 2
3
Position 2 Height 1 Position 2 Left Right Height 1
4 Height 2 Right Height 2
Table 2. Stereo sets of images that have different conditions The International Archives of the Photogrammetry, Remote Sensing and Spatial Information Sciences, Volume XLI-B4, 2016
To select the input datasets, we performed bundle block adjustment of each dataset in Table 2 using the PhotoScan. And we chose three datasets as input data that have smallest re-projection error from each condition shown as Table 3.
Depending on the results in Table 3, we chose input datasets for indoor 3D modelling experiments. From the first case (camera stereo), we chose dataset that acquired from the two cameras (left and right) at the position 1 with height 1 (higher height, 1.6m). And from the second case (height stereo), we chose dataset that acquired at the position 1 using left camera with the two different height (height 1 and height 2). Lastly, from the third case (position stereo), we chose dataset that acquired at the two different position (position 1 and position 2) using right camera with height 1.
Stereo type
(1) (2) (3)
Camera Height Position
re-projection error (unit: pix)
1 2.4637 2.2588 2.6545
2 9.2203 2.9371 2.7209
3 2.8960 2.5814 2.5677
4 2.9578 2.9290 9.2703
Table 3. The re-projection error of each data set
And we also use the entire image data acquired using the proposed system. The generated model from this dataset will be used as a comparison target with other models in terms of quantitative analysis and qualitative analysis.
3.2 Generation of Indoor 3D Models
Figure 4. Indoor 3D Modelling Process using the PhotoScan
In this study, we divided the indoor 3D modelling process using the PhotoScan to four steps and the process is shown in Figure 4. The first step is sparse matching. In this step, the software makes point cloud with low density and some of the extracted points from this step is used in the bundle block adjustment process. In the next step, the software perform bundle block adjustment. In this step, we input the object control points to the PhotoScan. The exterior orientation parameters of input images and coordinates of object points extracted from in the previous step are determined using the reference coordinate system information of the test site from OCPs, and the third step is the dense matching process and PhotoScan makes dense point cloud. The last step is model generation process. In the model generation step, first, build mesh from the dense point cloud and finally build texture of the model using the input image dataset.
3.3 Accuracy Evaluation
In this study, we conducted the accuracy evaluation by performing qualitative analysis by visual inspection and quantitative analysis on the generated models to determine whether the proposed system is suitable for the indoor 3D modelling. To perform quantitative analysis, we divided the generated model to the space and the objects in the space. And we compared the lengths of space and the object, respectively, one is measured from generated models and the other is measured from the test bed using a total station.
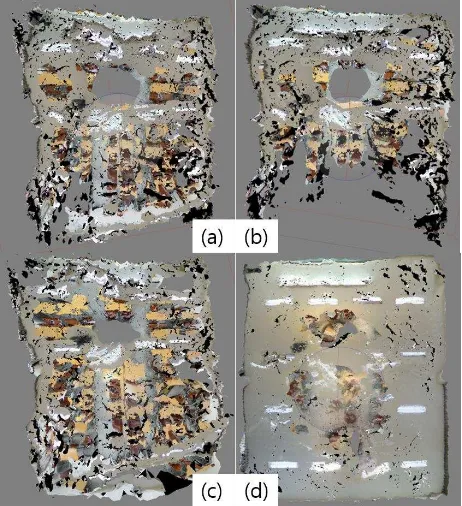
3.3.1 Qualitative Analysis: To perform the qualitative analysis of generated indoor models, we checked top, front, rear, left, and right view within the each 3D model. In Figure 5, 6, 7, each model is generated (a) from camera stereo set, (b) from height stereo set, (c) from position stereo set and (d) from the entire set. As mentioned previously, model (d) in the each figure is generated from entire image datasets acquired using the proposed system, so model (d) is the closest model to real test bed and it will be used as a comparison target with other models. Figure 5 shows the top view of the generated models and we can check the overall shape of the each model through this figure.
Figure 5. Top view of the generated models using PhotoScan
By comparing the shape in (a) ~ (c) with (d), it can be seen that a lot of distortion in the shape of (a) ~ (c) than in the shape of (d). In the of bottom side of the models, in Figure 5(b), it can check the bottom side of the model didn’t form at all. Figure 5(a) and (c) also have distorted bottom but it can check the model in Figure 5(a) more skewed than Figure 5(c). This is because of the acquired position of the input dataset of each case. The input datasets of Figure 5(a) and Figure 5(b) are acquired from only one position (position 1). Whereas the input dataset of Figure 5(c) is acquired from two different positions. So, dataset of Figure 5(c) has longer base line than other datasets and it can affect the model generation processing in the PhotoScan.
Figure 6. The front and the rear side of generated models using PhotoScan
Figure 6 is seen the front (the blackboard) and the rear side (respectively the lower figure) within the generated models, respectively. Compared with blackboard in front side of Figure 6(d), the shape of the blackboard in all models (Figure 6(a) ~ (c)) is well represented except for slight distortion. However, the other objects such as desks, lecture desk or a door in the front side of the each model have many distortions. Particularly in the case of Figure 6(c), the indoor model of the objects in the front side such as the door and the wall beside the blackboard aren’t created. In the rear sides of the indoor models, compare Figure 6(d), there are many distortions in the models. In the case of Figure 6(b), the rear side wall is not generated to model at all. And for Figure 6(a), the right side of the rear side wall in the model is empty. It seems also for reasons mentioned above related to the position of data acquisition.
Also in Figure 6, except for Figure 6(d), compare the front side (the upper figure) and the rear side (the lower case figure) of the each case, it can be seen that the rear sides of the generated models are more distorted or even the wall is not generated. The biggest difference between the front side and the rear side of the test site is the presence or absence of the objects. In the front side of the test site (Figure 7(d)), there are many objects that can be distinct features in the images. On the other hand, the rear side wall of the test site, there is no objects to be distinct features in the images. In the process of extracting the conjugate points from the input images, PhotoScan extract the points that are easily identified. But there are no objects in the rear side wall, so the software can’t distinct the same points from difference images were taken same part and so the software can be treated that all points as the same point.
Figure 7 shows the left (respectively the upper figure) and right side (respectively the lower figure) within the each generated model. In the test site, the windows are in the left side and the white wall is in the right side. The left side in the each indoor model are created as the 3D model but the windows and the pillar between the windows are very skewed and zigzagged. And for the right side walls, except for Figure 7(d), there are many distortions in the generated models. But it can be checked the complete form of the right side wall within the test site in the lower part of Figure 7(d). In particular, the part of the wall with nothing is didn't created at all and the other part with small
Figure 7. The right and the left side of generated models using PhotoScan
curtain is generated in the indoor model but there also skewed or empty. This also seems to be the presence or absence of that part of the object.
3.3.2 Quantitative Analysis: In this study, we separated the generated each model to whole space and the objects in the test site to perform the quantitative analysis. And then, we calculated the differences of the lengths of the space and the objects from generated models and measured values using a total station.
Figure 8. The width, length and height of the test bed
In the defined reference coordinate system of the test site (Figure 8), we consider that the X axis is the width, the Y axis is the length, and Z axis is the height of the test site, respectively. And we get the values of each lengths from the calculated data using the PhotoScan to compare with the measured value from a total station. Table 4 shows respective measurement values from each model and actual indoor space and Table 5 shows the differences between the measured values and calculated values from the PhotoScan.
unit: m (a) (b) (c) (d)
Measured value stereo
type camera height position entire
width 7.6260 8.2702 8.1441 7.8534 8.0 length 9.5283 9.8768 9.8773 10.3291 10.0 height 2.4024 2.4016 2.3674 2.4462 2.5
Table 4. Respective measurement values of the test bed from each model and actual indoor space
unit: m (a) (b) (c) (d) stereo type camera height position entire
width 0.3740 -0.2702 -0.1441 0.1466 length 0.4717 0.1232 0.1227 -0.3291 height 0.0976 0.0984 0.1326 0.0538 Table 5. The differences between the measured values and
calculated values from the PhotoScan
The length values in Table 5 showed the maximum differences which average is about 36cm with measured value of the length and the height values showed the minimum differences which average is about 9.5cm with measured value of the height to the overall. By the models, the case of the camera stereo type (a) showed maximum difference values and the case of the position stereo showed minimum difference values in generally. From this results, when comparing the length of the test bed, the case of the position stereo set has the higher accuracy of the modelling result.
Figure 9.The width, length and height of the terminal box
The following is a comparison of the objects lengths within the test bed. To evaluate the accuracy within the generated models we selected three objects in the test bed. Figure 9 shows the widths, lengths and heights of the terminal box. Table 6 shows respective measurement values from each model and actual indoor space and Table 7, the differences of the calculated values and measured values, respectively.
unit: m (a) (b) (c) (d)
Measured value stereo
type camera height position entire
width1 0.4392 0.4166 0.4361 0.3643 0.3922 width2 0.3535 0.3569 0.3506 0.4088 0.3897 length1 0.6163 0.6120 0.6233 0.5987 0.5935 length2 0.4392 0.5963 0.5902 0.6360 0.5940 Height1 0.0803 0.0921 0.1019 0.0863 0.2055 Height1 0.1495 0.0798 0.0872 0.1713 0.2055 Table 6. Respective measurement values of the terminal box
from each model and actual indoor space
unit: m (a) (b) (c) (d)
stereo type camera height position entire width1 -0.0470 -0.0244 -0.0439 0.0279 width2 0.0362 0.0328 0.0391 -0.0191 length1 -0.0228 -0.0185 -0.0298 -0.0052 length2 0.1548 -0.0023 0.0038 -0.0420 height1 0.1252 0.1134 0.1036 0.1192 height2 0.0560 0.1257 0.1183 0.0342 Table 7. The differences between the measured values and
calculated values from the PhotoScan
In Table 6, the differences of the height 1 are very large particularly. The average of the differences is about 11.5cm that is out of portion to the measured values are about 20.6 cm. On the other hand, the average values of the differences on the width 1, 2 values are about 3.6cm, respectively. And average values of the differences of the lengths are showed smaller difference values than heights that the average value of the length 1 is about 1.9cm and length 2 is about 5.9cm. In the results for each model, the model generated from the height stereo set shows the smallest average value of the differences between the calculated values and measured values.
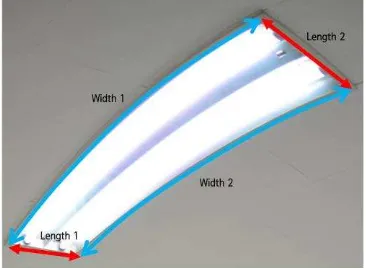
Figure 10 shows the widths, lengths of a fluorescent lamp in the test site for comparisons. There is not enough objects which can be distinct features in the rear side of the test site, we selected the fluorescent lamp which the most well expressed in the model.
Figure 10. The width, length and height of the fluorescent lamp
Table 8 shows respective measurement values from each model and actual indoor space and Table 9, the differences of the calculated values and measured values, respectively.
unit: m (a) (b) (c) (d)
Measured value stereo
type camera height position entire
width1 1.3759 1.2775 1.2280 1.5491 1.2733 width2 1.2887 1.6189 1.0272 1.7399 1.2178 length1 0.1611 0.6379 0.0886 0.1678 0.3569 length2 0.0964 0.2039 0.3306 0.3112 0.3442 Table 8. Respective measurement values of the fluorescent lamp
unit: m (a) (b) (c) (d)
stereo type camera height position entire width1 -0.1026 -0.0042 0.0453 -0.2758 width2 -0.0709 -0.4011 0.1906 -0.5221 length1 0.1958 -0.2810 0.2683 0.1891 length2 0.2478 0.1403 0.0136 0.0330 Table 9. The differences between the measured values and
calculated values from the PhotoScan
In the case of the fluorescent lamp, the differences between the calculated values and the measured values are very large to overall (Table 9). The differences of the width 2 are too large for the measured value. The largest difference is about 52cm between the measured values of width 2 is about 1.22m and the calculated value from model (d) is about 1.74m. In the case of the length 1 also has large difference between the values that about 26.2cm. The reason for this large differences is that when the PhotoScan extract the points from the input images, the software can’t distinct that objects clearly, because of there are many fluorescent lamps in the ceiling of the test site.
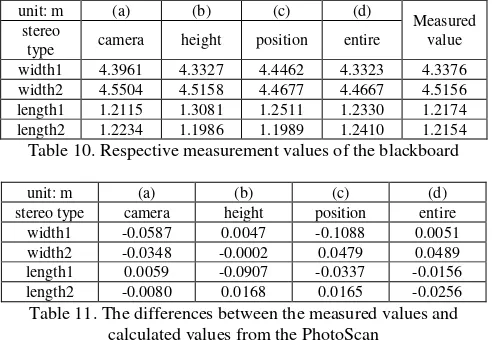
Figure 11. Widths and lengths of a blackboard in the test bed for comparison
The last object selected for the quantitative analysis of the inside of the generated model is the blackboard. Figure 11 shows the widths and lengths of the blackboard for the comparisons, respectively. We summarized the values from the each models and the values measured using a total station (Table 10). And Table 11 shows the differences of the calculated values and measured values, respectively.
unit: m (a) (b) (c) (d)
Measured value stereo
type camera height position entire
width1 4.3961 4.3327 4.4462 4.3323 4.3376 width2 4.5504 4.5158 4.4677 4.4667 4.5156 length1 1.2115 1.3081 1.2511 1.2330 1.2174 length2 1.2234 1.1986 1.1989 1.2410 1.2154 Table 10. Respective measurement values of the blackboard
unit: m (a) (b) (c) (d)
stereo type camera height position entire width1 -0.0587 0.0047 -0.1088 0.0051 width2 -0.0348 -0.0002 0.0479 0.0489 length1 0.0059 -0.0907 -0.0337 -0.0156 length2 -0.0080 0.0168 0.0165 -0.0256 Table 11. The differences between the measured values and
calculated values from the PhotoScan
The results of comparing the each length of the blackboard, all of the differences are less than 6cm. The width 1 values showed the maximum differences which average is about 4.4cm and the length 2 values showed the minimum differences which average is about 1.9cm. In the results for each model, the model (a) from the camera stereo dataset showed the higher accuracy.
4. CONCLUSIONS
In this study, we proposed a low-cost system, a rotating stereo frame camera system, for acquiring the indoor image dataset. Using the system, we acquired image data and generated the indoor 3D models. For evaluating the possibility of the indoor modelling using the proposed system, we performed accuracy evaluations on the indoor models through qualitative and quantitative analysis.
Except for the model from the entire image dataset, the model from the position stereo dataset was the most similar to the real space. The inside of the model, the front and left side that have the many objects were well represented than the rear and right side that have no objects. So, the results of qualitative evaluation, the result of the modelling process is affected by the image acquisition position and the presence or absence of the objects in the images.
From the results of the quantitative analysis, comparison about the lengths of the space, the model from the position stereo dataset showed the smallest difference. So from this result, we determined also that the result of the modelling process is
affected by the image acquisition position. And for the lengths of the objects in the test site, the differences are very large regardless of the stereo condition of the input dataset.
From the comparison results through the qualitative and quantitative analysis on the generated indoor 3D models, it can be generate the indoor 3D model using small number of the images acquired from the proposed system. But the accuracy of the generated model is low and the model didn’t clearly distinct the objects. So it will be utilized in services which are not inquiring the indoor 3D model with high accuracy.
ACKNOWLEDGEMENTS
This research was supported by Basic Science Research Progra m through the National Research Foundation of Korea(NRF) fu nded by the Ministry of Education(NRF-2013R1A1A2063714)
REFERENCES
Biber, P., Andreasson, H., Dockett, T. and Schilling, A., 2004. 3D Modeling of Indoor Environment by a Mobile Robot with a Laser Scanner and Panoramic Camera. International Conference on Intelligent Robots and Systems, September 28 – October 2, 2004, Sandal, Japan.
Díaz-Vilariño, L., Khoshelham, K., Martínez-Sánchez, J. and Arias, P., 2015. 3D Modeling of Building Indoor Spaces and Closed Doors from Imagery and Point Clouds. Sensors 2015, 15, pp.3491-3512
Oh, S., and Lee, I., 2011. Calibration of a stereo rotating line camera system for sophisticated indoor panorama services. 34th Asian Conference on Remote Sensing 2013, Bali, Indonesia.
Oh, S., and Lee, I., 2012. Estimation of Camera Extrinsic Parameters of Indoor Omni-Directional Images Acquired by a Rotating Line Camera. In Advances in Visual Computing (pp. 616-625). Springer Berlin Heidelberg.
U.S. Environmental Protection Agency, 2015. The Inside Story: A Guide to Indoor Air Quality.
http://www.fusionsvc.com/The_Inside_Story.pdf (accessed April 2016)
Zlatanova, S., G. Sithole, M. Nakagawa, and Q. Zhu, 2013. Problems in indoor mapping and modelling, In Acquisition and Modelling of Indoor and Enclosed Environments 2013, Cape Town, South Africa, 11-13 December 2013, ISPRS Archives Volume XL-4/W4, 2013. ISPRS.