Evaluation of a water balance model using data for bare soil and
crop surfaces in Middle Europe
J. Olejnik
a,∗, F. Eulenstein
b, A. Kedziora
c, A. Werner
baAgrometeorology Department, Agricultural University of Poznan, ul. Witosa 45, 60-667 Poznan, Poland
bCenter for Agricultural Landscapes and Land Use Research (ZALF), Müncheberg, Eberswalder Str. 84, 15374 Muncheberg, Germany cResearch Centre for Agricultural and Forest Environment, PAN, ul. Bukowska 19, Poznan, Poland
Received 10 March 2000; received in revised form 7 August 2000; accepted 10 August 2000
Abstract
This paper compares the results of simulations and measurements of evapotranspiration from cultivated fields in Middle Europe. The modelling system THESEUS (i.e. toolbox for hydro-ecological simulation and evaluation utilities) from Wege-henkel (1997a, 2000) was used in this study. Evapotranspiration was also calculated from the latent heat flux density (LE) measured using a modified Bowen ratio method. The model, as well as the modification of the Bowen ratio procedure are described. Heat balance components for eight measurement periods (81 days) were used in the comparison. There was good agreement between model simulations and measurements. The average relative error in evapotranspiration estimation by the model was about 10% for time of integration of few days, and the error decreases with the increase of integration time. The error is smaller for higher daily rates of evapotranspiration. © 2001 Elsevier Science B.V. All rights reserved.
Keywords:Evapotranspiration; Modelling; Bowen ratio method
1. Introduction
In Western Poland and Eastern Germany large low-lands of the Elbe and Oder catchments are mainly used for agriculture. The current and the future agricultural economic conditions will cause various changes in land use, and thus, plant cover. Methods are needed that determine the impact of these changes on the exchange of heat and water between the land and the atmosphere. In addition, land use strategies providing sustainable agriculture and protection of
∗Corresponding author. Tel.:+48-61-8487801
fax:+48-61-8487802.
E-mail addresses:[email protected] (J. Olejnik), [email protected] (F. Eulenstein), [email protected] (A. Kedziora), [email protected] (A. Werner).
the water resources require information on the factors controlling the water and heat balances.
Water which reaches the earth surface partly re-turns to the atmosphere due to the evapotranspiration process and partly goes to the sea as a runoff. The available energy and soil moisture are the most im-portant physical factors which limit the amount of evapotranspiration. On the other hand, the species of plants which cover the earth surface, as well as their development stage, are the most important biological factors. So, models which simulate water balance, independently of simulation scale, should include parameterisation of both, physical and biological processes which occur in the environment.
In recent years, many papers on modelling of heat and water balance components in different scales have been published, i.e. Thom and Oliver (1977); Holtslag
and Van Ulden (1983); Morton (1983); McNaughton and Spriggs (1985); Sellers and Dorman (1986); Ko-vacs (1988), Holtslag and De Bruin (1988); Olejnik (1988a,b); Van De Griend and Van Boxel (1989); Olejnik and Kedziora (1991); Beljaars and Holtslag (1991); Olejnik (1996); Wegehenkel (1997a). These models can be applied at different scales: from a field to regional scale, but with the increase in scale some important problems occur (i.e. availability of input data such as soil moisture for large areas). One of the most important problems during the procedure of modelling the water balance is coupling atmo-spheric and land surface processes. The characteristic length of atmospheric processes is said to be 100 km (Kundzewicz, 1990), while the characteristic length of surface processes is smaller by many orders of magnitude (down to cellular scale for many biologi-cal processes). Land surface processes are too small, too fast, too numerous and too heterogeneous to be represented explicitly in models, and therefore, the parameterisation of these processes is necessary.
Recently, at ZALF (Institute of Landscape Modelling) the THESEUS model was developed (Wegehenkel, 1997a, 2000). Using this model, it is possible to estimate the evapotranspiration of a chosen agricultural field (or landscape) with a one day time step. To evaluate the results obtained using THESEUS (i.e. toolbox for hydro-ecological simu-lation and evaluation utilities) model, measurements of evapotranspiration were made in some selected fields in the eastern part of Germany and the western part of Poland. To estimate evapotranspiration, the heat balance components of the selected fields were measured using the modified Bowen ratio method.
2. Investigation sites
The measurements were carried out in the neigh-bourhood of Müncheberg, state Brandenburg, East Germany, and Turew, state Wielkopolska, West Poland (52◦ tively). The elevation of both sites is about 80 m. In Turew and Müncheberg, the climate is transitional (between continental and marine), with moderate tem-perature (8.3◦C — annual average) and air humidity (78 and 81% in Turew and in Müncheberg, respec-tively), low measured precipitation (annual 530 mm in
both sites). Relative sunshine is moderate in summer (42 and 45% in Turew and Müncheberg, respectively) and low in winter (18 and 19%). Global radiation differs a little between these two sites, reaching dur-ing a year 3600 MJ m−2 in Turew and 3700 MJ m−2 in Müncheberg, while net radiation is near the same (about 1470 MJ m−2) at both sites. Soils in Turew and Müncheberg are mainly light to moderate textured sandy loam and loamy soils with moderate organic matter content. Ground water level ranges between 0.5 and a few meters below the ground surface. The soils have low (sandy soil) to moderate water reten-tion. Intensive agriculture and many forests create a mosaic landscape.
3. Methods of modelling and measurements
3.1. The THESEUS model
The modelling system THESEUS from Wegehenkel (1997a, 2000) was used in this study. This modelling system consists of different sub-models for the atmo-sphere, plant and soil, which can be combined to build an appropriate simulation model for a wide range of purposes and data bases in the context of water bal-ance and crop production modelling. A overview of the modules in THESEUS is given in Table 1.
Table 1
Components of THESEUS model (Wegehenkel, 2000)a
Model section and its output Model equation Input data requirements Atmosphere modules
ETP According to Haude (1955) D,k
ETP According to Turc (1961) Rn,T
ETP According to Penman (1948) Rn,T,D,u
ETPb According To Wendling et al. (1991) Rn,T,D,u
ETP According to Penman–Monteith
(Monteith and Unsworth, 1990)
Rn,T,D,u
Plant model modules
ETR Specific crop type correction
coeffi-cient (ETP/ETR) according to Spon-agel (1980)
Crop type
Plth,Rt, Sdg, INT, TR, ETRb Plant model according to Koitzsch and Günther (1990) in combination with sum of effective temperature
Crop type,T
Plth,Rt, Sdg, INT, TR, ETR, LAI, Biom Plant model according to Stenitzer (1988) in combination with Penman–Monteith approach
Crop type,T, plant data
Soil water dynamics modules
EVP, Perc, next dayθ One layer (dimension) plate-theory model according to Renger et al. (1974)
Initial values ofP,θ, FC, PWP
EVP, Perc, next dayθb Plate-theory model in combination with nonlinear storage routing (Glugla, 1969; Wegehenkel, 2000)
Initial values ofP,θ, FC, PWP
EVP, Perc, Inf, CAP,I, next dayθ Darcy-model SAWAH (Ten Berge et al., 1995)
Initial values ofP,θ, pF,K
aBiom: biomass (kg ha−1); CAP: capillary rise (mm per day);D: saturation water vapour pressure deficit (g cm−3); ETP: potential evapotranspiration (mm per day); ETR: actual evapotranspiration (mm per day); EVP: actual evaporation (mm per day); FC: field capacity (vol.%, mm dm−1); pF: soil water retention function;I: infiltration (mm per day); INT: interception (mm per day); K: soil hydraulic conductivity (m per day);k: plant specific coefficient; LAI: leaf area index (m2m−2);P: precipitation (mm); Perc: percolation (mm per day); Plth: plant height (cm); PWP: permanent wilting point (vol.%);Rn: net radiation (J cm−2);R
t: rooting depth (cm); Sdg: soil covering degree (%);T: daily average air temperature (◦C); TR: actual transpiration (mm per day);u: wind speed (m s−1);θ: soil water content (vol.%).
bModules which have been used in modelling procedure described in this paper.
sufficient from a scientific as well as from a manage-ment point of view. This corresponds to a potentially wide range of applications. Each modelling approach has its specific restrictions taking into account the dif-ferent demand of input data and the range of difdif-ferent simulation results. Therefore, THESEUS can be ap-plied not only in different land-use conditions but also in different climatic conditions. The important advan-tage of the model is the possibility of application in different scales-from a field to regional scale.
In our investigations, the following modules of THESEUS were used (Table 1, footnote b):
1. ETP calculated with the Wendling formula; 2. Determining transpiration, evapotranspiration and
interception based on the semiempirical plant
model according to Koitzsch and Günther (1990); and
3. Soil water balance with a multiple layer model combined with a nonlinear storage routing tech-nique according to Glugla (1969) (Wegehenkel, 2000).
To control values of modelled soil moisture during the measurement periods the time domain reflectome-try (TDR) method was used (Topp and Culley, 1989). It integrates the volumetric water content of a soil pro-file along the length of a pair of metal rods (anten-nas) that must be driven into the ground. The method produces reliable and comparable results to gravimet-ric measurements (Jenkins, 1989) in soils low in clay content and electrolytes as in this study. Simulated by the model soil moisture content agreed closely with time domain reflectometry measurements and during the measurement periods there were not need to do corrections.
The time resolution of the THESEUS model is 1 day, and therefore, it needs as inputs standard meteoro-logical data (air temperature, precipitation, etc.) with the same time resolution.
3.2. Heat balance components measurements
3.2.1. Description of the measurement system
To measure the radiation fluxes, the CNR-1 sensor is used. The CNR-1 consists of upward and downward facing pyranometers and upward and downward facing pyrradiometers, which are used to measure incoming and outgoing short- and long-wave radiation fluxes, respectively.
Soil heat fluxes were measured using commercial soil heat flux plates, 10 plates were placed at the depth of about 0.03 m.
Five psychrometers were used to measure the pro-files of air temperature and water vapour pressure using quartz crystal thermometers (Olejnik, 1988b, 1996). The oscillation frequencies of the quartz crys-tal depends only on temperature and can be measured over long distance of signal wire.
Electrical signals from all sensors are measured by milivoltmeter or frequencymeter installed inside the data logger via channel selectors. The data logger is also responsible for channel selectors control and dur-ing the measurement procedure all data are stored in data logger memory. The end task of the data logger is to control the ventilation system of the psychrome-ters. Five commercial aspirators are used which start to work 3 min before the measurement cycle begins.
All measurement conditions (time of data collec-tion, numbers of sensors, etc.) can be changed by the operator using the main computer (PC). The standard
measurement cycle consists of: 60 measurements of dry- and wet-bulb temperature measurements at five levels, 60 measurements of short- and long-wave radi-ation and 60 measurements of soil heat flux. One mea-surement cycle takes about 25 min, and in standard mode, is repeated every hour of the day (24 times). After the measurement procedure, the collected data are stored on PC hard disk. The whole system needs 12 V power supply.
3.2.2. Description of calculation methods
The energy balance equation can be written as fol-lows:
Rn+LE+S+G=0 (1)
whereRn is the net radiation flux density,LEthe la-tent heat flux density (L is the heat of water vapor-isation and E the evapotranspiration), S the sensible heat flux density andGthe soil heat flux density (all fluxes incoming to the active surface are positive and all outgoing are negative).
The Bowen ratio is defined as follows:
β= S
LE (2)
Using Eqs. (1) and (2), it is possible to calculate the latent and sensible flux density using the so-called Bowen ratio method:
whereE, the evapotranspiration rate, can be calculated from dividingLEvalue byL.
It is known that latent (LE) and sensible (S) heat flux densities are proportional to water vapour and air temperature gradients, respectively (Monteith, 1975), as follows:
cp the specific heat of air and KV and KH the eddy diffusivities for water vapour and heat, respectively.
From Eqs (2), (5) and (6) and assuming thatKV≈ KH, the Bowen ratio can be expressed as follows: β =γδT /δz
δe/δz (7)
In measurement practice, the gradients in Eq. (7) are replaced by differential quotients (Black and Mc-Naughton, 1971; Monteith, 1975)
wheree1ande2 are water vapour pressure measured at two levels 1 and 2,T1andT2the air temperatures measured at two levels 1 and 2, andz1andz2the height above the ground of two measurement levels 1 and 2. The Bowen ratio method of LE and S estimation described above, is commonly used by many inves-tigators (Spittlehouse and Black, 1981) and there are even commercial measurement units, based on this method. Unfortunately, using only two measurement levels there is a possibility of errors when measure-ments are carried out in a patchy landscape. Tem-perature and water vapour sensors must be located within the internal boundary layer characteristic of the ecosystem under investigation (fetch). The only way to meet the fetch requirements, using only two layers of measurement, is to carry out the measurements of latent and sensible heat fluxes above relatively large fields. In Middle Europe the landscape is often very patchy and it is hard to meet the fetch requirements. Therefore, the modification of Bowen ratio method was proposed by Olejnik, 1996 in which, air temper-ature and water vapour are measured at five heights. The advantage of several measurement heights is that height of the adjusted surface layer or internal bound-ary layer can be identified. Having the data on air tem-perature (Tz) and vapour pressure (ez) at five levels it is possible to estimate both as a function of height as follows:
Tz=f1(z) (10)
ez=f2(z) (11)
wherezis height above the ground.
In Eqs. (8) and (9), the differential quotients can be replaced by the derivatives of functions described in Eqs. (10) and (11) (i.e. df1/dzand df2/dz).
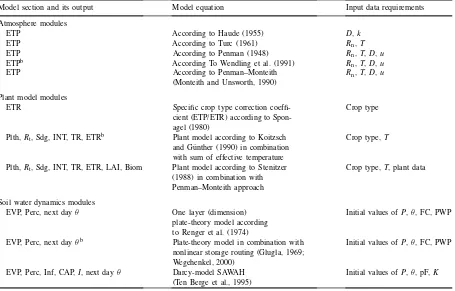
The calculation of latent (LE) and sensible (S) heat fluxes by the use of modified Bowen ratio method is shown on the basis of one selected measurement cycle of air temperature and vapour pressure profiles (Fig. 1). Using the psychrometric equation the water vapour data are calculated on the basis of dry- and wet-bulb temperatures at five levels. The results of the calculations for 40 profile series during one measure-ment cycle is shown in Fig. 1a. On the basis of these profiles, mean values of air temperature (T) and wa-ter vapour pressure (e) at five levels were calculated (Fig. 1b). Using statistical and numerical methods, the air temperature and vapour pressure, as functions of height, can be found (Eqs. (10) and (11), solid line in Fig. 1b). The result of calculations ofLE andS are shown in Fig. 1c.
After determination of all four components of heat balance equation (Eq. (1)), evapotranspiration can be calculated from latent heat flux density. These values obtained from measurements were then compared with evapotranspiration simulated by THESEUS.
3.3. Measurement periods and types of surfaces
The measurements were carried out during 8 pe-riods in the fields near Turew and Müncheberg. In Turew, measurements were made in alfalfa and sugar beet crops as well as a bare soil, while at Müncheberg, measurements were made in oat, wheat and sun-flower crops. Measurements during period from 1–4 were carried out in Turew and periods from 5–8 in Müncheberg. The lengths of measurement periods varied from 7 days (periods 6–8 in Müncheberg) to 16 days (periods 3 and 4 in Turew). The whole measurement set consisted of 81 days.
4. Results and discussion
Fig. 1. The results of applications of measurement system for modified Bowen ratio method: (a) results of measurements of air temperature and water vapour pressure profiles; (b) statistical approximation of functionsez andTz on the basis of measurements and calculations of
mean profiles; (c) latent (LE) and sensible (S) heat fluxes estimation as a function of height (z).
for all measurement periods are shown in the upper part of Fig. 2. The daily rate of evapotranspiration (measured and modelled) for all eight measurement periods is shown in Fig. 3. The measurement sites and time of investigation were chosen to cover not only different plants (see Section 3.3) but also differ-ent weather conditions. Therefore, measuremdiffer-ents were carried out in varied conditions (from the point of view of mean daily air temperature (T), daily rainfall (P) and type plant cover): dry and warm with plants (P1, T = 14.2◦C,P =1.7 mm per day, alfalfa), dry and
warm without plants (P2,T =14.2◦C,P =1.7 mm per day, bare soil), dry and cool with plants (P4,T = 9.3◦
C,P =1.6 mm per day, sugar beet), dry and cool without plants (P3,T =9.4◦
C,P =1.7 mm per day, bare soil), wet and warm with fully developed plants (P7, T =13.2◦C, P
Fig. 2. Comparison of averages (or sums) of meteorological parameter, heat balance components and evapotranspiration of eight measurement periods (P1–P8).
periods P6 and P7 the significant precipitation was ob-served every second day (including a heavy storm on 13 June 1995 when rainfallP =23.9 mm). Because of such different conditions the results of measurements of heat balance components varied significantly: net radiationRnfrom 9 Wm−2on 24 September 1997 for bare soil to 232 Wm−2 on 12 June 1994 for oat, in these days latent heat flux varied from−10 Wm−2to −203 Wm−2, respectively. Also, the ratio of ETR/ETP varied significantly, from 0.21 on 6 September 1995 — bare soil, to almost 3 on 9 June 1995 — wheat (that day, the average temperature decreased by 2.8◦C in comparison with the day before, ETP was only 0.3 mm while ETR 0.9 mm). The different canopy and weather conditions caused variation of daily evapotranspiration
rate: from 0.3 mm on 24 September 1997 (P3, bare soil) to 7.2 mm on 12 June 1994 (P5 oat) (Fig. 3).
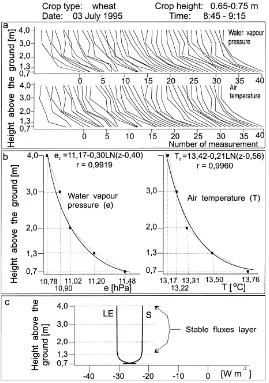
Fig. 3. Comparison of evapotranspiration estimated by THESEUS model (ETR(T)) and calculated from latent heat flux measurements by the use of modified Bowen ratio method (ETR(B)) for 81 days (8 measurement periods (P1–P8)).
(period P2) to 1 and more (periods P5–P8). The high values of ETR/ETP ratio were noted during measure-ment periods with favourable conditions for strong evapotranspiration (well developed plant canopy, high temperature and moist upper soil layer).
and 165.2 mm, respectively. The difference is 8.9 mm means that the relative error of estimation of evapo-transpiration by the THESEUS model is about 5% for 81 days of comparison. The relative error of estima-tion of the daily rate of evapotranspiraestima-tion was calcu-lated using the following formula:
REE=ETR(T)x−ETR(B)x ETR(B)x
(12)
where REE is relative error of estimation,xthe day number in the individual measurement period.
For the whole set the average absolute daily error is equal to 0.1 mm.
In Fig. 4, the relationship between the daily values of evapotranspiration estimated by both methods are shown. The linear regression was calculated on the basis of the whole data set. It is easy to see that the THESEUS model underestimates daily rate of evap-otranspiration (particularly for evapevap-otranspiration rate greater than 2 mm per day). The regression equation for the whole set is as follows (r=0.958):
ETR(B)=1.15 ETR(T)−0.22 (13) Additionally, in Fig. 4 the results of REE calcula-tions (Eq. (12)) are presented for all eight measure-ment periods separately and for the whole data set.
Fig. 4. Comparison of evapotranspiration simulated by THESEUS (ETR(T)) and calculated from latent heat measured by the use of modified Bowen ratio method (ETR(B)).
In the case of the three periods, the REE was≥10%. The measurement of periods 1 and 2 were carried out at two fields (P1 alfalfa, P2 bare soil) in the same time from date 2 September 1995 to 11 September 1995. The summer 1995 was extremely dry (only about 40% of long term average precipitation did occur). The measured cumulative evapotranspiration of alfalfa was 18.0 mm, while the simulated value was 16.2 mm. In this case, THESEUS underestimated the daily evapo-transpiration because the model is based on calculat-ing the soil moisture of the upper layer (0–90 cm). The upper layer of soil in that summer was very dry but alfalfa has a very deep root system which allowed the use of soil water from deeper layers. Under such ex-treme precipitation conditions the relative error of the THESEUS estimation is still at an acceptable level. At the same time measurements were carried out on bare soil (period P2). This time the evapotranspiration esti-mation by THESEUS was higher by about 30%. The measurement site was called bare soil but in fact about 30–40% of the field was covered with straw (lying in rows after harvesting). The straw layer decreases sig-nificantly the rate of evaporation (under the straw the soil was wet). The THESEUS model structure does not allow the inclusion of such conditions (straw on bare soil), and consequently, for that period (period P2) the estimation by the model was made for bare soil. So, the very high relative error of evapotranspira-tion estimaevapotranspira-tion for period P2 (30%) results not from an incorrect parameterisation for bare soil used in THE-SEUS but rather from the absence of an appropriate part in the THESEUS model (bare soil partly covered by straw).
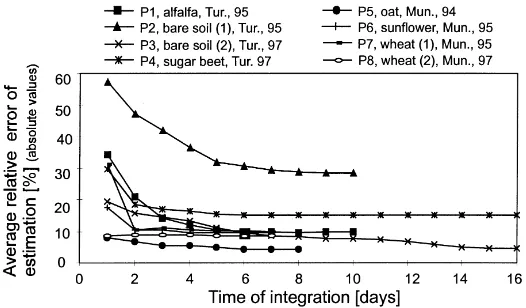
Fig. 5. Relative error of evapotranspiration estimation by THESEUS model for 81 measurement days.
field was 14 Wm−2 on 22 September 1997. For the whole period P4 the ratio ETR/ETP was equal to 1.26 (Fig. 2). The comparison of ETR(B) and ETR(T) for period P4 suggests that if the THESEUS is used for evapotranspiration estimation on the landscape scale special attention should be paid to areas with possi-ble advection, otherwise the error of estimation can be significantly high.
The REE of the daily rate of evapotranspiration (Eq. (12)) decreased with increasing daily evapotran-spiration rate (Fig. 5). If the daily rate of evapotranspi-ration is low (0.5 mm or less) then the REE can be very high (for 0.5 mm about 45%). The measurement points with high relative error mainly come from period P2 (bare soil with straw). The reason for such a poor
es-Fig. 6. Relative error of evapotranspiration estimation by THESEUS model in function of integration time (separate for eight measurement periods).
the REE of daily rate of modelled evapotranspiration is about 7%. On day 12 June 1994 (period P5 — oat) the highest evapotranspiration was measured, 7.2 mm per day (Fig. 3, P5), the average sensible heat flux density was −28 Wm−2 whileLE was−203 Wm−2. The value of 7.2 mm per day is close to the maximum value that is possible under Central Europe climato-logical condition. Even for such a day (extreme high net radiation, Rnwas equal to 232 Wm−2) the THE-SEUS simulation shows a very good agreement with the measurements: ETR(T) is equal to 6.1 mm per day, which is only 15% less than measured.
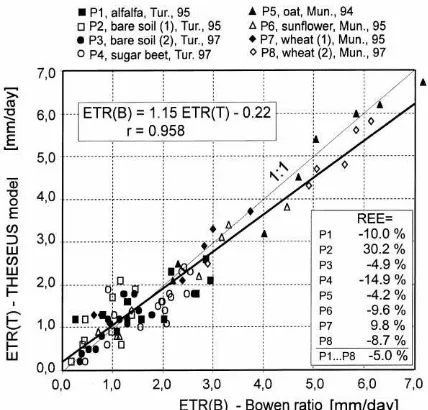
Finally, the changes of average relative error of es-timation (AREE) of the evapotranspiration simulation by the THESEUS model was calculated as a function of integration time. In Fig. 6, the results of such an analysis are shown. The time of integration for calcu-lations of AREE was extended to the length of every measurement period (from 7 to 16 days — Fig. 6). It can be seen that AREE only in periods P5 and P8 (oats and wheat) for 1 day of integration is smaller than 10%. But if the AREE is calculated for time of integra-tion longer than 5 days then it comes to that level for almost all measurement periods. Only in case of peri-ods P2 and P4 is the AREE value still high even for the maximum time of integration (10 and 16 days, respec-tively). For period P2 it is again the “straw problem” of bare soil evaporation simulation by the THESEUS model. For period P4 it is the influence of advection on the heat balance structure of the sugar beet field, which currently cannot be included in the model.
5. Summary and conclusions
Investigations of the heat and water balances of large areas are of crucial importance for landscape evolution and sustainable development of agriculture. Measurements of heat and water balance components (HWBC) are rather expensive and time consuming, moreover, it is almost impossible to measure these components for large areas. The promising solution for HWBC estimation for large areas is the remote sensing technique. However, this new tool for HWBC estimation cannot be applied without “ground truth” studies like these presented in this paper. Although a lot of investigations have been done during re-cent years, potentially promising applications of this
remote sensing technique are still in its infancy. Therefore, it seems that simulating of heat and water balance components with evapotranspiration models for large areas is the appropriate solution. HWBC es-timation results are necessary for many fields of inves-tigations: environment planing, agriculture, forestry, water supply, ecology, climatology, etc. Because of this great potential of applications in so many areas it is extremely important to develop high resolution models which can estimate heat or water balance components on the basis of easy available data. The THESEUS model which was developed at the ZALF, can be found as a very high quality tool for estimation of evapotranspiration on different scales: from field to landscape, if the required input data are available.
On the basis of measurement results from a modi-fied Bowen ratio method and the THESEUS modelling procedure the following conclusions can be drawn: 1. The presented measurement system for heat
bal-ance components estimation proves to be satis-factory for carrying out measurements in patchy landscape.
2. The modification of the Bowen ratio method al-lows a control of the quality of measurement re-sults of heat balance components and to calculate the turbulence flux densities (LE and S) for the adequate developed internal boundary layer. 3. The average relative error of evapotranspiration
estimation by the THESEUS model is about 10% for 10 days of integration time and decreases to about 5% for longer time of integration.
4. If the THESEUS model is used for evapotranspi-ration estimation in the landscape scale, special attention should be paid to areas with possible ad-vection, otherwise the error of estimation can be significantly high.
5. In order to achieve a better agreement between measured and modelled values of evapotranspi-ration, a correction equation should be used (on average ETR(T) was smaller then ETR(B) by 0.1 mm per day, ETR(B)=1.15 ETR(T)−0.22). 6. The relative error of evapotranspiration estimation by the THESEUS model is smaller for higher daily rates of evapotranspiration.
Acknowledgements
The few years project was partly supported by the German – Polish Scientific Co-operation Program, by The Alexander von Humboldt Foundation and by the KBN-6-P04-019-15 project. The authors are grateful to their colleagues from ZALF, RCAFE and ADU for their help during field measurements. A special thanks to Dr. Martin Wegehenkel from ZALF for his assis-tance during modelling procedures.
References
Black, T.A., McNaughton, K.G., 1971. Psychrometric apparatus for Bowen ratio determination over forests. BLM 1, 246–254. Beljaars, A.C., Holtslag, A.A.M., 1991. Flux parameterization over land surfaces for atmospheric models. J. Appl. Meteorol. 3, 327–341.
Glugla, G., 1969. Berechnungsverfahren zur Ermittlung des aktuellen Wassergehaltes und Gravitationsabflusses. Albrecht. Thaer. Archiv. 13, 371–376.
Haude, W., 1955. Zur Bestimmung der Verdunstung auf möglichst einfache Weise. Mitt. des Deutschen Wetterdienstes, 11, Bad Kissingen.
Holtslag, A.A.M., De Bruin, H.A.R., 1988. Applied modeling of the nighttime surface energy balance over land. J.Appl. Meteorol. 27, 659–704.
Holtslag, A.A.M., Van Ulden, A.P., 1983. A simple scheme for daytime estimates of the surface fluxes from routine weather data. J. Appl. Meteorol. 22, 517–529.
Jenkins, D.R., 1989. Improved field probes for soil water content and electrical conductivity measurements using time domain reflectometry. Water Resour. Res. 25, 2367–2376.
Koitzsch, R., Günther, R., 1990. Modell zur ganzjährigen simu-lation der verdunstung und der bodenfeuchte landwirtsch-aftlicher nutzflächen. Arch. Acker-Pflanzenbau Bodenkd. 24, S717–S725.
Kovacs, G., 1988. Comparison of models interrelating multiannual precipitation and actual areal evapotranspiration. J. Hydrol. 66, 1–76.
Kundzewicz, Z.W., 1990. Water sciences at the threshold of the 21st century; are we preparing sufficiently for the global changes likely to occur? In: Proceedings of the Commemorative Symposium on 25 years of IHD/IHP, UNESCO, Paris, pp. 159–167.
McNaughton, K.G., Spriggs, W.T., 1985. A mixed-layer model for regional evaporation. BLM 34, 243–262.
Monteith, J.L., 1975. Vegetation and the Atmosphere, Vol. 1. Principles. Academic Press, London, 278 pp.
Monteith, J.L., Unsworth, M.H., 1990. Principles of Environmental Physics. Edward Arnold, New York.
Morton, F.J., 1983. Operational estimates of evapotranspiration and their significance to the science and practice on hydrology. J. Hydrol. 66, 1–76.
Olejnik, J., 1988a: Present and future estimates of evapo-transpiration and runoff in Europe. IIASA Working Paper WP-88-037, p. 15.
Olejnik, J., 1988b. The empirical method of estimating mean daily and mean ten-day values of latent and sensible-heat near the ground. J. Appl. Meteorol. 12, 1358–1369.
Olejnik, J., 1996. Catchment scale modelling of heat and water balance structure under present and future climatic conditions. Rocz. AR. Poz., Z. 268, 125 pp. (in Polish).
Olejnik, J., Kedziora, A., 1991. A model for heat and water balance estimation and its application to land use and climate variation. Earth Surface Proc. Landforms 16, 601–617.
Penman, H.L., 1948. Natural evaporation from open water, bare soil and grass. Proc. R. Soc. London A 193, 120–145. Renger, M., O. Strebel, K., Giesel, W., 1974. Beurteilung
bodenkundlicher kulturtechnischer und hydrologischer Fragen mit Hilfe von klimatischer Wasserbilanz und bodenphysi-kalischen Kennwerten 1.Bericht: Beregnungsbedürftigkeit. Z.f. Kulturtechnik u. Flur-bereinigung 15, H.3.
Sellers, P.J., Dorman, J.L., 1986. Testing the simple biosphere model (SiB) using point micrometeorological and biosphere data. J. Clim. Appl. Meteorol. 26, 622–651.
Spittlehouse, D.L., Black, T.A., 1981. A comparison of reversing psychrometric Bowen ratio measurement systems. Atmos. Ocean. 19, 372–379.
Sponagel, H., 1980. Zur Bestimmung der realen Evapotranspiration landwirtschaftlicher Kulturpflanzen. Geol. Jahrbuch, Reihe F, H.9, Hannover.
Stenitzer, E., 1988. Ein numerisches Modell zur Simulation des Bodenwasserhaushaltes und des Pflanzenertrages eines Standortes. Mitt. aus der Bundesanstalt für Kulturtechnik und Bodemwasserhaushalt, No. 31.
Ten Berge, H.F.M., Metselaar, K., Jansen, M.J.W., San Agustin, E.M., Woodhead, T., 1995. The Sawah riceland hydrology model. Water Resour. Res. 31 (11), 2721–2731.
Thom, A.S., Oliver, H.R., 1977. On Penman’s equation for estimating regional evaporation. Q. J. R. Meteorol. Soc. 103, 345–357.
Topp, G.C., Culley, 1989. Correcting soil volumetric water content from a direct reading time domain reflectometry instrument (IRAMS). Can. J. Soil Sci. 69, 701–704.
Turc, L., 1961. Evaluation des besoins en eau d’irrigation evapotranspiration potentielle. Ann. Agron. 12, 13.
Van De Griend, A.A., Van Boxel, J.H., 1989. Water and surface energy balance model with a multilayer canopy representation for remote sensing purpose. Water Resour. Res. 25, 949–971. Wendling, U., Schellin, H.G., Thomä, M., 1991. Bereitstellung von
täglichen Informationen zum Wasserhaushalt des Bodens für die Zwecke der agrarmeteorologischen Beratung. Z. Meteorol. 41 (H.6), 1–16.
Wegehenkel, M., 1997a. SVAT-Modellierung auf GIS-Basis am Beispiel der Agrarlandschaft Chorin. Arch. für Natl.-Lands 36, 149–164.