Farm sustainability evaluation: methodology and practice
M. Andreoli
a,∗, V. Tellarini
baUniversity of Pisa, Dip. Economia Aziendale, Via C. Ridolfi 10, 56124 Pisa, Italy
bUniversity of Pisa, Dip. Economia dell’Agricoltura dell’Ambiente Agro-forestale e del Territorio, Via del Borghetto 80, 56124 Pisa, Italy
Accepted 19 July 1999
Abstract
For a very long time, agricultural policy has been interested only in productive or economic aspects. Nevertheless, in-terventions aiming to support farmers’ income or to promote agricultural modernisation have resulted in several ‘negative’ side-effects, such as increasing pollution, landscape depletion and deepening of regional disparities. Consequently, a need has emerged for confronting problems with a more comprehensive approach, taking into account the whole range of impacts caused by agriculture. The European Concerted Action on ‘Landscape and Nature Production Capacity of Sustainable/Organic Farms’ has proposed a checklist of criteria for sustainable landscape management. This article discusses procedures for summarising the above-mentioned criteria in an ‘overall judgement’. The aim is to provide a tool capable to assess farm performance taking into account all the relevant impacts of farm activities.
Firstly, the paper discusses issues related to information quality, focussing on the differences in procedures for processing quantitative and qualitative data. Secondly, the article analyses methods suitable for reaching an overall judgement based on several criteria. Thereafter, it discusses their application to a set of case study farms or to farm typologies, which can be obtained by processing data from statistics or ad hoc surveys. Advantages and drawbacks of the use of case studies and farm typologies are given while their integrated use is recommended.
Two types of methodologies are presented. The first methodology, to be preferred if time, information or financial resources are not lacking, transforms initial information into Utility values and processes the latter by using more sophisticated tech-niques, such as multiple criteria analysis. The second uses a simplified approach, transforming initial data on the base of quartiles and then summing them up without any weighting. The advantages of this method are an easy implementation and a methodology that can be understood by decision-makers and administrators, who do not have a background in statistics.
Conclusions stress the importance of a more comprehensive approach in setting agricultural policies, since farming ac-tivity influences landscape and environment quality besides other important features. From this viewpoint, decision-makers have to be able to foresee the whole range of effects induced from policy, to avoid ‘unexpected side-effects’. Regarding Landscape Management, interventions aiming to promote the introduction or reintroduction of single landscape elements can give different results from those that were expected. Consequently, subsidising farm typologies or styles of farming that have been proved to have a positive effect on landscape could be a more reliable approach. Farm typologies or styles of farming to be
∗Corresponding author. Tel.:+39-050-945-315; fax: +39-050-541-403 E-mail address:[email protected] (M. Andreoli)
promoted could be selected on the base of their ‘social’ performance, assessed according to a multi-dimensional approach as the one presented in this article. ©2000 Elsevier Science B.V. All rights reserved.
Keywords:Farm evaluation; Sustainable agriculture; Multi-criterial analysis; Tuscany; Farm accountancy network; Landscape production; Environment; Italy
1. Introduction, ‘a holistic view toward farm sustainability’
For a very long time, science has used a reduc-tionistic approach that has led to an increasing spe-cialisation. Projects have mainly involved researchers working in the same scientific field, deepening knowl-edge on specific topics, but without reaching a full un-derstanding of phenomena. Thus, even interventions based on research have been unidimensional, such as those of increasing income level, landscape preserva-tion, environmental protecpreserva-tion, etc. and they have been aiming to achieve only one goal. Nevertheless, rather than having only the intended effect, these interven-tions have often caused other unforeseen ‘side-effects’. In Italy, during the last two decades, applied research in agriculture has started broadening its interests, e.g. taking into account: (i) the socio-economic impact of farm activities, especially in marginal and rural areas, for instance in the National Research Projects I.P.R.A. and R.A.I.S.A. (Andreoli and Tellarini, 1998); (ii) their environmental impact (see, e.g. Accademia Nazionale di Agricoltura, 1991); and (iii) the need for counter-acting the impacts on landscape of farm specialisation (Chiusoli, 1994).
In recent years, an increasing need has emerged to study phenomena from a holistic point of view. This approach is necessary for providing pub-lic decision-makers with tools capable of coping with multi-dimensional problems, thus considering ‘ex-ante’ impacts that with a unidimensional approach would cause the emerging of ‘ex-post’ side-effects.
This article proposes procedures for providing an overall assessment of farms on the basis of the table of criteria proposed by the European Concerted Ac-tion on ‘Landscape and Nature ProducAc-tion Capacity of Sustainable/Organic Farms’. An overall judgement consents to assess farm performance accordingly to social goals and not merely private ones (Andreoli and Tellarini, 1995), thus individuating farm models and farm typologies that are satisfactory from the point of
view of the whole society. This is the first step for be-ing able to implement policies capable of promotbe-ing ‘sustainable’ farming. A review of the meaning and evolution of the concept of sustainability in agricul-ture is provided, for instance in Polinori (1998).
The first part of the article mainly deals with the problem of providing an overall judgement of case study farms and refers to a presentation given at one of the Concerted Action meetings (Andreoli et al., 1998). The second part focuses on the use of statistical infor-mation, giving an example of data processing based on the data of the Italian Network of Farm Accountancy (R.I.C.A.) for Tuscany. The main aim of the Network of Farm Accountancy is to study farm performance from an economic point of view. Consequently, the information provided presents drawbacks when used for different aims, for instance for analysing the im-pact of agriculture on the environment. Nevertheless, due to its importance as source of farm information at national level, R.I.C.A. data have been recently used for analysing sustainability and efficiency in the use of resources at farm level (Pennacchi et al., 1998).
2. A multiple criteria approach to farm performance evaluation
Besides analysing all the specific effects of farming, it would be useful to summarise the data in an overall judgement (or assessment) of farm performance, either in absolute or relative terms. Summarising data causes a loss of information relating to the performance on single criteria. Nevertheless, it consents having an as-sessment that can be used for ranking farms (or farm-ing styles) from the best to the worst, takfarm-ing into ac-count a whole set of characteristics. This section at-tempts to systemise some considerations relating to:
(i) The use of qualitative information.
(ii) The evaluation of criteria referring to conflicting objectives.
(iii) The possibility of carrying out an evaluation with only one object of analysis (case study).
Procedural issues have been stressed to allow other researchers to apply the same methodology.
2.1. The problems of qualitative data and different measurement units
Many of the parameters proposed by the Concerted Action members for the assessment of farm perfor-mance are not quantitative, for example landscape completeness or wholeness. Moreover, the cost of get-ting quantitative information is sometimes so high that, although it might be possible to measure a phe-nomenon exactly, it is preferable to use a ‘discrete scale’, for example income classes rather than a con-tinuous scale. Even qualitative data can be used, pro-vided that they can be ordered. However, having con-tinuous quantitative data for all the parameters does not necessarily mean that it is easy to reach an over-all judgement, in so far as it is necessary to cope with different units of measurement. This requires trans-forming values into a common unit of measurement, by means of normalisation or other procedures. Nor-malisation consists in transforming original data, ex-pressed in ‘physical’ units, into non-dimensional data, accordingly to a linear function usually ranging from 0 to 100.
Conversion of data expressed in physical units into a ‘common’ measurement unit can be done by trans-forming criteria into objectives (e.g. Colorni and La-niado, 1988, 1992). In this case, since all parameters are expressed in terms of Utility, high values always have a ‘positive meaning’. When it is possible to set
a target, for instance an optimal share of fodder crops or a satisfactory level of income, for a parameter, this transformation can be achieved by giving score ‘1’ when the target is achieved and ‘0’ when it is not. Nevertheless, since this method provides an extremely rough measurement scale, where only two values are allowed, it is usually necessary to find a different procedure.
2.1.1. Qualitative ordinal or quantitative discrete data?
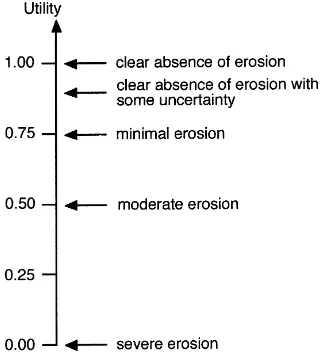
Giving the same polarity to all parameters is also possible when more than two situations are allowed. Let us take the case of erosion in the analysis of two case study farms by (Rossi et al., 1997, Rossi and Nota, 2000), which was performed using a five-step scale, where each step was represented by a symbol associated to a ‘real’ situation. The five-step scale was chosen since the quality of information was judged to be insufficient for a finer scale. For example, in the case of erosion the observed situations associated to symbols were the following:
(i) Clear absence of erosion ++
(ii) Absence of erosion with some uncertainty + (iii) Minimal erosion (without consequences) ±
(iv) Moderate erosion −
(v) Severe erosion − −
Starting from this example, it is important to under-line that;
1. In the foregoing example, criteria have been al-ready transformed in objectives, in so far as the symbol ‘++’ is not associated to the highest value of erosion but to the ‘most positive situation’, i.e. clear absence of erosion. If symbol ‘++’ is, for all criteria, associated with the best situation (and not with the highest value) and symbol ‘− −’ with the least desirable, the criteria scales have all the same polarity;
3. To make comparisons between parameters or be-tween objects of analysis, it is necessary to state the procedures used for ‘calibrating the scale’. Calibrating a scale means, as in the case of a thermometer, establishing to which situation the highest value is associated (100◦C to boiling wa-ter) and to which the lowest one (0◦C to freezing water).
Regarding point two above, although software usually requires information to be codified as num-bers even if they are qualitative data, it is important for researchers to use methods suitable to the in-formation to be processed. Let us take up again the above-described case of erosion; the symbols of the example could be converted into numbers, as follows:
Symbol ++ + ± − − −
Value 1.00 0.75 0.50 0.25 0.00
In this case, the maximum satisfaction (1.00) is at-tributed to the situation of ‘clear absence of erosion’ and the minimum (0.00) to the case of ‘severe ero-sion’. The rest of the scale is divided into equal steps, as in the case of a thermometer. However, the satis-faction provided by a situation of ‘clear absence of erosion with some uncertainty’ is very much closer to that of ‘clear absence of erosion’ than to that of ‘min-imal erosion’. Again, this difference is smaller than that between ‘moderate erosion’ and ‘severe erosion’. Consequently, the above conversion is correct if ero-sion data are processed as qualitative, but, in our opin-ion, it is not correct if these ‘erosion values’ are pro-cessed as discrete quantitative data. In the latter case, the scale between ‘clear absence of erosion’ and ‘se-vere erosion’ has to be divided in a way, which more correctly reflects differences in the impact of the ero-sion levels. Fig. 1 proposes an alternative converero-sion of symbols. The best and worst situations are still as-sociated to ‘1’ and ‘0’ levels of Utility, respectively, while the intermediate situations have a different dis-tribution. For instance, in this case the 0.5 level of Utility is associated with ‘moderate erosion’, while in the previous example it was associated with ‘minimal erosion’.
When quantitative continuous physical data are available, it is possible to have a utility scale that is continuous, rather than dichotomous or discrete. Given that the relationship between physical and
util-Fig. 1. Positioning of erosion situations expressed in physical terms on a Utility scale
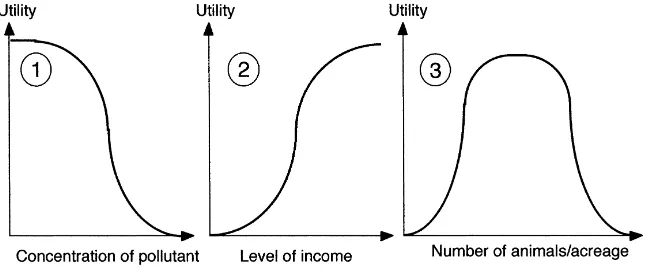
ity values is very seldom linear, it is necessary to define it case by case. According to the indices, the shape of the function converting physical data into utility values might vary. Fig. 2 shows three ‘typical’ shapes of Utility functions, that in the text are referred to as Graphs 1, 2 and 3. Graph 1 shows an inverse relationship between the physical parameter (concen-tration of pollutant) and the Utility associated with it, so that as pollution increases Utility decreases. This relationship, as Graph 1 shows, is not linear, since it is assumed that the level of pollution has no negative effects on the environment, as long as the pollution level is very limited. As the pollutant concentration increases, the quality of the environment worsens, at first quite slowly and then ever more rapidly. In the second case (Graph 2), the relationship between phys-ical parameter (income level) and Utility is direct, in that as the income increases so does the satisfaction, but again the relationship is not linear.
In the third case (Graph 3), there is no consistently positive or negative relationship between the physical parameter and the Utility value. In the case of nat-ural population density, when the density is low, its increase determines an increase in Utility, in that the species is reaching optimum density levels. There is a range of optimum density within which the Util-ity function maintains its maximum level, but beyond which the satisfaction level decreases again.
Fig. 2. Examples of functions for converting parameters expressed in physical units into Utility terms
normalisation, which is based on a linear relationship. An example of application of a Utility function to a real case can be found in Ciani et al., 1993.
2.1.2. The importance of external points of reference
From the above example about erosion, it is easy to understand that, when processing Utility values as quantitative data, the conversion of the initial physi-cal values has to be done very carefully. Thus, in our opinion, the analysis should start by defining a con-version procedure that:
(i) Sets external points of reference for the minimum and maximum values of the scale, namely the phys-ical situations that correspond to value ‘0’ and value ‘1’ of the Utility function. In this way, the conver-sion is not influenced by the specific set of values included in the analysis;
(ii) Does not apply automatic conversions implying a linear transformation of data, but tries to define values that are representative of differences in sat-isfaction relating to real situations.
The minimum and maximum normalised value are usually attributed to a value (minimum, maxi-mum, average) which is dependent on the set of data that are normalised (Colorni and Laniado, 1988). Consequently, normalisation does not comply with the previously stated rules in so far as it usually employs internal points of reference and performs a linear conversion. Thus, when analysing only one case study, normalisation is not possible, but it is pos-sible to use Utility functions with external reference points. When the best situations achievable in the long term for each parameter are used as references for the
maximum Utility, the term of comparison for judg-ing the case study is a ‘Utopic Farm’. The concept of Utopic Farm, namely a farm that is able to reach contemporarily the best possible situation for all the conflicting objectives (for instance, achieving a high income, landscape conservation, good environmental quality, etc.), is similar to the concept of ‘Ideal Point’ often used in the case of multiple criteria analysis (e.g. Romero and Rehman, 1989).
External reference values may, or must, differ for different landscape types/regions; according to Hen-driks et al. (2000) an external point of reference cannot be global, but must be filled in regionally (e.g., Rossi et al., 1997). A Utopic region is needed as guiding image for farm development.
The way external reference points are chosen influ-ences the possibility of making comparisons among farms situated in different regions; for more details about the procedure for judging a single case study farm, see Andreoli et al. (1998).
2.2. Summarising all the information in an overall judgement
provided by vispa are the so-called ‘weighted sum’ and ‘best worst case’ methods.
2.2.1. The ‘weighted sum’ ranking method
The easiest way of summarising in an overall judge-ment utility data referring to a set of criteria is to sum up the value of all the criteria, after having multiplied each of them for the weight attributed to every crite-rion. Consequently, in this case, as in many others, for reaching an overall judgement it is necessary to decide if the criteria have, or not, the same importance, for instance if economic goals have the same importance as environmental ones. Although weighting criteria is a subjective operation (Colorni and Laniado, 1992), it is important to note that using the weighted-sum rank-ing method:
(i) not weighting criteria means using the same weight for all; and
(ii) using only the goal that is considered the most relevant means giving weight 1 to this and weight 0 to all the others, thus adopting a unidimensional approach.
It is sometimes difficult to reach a general agree-ment about weights, since costs and benefits are often unequally distributed among groups and every group tends to give higher importance to ‘its own’ costs and benefits than to the ones of other groups. Groups that have economic benefits from a polluting productive activity, for instance give a relatively high importance to economic aspects, especially if they do not suffer for the impact of pollution they cause; vice versa, res-idents tend to attribute a relatively high importance to the quality of environment, especially if they do not benefit (e.g. getting jobs) from the productive activity. Besides, since different situations can result in dif-ferent levels of importance given to (a) biotic, social and cultural needs (van Mansvelt, 1997; Stobbelaar and van Mansvelt, 2000), it is not possible to set a system of weights that could be generally applied.
In case a general agreement about weights is not reached, researchers can try to control or to eliminate their influences on the results of the multi-criterial analysis by:
(i) performing a sensitivity analysis, for checking how much weights influence results;
(ii) repeating the analysis using several weight sys-tems; and
(iii) using ranking methods that do not make use of weights (Colorni and Laniado, 1992).
2.2.2. The ‘best-worst-case’ ranking method
Among the ranking methods that are not us-ing weights, there is the so-called ‘best-worst-case’ method. This consists in evaluating each alternative, for instance each farm, accordingly to the lowest level of utility observed among the criteria. In this case, minimising the risk of a bad choice is considered more important than summing up all the features in a global value of utility. By evaluating every alternative accordingly to the level of the less satisfactory feature this risk is reduced to the maximum, provided that utility levels are reliable (Colorni and Laniado, 1988, 1992).
In our opinion, the ‘minimisation-risk’ approach of the worst-case method should be partly introduced also into the weighted-sum method; this could be done by excluding from the analysis all the alternatives (e.g. farms and farming styles) that do not reach even the ‘acceptable’ level for all criteria. Only when this min-imum level has been achieved, it is possible to ‘nego-tiate between objectives’, that is to say, to allow that a relatively bad performance for one criterion could be compensated for by a relatively good performance for another criterion. The trade-off between objectives (criteria) is dependent on the weight system, namely on the relative importance of an objective in compar-ison to another one.
2.2.3. Advantages ofvispaapproach
vispasoftware provides a set of ranking methods capable of coping with different situations as regards: (i) quality of information (reliability of weight and
utility data); and
(ii) analysis aim (maximisation of the total utility, as in the case of weighted sum, or minimisation of some measure of risk or inequality, as in the ‘best-worst-case’ approach).
more than directly looking for the best alternative (Colorni and Laniado, 1992). Due to these features, vispasoftware has been used not only in the case of environmental impact assessment procedures, but also for analysing the impact of management alternatives in natural areas, for instance natural parks (Ciani et al., 1993; Feliziani, 1997).
At the farm level,vispacould be useful not only for ranking case study farms but also for processing data concerning farm typologies that can be individuated by means of statistical survey. This could allow ranking farm typologies according to their utility for the whole society and not only accordingly the achievements of farmers’ goals.vispaapproach mainly aims to elim-inate unsatisfactory alternatives and, consequently, it could provide a range of farm typologies that are all to be considered as satisfactory.
3. From case-study analyses to the use of surveys or statistical data
3.1. Characteristics of case study and survey approaches
Research can be performed either by selecting a few case studies and thoroughly examining them or by using statistical information or ad hoc surveys to analyse many units, albeit in a more superficial way. In our opinion these two approaches, when possible, should be combined, examining problems with both in depth and broad analyses.
Case studies allow researchers to work in depth, concentrating on the relationships existing between the components of a farm system. In addition, the selec-tion and analysis of farms with ‘optimal’ performances may allow transferring their techniques and strategies to other farms. However, this is not always possible, as case study farms may present characteristics so differ-ent from those of ‘normal’ farms that they prevdiffer-ent the implementation of similar strategies in other farms.
Surveys or statistical data usually provide less ac-curate or detailed information than a case study anal-ysis. Nevertheless, they can supply a picture of the situation at regional level. They can, therefore, show by how much case study farm performance is better than average and what kind of overall impact a
trans-fer of improved techniques would have in the area. Dynamic data could also allow researchers (and deci-sion makers) to monitor the results of policy interven-tion in terms of farm performance changes. From this point of view, in our opinion, the European Network of Farm Accountancy could provide important infor-mation, if modified for taking into account more data about ‘non economic’ performances.
3.2. Using Farm Accountancy Network data for a more ‘comprehensive’ approach
Italian Network of Farm Accountancy (R.I.C.A.) data have been recently used by Pennacchi et al. (1998) for analysing sustainability and efficiency of Italian farms. One of the products of this research has been a data bank including the information that have been utilised for building the two indices evaluating farm sustainability and efficiency in the use of potentially polluting resources. We have used this data bank to check which of the indices proposed by the Euro-pean Concerted Action on Landscape and Nature Pro-duction (van Mansvelt and van der Lubbe, 1999) can be calculated from R.I.C.A. data. The reason for us-ing the simplified data bank provided by Pennacchi rather than the original information is that the latter consists in hundreds of basic variables for each of the nearly 20 000 farms under survey, thus asking for more computer and time resources than were at the moment available. However, since the simplified data bank does not include all the R.I.C.A. data, the list of criteria represents a ‘minimum set’. Moreover, due to the fact that only partially processed data were avail-able (and not basic information), some of the values have to be considered as a ‘proxy’. All the values, ex-cept those referring to cattle units and crop surfaces, are expressed in monetary values; in the case of ratios between monetary values, the result does not depend from the monetary unit used:
1. Fodder crops area/total utilised area. 2. Cattle units/total utilised area.
3. Value of manure/value of manure and chemical fertilisers.
4. Value of pesticides/total utilised area (ECU/ha). 5. Farm labour income per labour unit/regional per
capita consumption.
7. Farm net income/regional per capita consumption. 8. Value of re-used inputs/total costs.
9. Proxy of the value of non-renewable inputs/total costs.
10. Gross production/proxy of the value of non-renewable inputs.
11. Net income/proxy of the value of non-renewable inputs.
12. Proxy of farm financial autonomy (net in-come/value of invested capital).
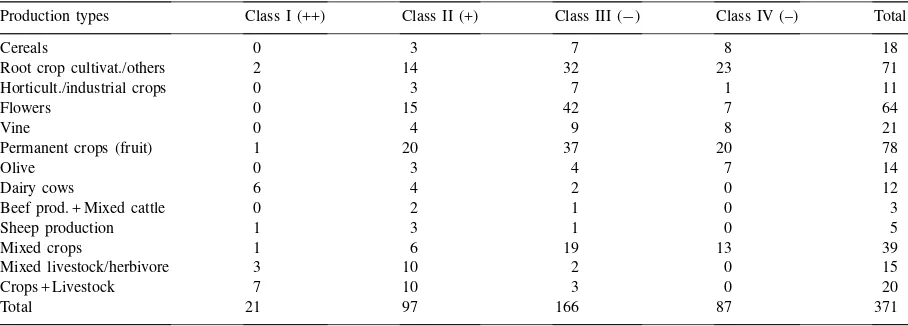
These indices have been calculated for Tuscany, distinguishing between lowlands, hills and mountains. Since the main problems from an environmental view-point were concerning lowlands where, for example, the use of pesticides was almost 10 times higher than in hills and mountains, the focus has been put on this region. The main indices for farms located in Tuscany lowlands were used for classifying farms in quartiles, giving to farms a decreasing score from the ‘best’ to the ‘worst’ quartile for each index. This meant per-forming a linear normalisation allowing a final scale with only four values. Although it has been previously stressed that the use of utility functions is preferable to the use of normalisation, the lack of time and informa-tion about external points of reference, in our opinion, can justify a less sophisticated approach. Moreover, this kind of approach could be used by everybody, since it does not ask for a deep knowledge on sta-tistical techniques or the use of a specific software. According to Pieroni (1989), a simplified approach can be very useful every time that data and indices are provided to a final user, like a decision maker or a pub-lic administrator, who often does not have a scientific background in statistics. In this case, the results of so-phisticated analyses have the problem that they might not always be correctly interpreted by final users. As regards weights, all the indices used for assessing Tus-cany lowlands farm performances were considered as having the same importance and the scores were added together without weighting them. Farms were ranked according to their total score and divided into four classes. Class I (total score from 16 to 20) includes the best farms according to the value of the set of in-dices; Class II is the second best (total score from 11 to 15), followed by Class III (total score from 6 to 10) and Class IV (total score from 0 to 5).
Table 1 shows the number of farms included in each class, by production type. In Table 1 farms of some
production types, for instance farms cropping cere-als, seem to have, on the whole, unsatisfactory per-formances, since 15 farms on a total amount of 18 are classified in the two worst groups. On the con-trary, other farms, for example non-specialised farms with crops and livestock, seem to score quite well, since 17 farms on a total of 20 are classified in the two best groups. Some of the productive types, for instance root crop cultivation/others, permanent crops and mixed crops, have farms included in all the four groups, thus showing that farms may have very differ-ent performances according to the way they are man-aged. Thus, also inside a specific region, such as Tus-cany lowlands, and within a group of farms using the same production mix (e.g. mixed crops), it is possi-ble to find farms adopting either very positive or very negative ‘styles of farming’. It is widely accepted that some productive types are less satisfactory, especially from an environmental and landscape point of view, than others. Nevertheless, it is usually impossible to exclude all of them, hypothesising a major simplifi-cation of the productive mix of a region (Pennacchi et al., 1998). Thus, it is important to find relatively positive styles of farming for these production types. The study of the features allowing farms belonging to these productive types to score quite well may enable a transfer of their strategies to the other farms of the same productive type.
4. Conclusions
Like other human activities, farming does not only result in economic and productive effects, but it has an impact on environment and landscape quality. It is thus important to assess farm performance, taking into account not only economic performance but also a more comprehensive set of indices. This holistic ap-proach should make researchers and decision-makers aware that it is necessary to foresee ex-ante all the pos-sible effects of agricultural interventions, also when they aim at a specific target. From this point of view, it is important to have tools capable of ‘measuring’ farm performance considering landscape, nature and environmental quality production, besides that of agri-cultural products.
Table 1
Tuscany lowlands: farm classification according to performance class and production type (data at 1994)
Production types Class I (++) Class II (+) Class III (−) Class IV (–) Total
Cereals 0 3 7 8 18
Root crop cultivat./others 2 14 32 23 71
Horticult./industrial crops 0 3 7 1 11
Flowers 0 15 42 7 64
Vine 0 4 9 8 21
Permanent crops (fruit) 1 20 37 20 78
Olive 0 3 4 7 14
Dairy cows 6 4 2 0 12
Beef prod. + Mixed cattle 0 2 1 0 3
Sheep production 1 3 1 0 5
Mixed crops 1 6 19 13 39
Mixed livestock/herbivore 3 10 2 0 15
Crops + Livestock 7 10 3 0 20
Total 21 97 166 87 371
unit, for instance in terms of Utility (scoring farms accordingly) and usually to weight them. Since it is difficult to provide an objective and reliable evalu-ation, the use of several combined ranking methods and sets of weights can provide a ‘cross-checked’ evaluation. These evaluations could allow implement-ing policies discouragimplement-ing or supportimplement-ing selected farm types or styles of farming, rather than introducing rules for compulsory adoption. Thus, individuating farm types and styles of farming that are to be promoted is not only relevant for research purposes, but also for providing guidelines to decisions-makers.
Since in the field of landscape production and protection it is not easy to implement successful and effective interventions, providing guidelines for decision-makers is very important. In fact, on the one hand, decision makers might think that the only way to deal with landscape is to prevent any kind of change, ‘freezing’ landscape in its present (or even past) state; nevertheless, this kind of policy could be suitable only for very small areas or regions with specific features. On the other hand, difficulties in managing landscape arise from the fact that landscape is something that cannot be reconstructed by adding together its elements, but it is heavily dependent on the relationships between those elements. From this point of view, in our opinion, providing subsidies for single elements could be a successful strategy when the maintenance or improvement of already existing elements of landscape (walls, hedges, etc.) is involved. A more careful approach is needed in
the case that decision-makers try to support the intro-duction or reintrointro-duction of single elements that are not already present. This arises from the way farm-ers respond to interventions which may cause results that are very far away from those initially expected. Consequently, supporting farm typologies (e.g. mixed crops) or ‘styles of farming’ (e.g. organic farming) that have already proved having a positive influence on landscape quality (and other features) might be, in our opinion, a more reliable approach than subsidising single elements of landscape. This kind of approach could benefit, in our opinion, from an assessment of farm typologies or styles of farming performance as the one proposed in this article.
Acknowledgements
This research has been supported by the Na-tional Research Council under contribution Nos. 94.00965.CT06 and 95.03251.CT06 and by the Uni-versity of Pisa.
References
Accademia Nazionale di Agricoltura, 1991. Agricoltura e Ambiente, Edagricole, Bologna.
Andreoli, M., Tellarini, V., 1998. Marginality and development in Italy: a study review. In Jussila, H., Leimgruber, W., Majoral, R. (Eds.), Perceptions of Marginality. Theoretical Issues and Regional Perceptions of Marginality in Geographical Space, Ashgate, Aldershot, UK.
Andreoli, M., Tellarini, V., 1995. Le imprese agricole ed il successo. In: Cannata, G. (Ed.), Per una definizione delle condizioni di successo nelle aree collinari e montane, CNR-RAISA n.2418, Rubbettino, Soveria Mannelli (CZ), pp. 50–72.
Ciani, A., Boggia, A., Marinozzi, G., 1993. Metodologie di valutazione di alternative di parchi: il caso del Parco del Nera. Genio Rurale 11, 46–54.
Chiusoli, A., 1994. La rinaturalizzazione del paesaggio agrario: una esigenza ambientale, culturale e civile. Genio Rurale 4, 42–51.
Colorni, A., Laniado, E., 1988. VISPA, Software Territoriale e Ambientale, CLUP, Milano.
Colorni, A., Laniado, E., 1992. SILVIA: a decision support system for environmental impact assessment. In: Colombo A.G. (Ed.), Environmental Impact Assessment, ECSC, EEC, EAEC, Brussels and Luxembourg, printed in the Netherlands, pp. 167–180.
Feliziani, R., 1997. Valutazione di alternative di gestione: il caso del Parco Nazionale dei Monti Sibillini. Genio Rurale 12, 25– 32.
Hendriks, K., Stobbelaar, D.J., van Mansvelt, J.D., 2000. The appearance of agriculture. Assessment of landscape quality of (organic and conventional) horticultural farms in West-Friesland. Agric. Ecosyst. Environ. 77, 157–175. Pennacchi, F., Abitabile, C., Andreoli, M., Colosimo, V., Marino,
D., Polinori, P., Tellarini, V., 1998. Sostenibilità Efficienza e Successo Aziendale. Una valutazione nelle aziende della R.I.C.A., CNR-RAISA, Quaderni dell’Istituto di Economia e
Politica Agraria, quaderno n. 24, Tipografia dell’Università degli Studi di Perugia, Perugia.
Pieroni, O., 1989. Il Progetto I.P.R.A. 2.2, la carta della marginalità ed i limiti e vantaggi del metodo proposto. In: Pieroni, O., Aandreoli, M. Agricoltura, Marginalità e Sistemi socio-economici locali, CNR-IPRA, Pacini Editore, pp. 13–16. Polinori, P., 1998. Agricoltura e Sostenibilità. In: Pennacchi, F., Abitabile, C., Andreoli, M., Colosimo, V., Marino, D., Polinori, P., Tellarini, V., 1998. Sostenibilità Efficienza e Successo Aziendale. Una valutazione nelle aziende della R.I.C.A., CNR-RAISA, Quaderni dell’Istituto di Economia e Politica Agraria, quaderno n. 24, Tipografia dell’Università degli Studi di Perugia, Perugia, pp. 3–37.
Romero, C., Rehman, T., 1989. Multiple Criteria Analysis for Agricultural Decision, Elsevier, Amsterdam.
Rossi, R., Nota, D., Fossi, F., 1997. Landscape and nature production capacity of organic types of agriculture: examples of organic farms in two Tuscan landscapes. Agric. Ecosyst. Environ. 63/2, 3: 159–171.
Rossi, R., Nota, D., 2000. Nature and landscape production potentials of organic types of agriculture: a check of evaluation criteria and parameters in two Tuscan farm-landscapes. Agric. Ecosyst. Environ. 77, 53–64.
Stobbelaar, D.J., van Mansvelt, J.D., 2000. The process of landscape evaluation. Introduction to 2nd special Agric. Ecosyst. Environ. issue of the Concerted Action: the Landscape and Nature Production Capacity of Organic/Sustainable Types of Agriculture. Agric. Ecosyst. Environ. 77, 1–15.
van Mansvelt, J.D., 1997. An interdisciplinary approach to integrate a range of agro-landscape values as proposed by representatives of various disciplines. Agric. Ecosyst. Environ. 63 (2–3), 233– 250.