A detection method of artificial area from high resolution remote sensing images based on
multi scale and multi feature fusion
Penglong LIa
*, Xiangyun HUb, Yan HUab, Yi DINGa, Lan WANGa, Li LIa
a Chongqing Geomatics Center, Chongqing China – (lpl,huyan,dy,wl,lily)@dl023.net b School of Remote Sensing and Information Engineering, Wuhan China – [email protected]
Commission VI, WG VI/4
KEY WORDS:Artificial Areas, Automatic Detection, Geometric Features, Visual Saliency Features, Multi Scale, Feature Fusion
ABSTRACT:
In order to solve the problem of automatic detection of artificial objects in high resolution remote sensing images, a method for detection of artificial areas in high resolution remote sensing images based on multi-scale and multi feature fusion is proposed. Firstly, the geometric features such as corner, straight line and right angle are extracted from the original resolution, and the pseudo corner points, pseudo linear features and pseudo orthogonal angles are filtered out by the self-constraint and mutual restraint between them. Then the radiation intensity map of the image with high geometric characteristics is obtained by the linear inverse distance weighted method. Secondly, the original image is reduced to multiple scales and the visual saliency image of each scale is obtained by adaptive weighting of the orthogonal saliency, the local brightness and contrast which are calculated at the corresponding scale. Then the final visual saliency image is obtained by fusing all scales’ visual saliency images. Thirdly, the visual saliency images of artificial areas based on multi scales and multi features are obtained by fusing the geometric feature energy intensity map and visual saliency image obtained in previous decision level. Finally, the artificial areas can be segmented based on the method called OTSU. Experiments show that the method in this paper not only can detect large artificial areas such as urban city, residential district, but also detect the single family house in the countryside correctly. The detection rate of artificial areas reached 92%.
* Corresponding author
1. INTRODUCTION
With the improvement of satellite sensor resolution, remote sensing image has become the main data source. The automatic detection method of artificial objects (buildings, roads, etc.) has become a hot spot in the research field of high resolution remote sensing images. Those detection methods contain mainly three categories: the first one is based on the points, lines, angles and other geometry features of man-made objects in local region of image; the second method utilizes the knowledge of visual attention mechanism and visual saliency, and the last idea is proposed based on image segmentation in image morphology.
Harris and SUSAN detectors, published in Harris and Stephens (1988) and Smith and Brady (1997), were validated for distinguishing building versus natural structures. (Lowe, 2004) presented a method for extracting distinctive invariant features Scale-invariant feature transform (SIFT) key points which is used in building detection. (Ünsalan. Cem and K. L., Boye 2004) introduced a method to classify land development in high resolution satellite images with straight line detection and statistics. (Sirmacek. B and C. Unsalan., 2010) proposed a technique to detect urban areas in high resolution remote sensing images by using local feature points and spatial voting.
Some researchers also made use of edge features, visual saliency such as local brightness and contrast, and multi spectral information to detect the artificial objects. (Xu G et al., 2007) introduced a technique to extract salient object from remote sensing image based on guidance of visual attention.A method was introduced to classify artificial objects images
based on fusion of edge and multispectral information (Huang X et al., 2008) . (Antelo J et al., 2009) presented a method for ship detection and recognition with extracting the visual saliency features in the high resolution satellite images. (Zhicheng L et al., 2013) also made use of extraction of saliency-gist features to complete target detection for remote sensing images.
Following the region-based trend, a segment-merge technique (SM) is introduced (Song et al., 2006), which considered building detection as a region level task and assumed buildings to be homogeneous areas. (Ok et al., 2013) proposed the Grab-Cut algorithm for building detection. The algorithm contains a two level graph partitioning framework and increasing the performance of his previous proposed model. (Wen Q et al., 2013) presented a man-made object area extraction method based on visual saliency detection and graph-cut segmentation for high resolution remote sensing imagery which the detection accuracy is improved a lot.
geometric features
visual saliency features
original points
original lines
original orthogonal angle
self-constraint mutual restraint
final points
final lines
final orthogonal angles
radiation intensity map
scale 1
scale 2
edge
orthogonal saliency
local brightness
local contrast
visual saliency 1
multi scales saliency image
Artificial areas Harris
LSD
adaptive weighting
scale n
visual saliency 2
visual saliency n
Final saliency image
OTSU
Fig.1 Flaw chart of artificial area detection based on multi scale and multi feature fusion
single family house, narrow roads. As to the third method, a lot of statistical analysis for each super pixel must be done and it takes a lot of time.
So, in order to solve the poor efficiency of automatic detection of artificial objects in high resolution remote sensing images, and enhance the accuracy of automatic detection of artificial objects, a new method for detection of artificial objects from high resolution remote sensing images based on multi-scale and multi feature fusion is proposed, which contains following steps: Step One: Detection of salient geometric features in the area of artificial objects.
Step Two: Multi scale and multi visual saliency feature fusion for the detection of artificial objects.
Step Three: Decision level fusion of multiple geometric features and visual saliency features.
Step Four: Segmentation of artificial areas based on the method called OTSU.
The rest of this paper is organized as follows. The process of the detection method of artificial areas from high resolution remote sensing images based on multi scale and multi feature fusion is introduced in Sect.2. Sect.3 is the conclusion of the method purposed in this paper.
2. METHOD OF ARTIFICIAL AREAS DETECTION
Fig.1 shows the whole flaw chart of the proposed method of artificial areas in this paper. Firstly, the geometric features (such as corner, straight line and right angle) are extracted from the original resolution, and the pseudo corner points, pseudo linear features and pseudo orthogonal angles are filtered out by the self-constraint and mutual restraint between them. Then the radiation intensity map of the image with high geometric characteristics is obtained by the linear inverse distance weighted method. Secondly, the original image is reduced to multiple scales and the visual saliency image of each scale is achieved by adaptive weighting of the orthogonal saliency, the local brightness and contrast which are calculated at the corresponding scale. Then the final visual saliency image is
obtained by fusing all scales’ visual saliency images. Thirdly, the visual saliency images of artificial areas based on multi scales and multi features are obtained by fusing the geometric feature energy intensity map and the visual saliency image obtained in previous decision level. Finally, the artificial areas can be segmented based on the proposal method called OTSU.
2.1 Multi geometric features extraction
Buildings, roads and other artificial objects in the high resolution remote sensing images have obvious geometric features, such as corner point, straight line, right angle and other characteristics. Fig.2 shows the geometric features in artificial areas, in which the corner points, the straight lines and the orthogonal angles are denoted by red, blue and green tag. The existence of these geometric features can effectively distinguish the artificial objects from the non-artificial area. In order to extract these geometric features in the high resolution remote sensing images, we get the corner points by using improved Harris corner detection algorithm. Extracting the linear features by the method of LSD (Line Segment Detector, Rafael GVG 2010). And the orthogonal angle features can be defined based on those linear features.
(b)
Fig.2 (a) the test image , (b) geometric features of artificial areas in local artificial areas
The Harris operator detects the corner points by using the average energy of the sliding window. The average energy of the window varies greatly in any direction when the pixel point is the corner point. However, there are many false corner points in the original Harris corner detection. The introduction of high-quality features for tracking the Harris corner detection algorithm using restricted two feature points of the minimum distance between the local maxima and constraint conditions, improved the accuracy and quality of corner points greatly. In this paper, the LSD linear detection algorithm (Gioi RGV et al 2012) is used to detect the feature of straight line in the artificial area. However, there were a lot of short lines and pseudo straight lines in the detection results based on LSD. In order to get the orthogonal angle features, the threshold method is used to filter the short lines. And then the method of combining the direction and the distance between the straight lines is used to extract the orthogonal angles based on the straight line detected by LSD.
2.2 A filtration mechanism of multi geometric features No matter what the feature (the corner points, the straight lines or the orthogonal angles) is used, there is still a problem that the single feature extraction is incomplete which led to high false detection rate. For example, it can not only extract the corner points in the artificial objects, but also extract false corner points in the forests. As well as the straight line appears not only in the artificial areas, but also on the edge of the natural river. In order to solve the problem, this paper designed a variety of geometric characteristics of self-constraint and mutual restraint strategy, mainly contains.
(1) Corner points self-constraint: For each corner point, if there are a certain number of corner points within a certain range, it remains. Otherwise delete.
(2) Straight lines self-constraint: For each straight line detected by LSD should be longer than a certain length, otherwise it should be deleted.
(3) Mutual restraint between corner points and straight lines:
As we know, there must be corner points and straight lines in most artificial areas. For each corner point, there should be straight lines within a certain range, otherwise the corner point is a bad one. For each straight line, there also should be corner points within a certain range, or it should be deleted.
(4) Mutual restraint between corner points and orthogonal angles: For each orthogonal angle, there should be corner points within a certain range of it pedal. If not, the orthogonal angle is not a good one.
2.3 Radiation intensity map of multi geometric features Then the linear inverse distance weighted method is used to obtain the radiation intensity map of the image with high geometric characteristics.
corner point, straight line and orthogonal angle
ij
S , Sik, Sin= the distance between current pixel and
corner point j, straight line k and orthogonal angle n
2.4 Multi scale and multi visual saliency features detection and fusion
In addition to the geometric features, the artificial objects have obvious visual saliency features such as edge features, orthogonal features and homogeneity. For example, there is a good homogeneity in the local area of the roof, and the local brightness and contrast will show a certain regularity. In order to make use of these visual saliency features, the original image was down sampled to several scales (Fig.1). Then the multi visual saliency features were extracted and fused into a visual saliency image in each scale. Finally, we got the final visual saliency image of the artificial areas by fusing all visual saliency images. The main steps are as follows:
Step one: The original image is reduced to several scales according to formula (3).
(p,q) = coordinates of the midpoint of Gauss convolution kernel
(i,j) = coordinates of points in the image
bin (k+6) are orthogonal. The orientation bin is defined as: the prime direction is the vertical upward direction, clockwise direction, and every 15 degrees as a bin, from 0 degree to 180 degrees are divided into 12 bins.
Step three: The local window brightness and contrast were extracted and normalized at a same scale. Then we got the local homogeneity index by adaptive weighting according to formula (5).
_ * (1.0 ) *
b c=CB CB+ −CB CON (5) where b_c = the local homogeneity index
CB = the local window brightness value CON = the local window contrast value
Step four: The visual saliency index of artificial areas can be calculated by adaptive weighting the local homogeneity index and the normalized direction saliency and orthogonality index according to formula (6).
_ * _ (1.0 _ ) * _
saliencyone=b c b c+ −b c N OOS (6) where salinecyone = the visual saliency index of artificial areas at one scale
b_c = the local homogeneity index N_OOS = the normalized OOS index
Step five: The visual saliency images of different scales are calculated and fused to obtain the saliency image of the original image.
2.5 Fusion of geometric features and visual saliency feature The strong geometric features represented by corner points, lines, right angles are able to describe the edges of the artificial objects effectively. However, the visual saliency features represented by the local luminance and contrast can express the homogeneity and continuity of the artificial areas. The fusion of the two kinds of features will enhance the accuracy of the detection of artificial objects. In order to realize the effective fusion of two kinds of features, firstly, as narrated in Sect.2.3 , the geometric feature energy intensity map is generated by fusing the geometric features (such as corner points, lines and right angles). Secondly, the visual saliency image is generated by computing respectively on two or more scales (such as 2m and 4m) and fusing them. Afterwards, the visual saliency images of artificial areas based on multi scales and multi features are obtained by fusing the geometric feature energy intensity map and visual saliency image obtained in previous decision level. Ultimately, the artificial areas can be segmented according to the segmentation threshold which is computed based on the method called OTSU (N.Otsu.A , 1979).
3. EXPERIMENTS AND DISCUSSIONS
In order to validate the validity of this method, a high resolution remote sensing image in a region of Chongqing is taken as the experimental data which is shown is Fig.2-(a). The size of the image is 3982*2548 and the ground resolution is 0.2 metres. There are villages, urban areas, forests and lakes in this test area. Fig.3 shows the detection results of geometric features of local region of village. We succeeded in extracting corner points, straight line and orthogonal angles in the artificial areas according to Fig.3-(a), Fig.3-(c) and Fig.3-(e). And we can see that the corner points, linear features and orthogonal angles in the non-artificial areas and the bad corner points, linear features and right angles in the artificial areas are eliminated according to the strategy made previously form Fig.3-b), Fig.3-(d) and Fig.3-(f). It can be seen that the method of multi geometric feature selection strategy designed in this paper can effectively
filter the poor quality geometric features and remain the reliable geometric features.
(a) (b)
(c) (d)
(e) (f)
Fig.3 filter results of local image geometric features (a) original corner points, (b) final corner points, (c) original straight lines, (d) final straight lines, (e) original orthogonal angles, (green), (f) final orthogonal angles (red)
Then we get the radiation intensity map of multi geometric features by the cumulative fusion of final corner points, final straight lines and final orthogonal angles which is shown in Fig.4.According to the radiation intensity map of multi geometric features, we can that the main artificial areas in the experimentation area are marked (white area). But some artificial areas are still missed, and the white areas are not continuous. It is impossible to accurately detect all the artificial areas only by the geometric features, so it is necessary to combine the visual saliency features to improve the accuracy of the detection.
Fig.4 the radiation intensity map of multi geometric features
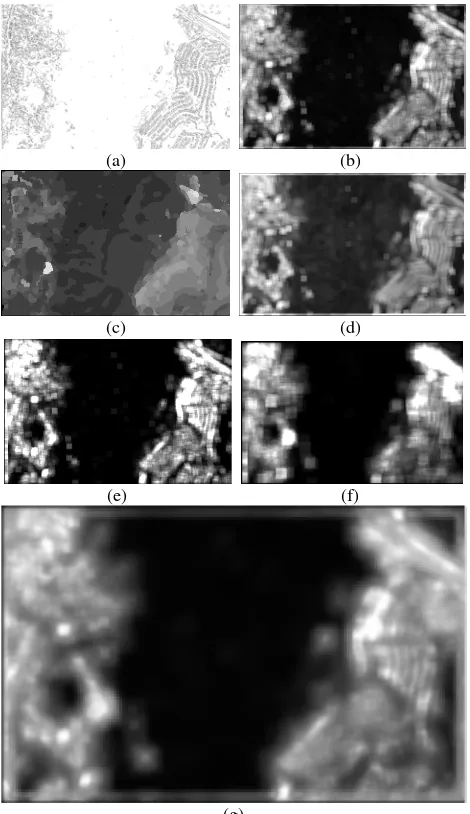
Fig.5-(g). As can be seen from the Fig.5-(g), the artificial areas detected by the method of multi scales and multi visual saliency features are better in regional continuity, but the decomposition line between artificial areas and non-artificial areas is not obvious compared with Fig.4. So, if only the visual saliency features were used to detect the artificial area, it would cause a lot of false detections or missing detections.
(a) (b)
(c) (d)
(e) (f)
(g)
Fig.5 multi scale and multi visual saliency of artificial areas (a) edge features, (b) orthogonal features, (c) local brightness, (d) local contrast, (e) the visual saliency image of scale one, (f) the visual saliency image of scale two, (g)the fusion visual saliency image of all scales
In order to realize the effective fusion of two kinds of features, firstly, as shown in Fig.4, the geometric feature energy intensity map is generated by fusing the geometric features (such as corner points, lines and right angles). Secondly, the visual saliency image is generated by computing respectively on two or more scales (such as 1m, 2m and 4m) and fusing them (Fig. 5-(g)). Afterwards, the visual saliency images of artificial areas based on multi scales and multi features are obtained by fusing the geometric feature energy intensity map and visual saliency image obtained in previous decision level (Fig. 6). Ultimately, the artificial areas can be segmented according to the segmentation threshold which is computed based on the method called OTSU (N.Otsu.A , 1979).
Fig. 6 the final visual saliency image of artificial areas
Fig.7 the mask area of the artificial areas based the OTSU
Fig. 8 the artificial areas detected by the method in this paper
Fig.9 the true artificial areas
large artificial areas (such as urban city and residential district), but also can detect the single family house in the countryside correctly. And Fig.9 shows the true artificial areas in this image (the whole image size is 3982*2548 and the true artificial areas cover 39877576 pixels). Compared with the true artificial areas, the result of the method in this paper shows that 36689365 pixels are detected correctly, 3188211 pixels missed and 5650163 pixels detected by error. The detection rate of artificial areas reached 92%.
4. CONCLUSION
The detection method of artificial areas from high resolution remote sensing images based on multi scale and multi feature fusion in this paper can automatically detect the artificial areas on large high resolution remote sensing images. Experiments show that it not only can detect large artificial areas (such as urban city and residential district), but also can detect the single family house in the countryside correctly. The comprehensive detection rate of artificial areas reached to 92%.
5. ACKNOWLEDGEMENTS
This research was supported by the Key Laboratory for Earth Observation, National Administration of Surveying, Mapping and Geoinformation of China (K2015009).
REFERENCES
Harris, C., Stephens, M., 1988. A combined corner and edge detector. In: Alvey Vision Conference, pp. 147–151.
Smith, S.M., Brady, J.M., 1997. SUSAN – a new approach to low level image processing. Int. J. Comput. Vis. 23 (1), 45–78.
Lowe, D.G., 2004. Distinctive image features from scale-invariant keypoints. Int. J. Comput. Vis. 60 (2), 91–110.
Ünsalan, Cem, and K. L. Boyer, 2004. "Classifying Land Development in High Resolution Satellite Images Using Straight Line Statistics." Geoscience & Remote Sensing IEEE Transactions on 42 (4):907-919.
Sirmacek, B., and C. Unsalan, 2010. "Urban Area Detection Using Local Feature Points and Spatial Voting." Geoscience & Remote Sensing Letters IEEE 7(1):146-150.
Huang X, Zhang L, Li P, 2008. Classification of Very High Spatial Resolution Imagery Based on the Fusion of Edge and Multispectral Information[J]. Photogrammetric Engineering & Remote Sensing, 74(12):1585-1596.
Antelo J, Ambrosio G, Gonzalez J, et al, 2009. Ship detection and recognitionin high-resolution satellite images[C]// Geoscience and Remote Sensing Symposium,2009 IEEE International,igarss. IEEE2009:IV-514-IV-517.
Xu G, Huo H, Fang T, et al, 2007. Extracting salient object from remote sensing image based on guidance of visual attention[C]// International Symposium on Multispectral Image Processing and Pattern Recognition. International Society for Optics and Photonics.
Zhicheng L, Qin S, Itti Laurent, et al, 2010. Extraction of saliency-gist features and target detection for remote sensing images[J]. Journal of Beijing University of Aeronautics & Astronautics, 16(6):659-662.
Song, Z., Pan, C., Yang, Q., 2006. A region-based approach to building detection in densely build-up high resolution satellite image. In: IEEE International Conference on Image Processing, pp. 3225–3228.
Ok, A.O., Senaras, C., Yuksel, B., 2013. Automated detection of arbitrarily shaped buildings in complex environments from monocular VHR optical satellite imagery. IEEE Trans. Geosci. Remote Sens. 51 (3), 1701–1717.
Wen Q, Li L, Liu Q, et al, 2013. A man-made object area extraction method based on visual saliency detection and graph-cut segmentation for high resolution remote sensing imagery[J]. Acta Geodaetica Et Cartographica Sinica, 42(6):831-837.
Rafael GVG, Jakubowicz J, Morel J M, et al, 2010. LSD: A Fast Line Segment Detector with a False Detection Control[J]. IEEE Trans Pattern Anal Mach Intell, 32(4):722-732.
Gioi RGV, Jakubowicz J, Morel J M, et al, 2012. LSD: A line segment detector[J]. Image Processing on Line, 2(4):35-55.