INTRODUCING NOVEL GENERATION OF HIGH ACCURACY CAMERA
OPTICAL-TESTING AND CALIBRATION TEST-STANDS FEASIBLE FOR SERIES PRODUCTION
OF CAMERAS
M. Nekouei Shahraki a *1, N. Haala a
a Institute for Photogrammetry (ifp), University of Stuttgart, Geschwister-Scholl-Str. 24D, 70174 Stuttgart, Germany
KEY WORDS: Fisheye Camera Calibration, Single-Shot Camera Calibration, Calibration Stands, Automated Calibration, Test-Stand Design, Camera Alignment-Testing, Camera Optical-Testing
ABSTRACT:
The recent advances in the field of computer-vision have opened the doors of many opportunities for taking advantage of these techniques and technologies in many fields and applications. Having a high demand for these systems in today and future vehicles implies a high production volume of video cameras. The above criterions imply that it is critical to design test systems which deliver fast and accurate calibration and optical-testing capabilities. In this paper we introduce new generation of test-stands delivering high calibration quality in single-shot calibration of fisheye surround-view cameras. This incorporates important geometric features from bundle-block calibration, delivers very high (sub-pixel) calibration accuracy, makes possible a very fast calibration procedure (few seconds), and realizes autonomous calibration via machines. We have used the geometrical shape of a Spherical Helix (Type: 3D Spherical Spiral) with special geometrical characteristics, having a uniform radius which corresponds to the uniform motion. This geometrical feature was mechanically realized using three dimensional truncated icosahedrons which practically allow the implementation of a spherical helix on multiple surfaces. Furthermore the test-stand enables us to perform many other important optical tests such as stray-light testing, enabling us to evaluate the certain qualities of the camera optical module.
1. INTRODUCTION
1.1. Video-Based Driver Assistant Systems
There is an ever growing demand for using optical sensors and cameras in different systems and environments such as the driver-assistant (DA) systems. The video-based driver-assistant systems incorporate different types of video cameras such as mono/stereo front-view camera or fisheye surround-view cameras which allow gathering and analysing information of the surroundings of vehicle, creating a state of situational awareness. This makes it possible to perform the vehicle motion, manoeuvre and trajectory control. In computer-vision applications such as the video-based driver-assistant systems there is a need for accurate image to world transformation which presumes accurate camera calibration. This requires designing and developing optical-testing and calibration systems for performing various optical tests on every single camera.
1.2. Test-Stand Single-Shot Calibration
Calibration test-stands are often used when speed is the key requirement in performing camera calibration in a single-shot operation, together with required high (sub-pixel) accuracy. In this paper we introduce new generations of test-stands designed based on the implementation of ideal bundle-block calibration benefitting from state-of-the-art manufacturing techniques.
1 * Corresponding Author
2. REQUIREMENTS IN TEST-STAND DESIGN
2.1. Implementing Bundle-Block Geometrical Features
The nature of fisheye cameras used in surround-view systems is to have extreme opening angles bigger than 180 degree which means having high spherical projection factor or high radial distortion depending on the interpretation of projection model such as (Mei and Rives, 2004). This implies that the radial distortion is significantly big in comparison with other lens distortion characteristics. Therefore we need to be able to accurately model this distortion. In test-field-based bundle-block calibration we have generally many points that are - because of its multiple view geometry - well distributed over the image and provide us with high calibration quality, and make an accurate distortion modelling possible. Therefore we need to understand the specifications in point distribution of bundle-block calibration solutions and implement it in the test-stand design.
2.2. Automatic Calibration and High Repetitive Accuracy
interaction. In comparison with solutions in which human interaction is necessary (which brings unpredicted effects and instability in calibration procedure), using automated machines instead would increase the stability and repetitive accuracy of the calibration and thus ensured the quality of the calibration process. This feature (high repetitive accuracy) is very important for example when using the test-stand platform for analysing different environmental effects on the camera or performing hardware and software simulations.
2.3. Maintaining Calibration Accuracy for Complete Image Area
In surround-view systems taking advantage of omnidirectional cameras the calibration sub-pixel accuracy at the edges of image have a special importance in many applications. Therefore we need to make sure that the designed test-stand and the used calibration model will provide us with this accuracy at the edges. One of the most important criterions in this matter is the Runge’s Phenomenon (Dahlquist and Björck, 1974). This phenomenon has been discussed in numerical analysis and refers to the increase in errors at the edges of a domain when trying to fit a high-degree polynomial to a function over that domain. Runge’s phenomenon is mostly present in conditions in which the high degree of polynomial comes close to the number of equidistant sampled points in the domain. Because the modelling of lens distortion could be considered as a mathematical function fitting or polynomial fitting (Tang et al, 2012a) (Tang et al, 2012b) we need to make sure that this phenomenon does not happen when performing the test-stand calibration. This is also valid when using calibration models such as C.Mei model (Mei and Rives, 2004) or the recent Free-Function model (Nekouei and Haala, 2015) for which different types of polynomials or function series are used with degrees from 6 up to 32 are used for distortion modelling.
2.4. Camera Alignment-Testing Capability
When performing the camera intrinsic calibration, we also require the information about the alignment of the camera internal parts. This information include the alignment of sensor with respect to the optical axis, the camera housing, or the reference camera coordinates system. Therefore we need to consider the capability of performing camera alignment testing in the design of test-stand.
2.5. Additional Demands on Optical Tests
It is required and advantageous to have multiple functionalities available in our test systems. Therefore the test-stand needs to be designed to encompass the capability for other optical tests on our cameras such as Stray-Light testing (Raizner, 2012). These optical tests provide us with further quality measures of our optical module such as the appearance of optical artefacts or unwanted optical effects such as ghosts in image. This helps us determine if a certain level of quality is reached for each camera. Therefore the existence of these extra functionalities should be considered in the test-stand design.
3. TEST-STAND DESIGN
3.1. Analysing the Bundle-Block Calibration
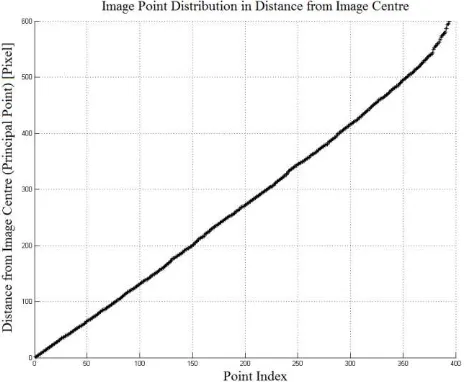
As discussed in chapter 2.1 we need to implement certain features of multiple-view test-field-based calibration as point distribution in our test-stand. In order to calculate the point distribution for the bundle-block calibration, we set the image height value (observed point radius) for these points as observations. To calculate distribution factors, we set the radial distance from principal point or correspondingly the sight angle for each consecutive point as new observation and then calculate the PDF based on these values. For this purpose identical radial observations which are image points closer than 1 Pixel were omitted from the dataset (the threshold for which the point distribution is studied in image space). By avoiding the recurrent points, we were able to calculate the distribution parameters for bundle-block calibration of our fisheye cameras.
The distribution of the points (measured as image height) for bundle-block calibration is very close to a uniform distribution up to the image edge with image height of nearly 550 [pixels]. This means that a uniform point distribution is present when performing bundle-block calibration. The geometry of multiple-view test-field-based calibration helps us to have points with different image heights and sight angles similar to uniform spacing or uniformly distributed points. Assuming a normal polynomial-fitting (for simplifications) this would mathematically help us to better fit our model to the projection curve (Guest, 1958) (Benhenni and Degras, 2011) and means that by having points that are uniformly distributed over radius we will be able to estimate and model the lens distortion effectively.
Figure 1. Distribution of point distances in bundle-block calibration for fisheye cameras
has a standard deviation (which shows the quality of point distribution over the whole image) almost equal or not bigger than the expectation for the point distances (that shows the mean distance of consecutive points) which implies a dense point distribution.
3.2. Test-Stand Geometrical Design
As the first step for the geometrical design of the test-stand we need to study the specifications of the video camera which is going to be calibrated using this device. The video camera is the NRC (Near-Range Camera) used as a surround-view video system in driver-assistant systems. The specifications of the NRC camera are provided in Table 1:
Camera Parameter Value
Image Sensor CMOS
Image Height 960
Image Width 1280
Pixel Size 3.75 [µm]
Colour Filter Array (CFA) Pattern RGGB (Bayer Pattern)
Nominal Focal Length 5.2 [mm]
Spectral Range (SR) 400-700 [nm]
HFOV ≈ 192 [deg]
VFOV ≈ 144 [deg]
Table 1. Specifications of the NRC camera
In order to have high calibration quality in single-shot calibration comparable to the bundle-block solution we have tried to simulate similar geometrical features while designing the test-stand.
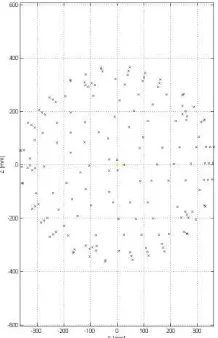
Figure 2. 3D representation of the geomtric design of test-stand for fisheye camera calibration
As mentioned above, the ideal bundle-block calibration has a point distribution characteristic similar to a uniform point distribution which increases the camera calibration quality and validity all over the image. To have this advantageous features from bundle-block calibration in our calibration test-stand, we have used the geometrical shape of a Spherical Helix (Type: 3D Spherical Spiral). One of the special characteristics of this geometrical shape is that it has a uniform radius which corresponds to the uniform motion (Pottmann et al, 2001) (Pottmann et al 2004).
Also in order to realize an automated calibration process in software (as discussed in chapter 2.2), there are certain coded point-groups added to the test-stand control points allowing us to use automated algorithms in the calibration process and thus avoid any direct human interaction. This process is performed by automatically detecting these distinct point-groups and performing target point-matching automatically.
3.3. Test-Stand Mechanical Design and Features
The geometrical feature was realized using three dimensional truncated icosahedrons (Stakhov, 2015) (Hosoya 2011) which practically allows the implementation of a spherical helix on multiple surfaces. To keep the ideal designed distribution in image space, the image points are re-projected analytically on the surfaces of the icosahedrons and the initial three-dimensional space coordinates on the surfaces are calculated.
The design characteristics of the control points were finally achieved by analysing the geometrical features of the test-stand and the stray-light testing as the second necessary optical test (as discussed in chapter 2.5) required to be performed on the camera. The points are designed to be active-illuminated diffuser points with an accurate no-shadow design for which the not-directly-measurable points are measured using the mechanical touch measurement techniques.
All the control point mechanical parts and elements are constructed using precise machinery with accuracy of around 50 [µm]. This accuracy threshold is derived from the pre-analysis calculations in chapter 3.5. Also, the test-stand was finally calibrated mechanically using a measurement arm which provides us point coordinates with the required accuracy available in chapter 3.5. Furthermore, because the control points are actively illuminated we can also use the test-stand for other purposes such as optical stray-light testing.
Figure 4. Captured image from test-stand with a NRC Camera
The final design and the test-stand is represented in Figure 3 and Figure 4, showing the achieved geometrical characteristics of projected points in the camera. The projection of the (modified) three dimensional spherical helix (spherical spiral) is clearly visible in the image.
As discussed in chapter 2.3 we should guarantee a certain point distribution to avoid Runge’s phenomenon from happening. By studying the 3D geometry of test-stand points and image points, it would be clear that by having an (almost) equidistance point distribution (similar to equispaced interpolation points), having a high point density i.e. the number of points far exceeding the degree of the distortion model, and avoiding extremely high degrees of the distortion model the Runge’s Phenomenon does not happen (Dahlquist and Björck, 1974). Furthermore, this uniform and dense point distribution would help us to have extrapolation capabilities (Laderman and Laderman, 1982) in the distortion model such as C.Mei further beyond the last detected image point near the image edge.
We can also perform camera alignment testing using this test-stand as discussed in chapter 2.4. This means evaluating the geometrical alignment of the camera housing and the interior elements such as the alignment of sensor surface compared to the defined optical axis and the reference coordinates system. This is realized by designing an accurate and stable (machine-operated) camera fixture defined as origin of the unified test-stand coordinates system, achieved by using reference points on both test-stand and camera fixture.
3.4. Design Statistical Analysis and Point Distribution
Having the test-stand point coordinates on the surface icosahedron, we can calculate the projected coordinates in camera and analyse the point distribution in image space. We analyse the distance of consecutive points from each other and from the image centre (principal point) and generate the point distribution graph comparable to Figure 1. We can then study the histogram of the point distribution over the whole image to get further information about the point distribution in image space.
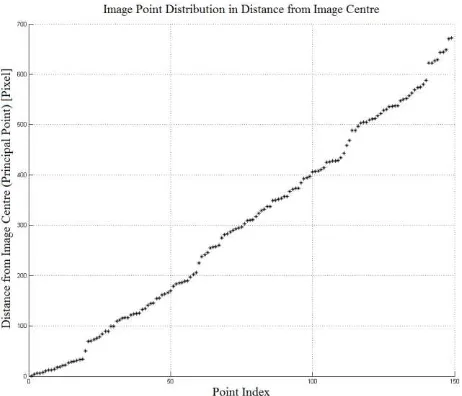
Figure 5. Image point distribution in radius for Test-Stand calibration of fisheye Cameras
Figure 5 illustrates the test-stand point distribution in image by considering each single point (point index) and its corresponding image height. We can see that it is very much similar to a uniform distribution. The small deviations from the straight line are because of some practical and mechanical limits of construction techniques and the introduction of geometrically-coded point-groups for performing automatic point matching in the calibration process.
Figure 6. Histogram of point distribution (image height) for Test-Stand calibration of fisheye cameras
Figure 6 again illustrates the point distribution as a histogram chart. We can see that there is an almost constant value in point count/occurrence over the image height which means the point distribution could well be considered a uniform distribution.
3.5. TEST-STAND MEASUREMENT ACCURACY
We perform the test-stand pre-analysis in order to determine the required accuracy for test-stand calibration and measurement. We refer to pre-analysis as the operation performed while designing an adjustment network which helps us to make decisions about network geometry and the accuracy of observations to ensure the required accuracy and significance for the unknown parameters. Having an approximate design of the test-stand, and some expectations for the calibration accuracy in image space, we can calculate the required accuracy of the observations and determine accuracy thresholds with a certain factor of safety (e.g. 3-Sigma). The accuracy of the test-stand measurement should be at least within those limits or higher so that the accuracy of estimated parameters meets our expectations.
After performing the pre-analysis using the design geometry of the test-stand and the required image application accuracy of about 0.1 [pixel], the required accuracy of initial 3D point measurement was estimated to be about 50 [µm] and used for measuring the coordinates of the points and calibrating the test-stand itself.
4. TEST-STAND ACCURACY ANALYSIS
4.1. Comparison with bundle-block
In our tests we performed the bundle-block calibration which is referred to the multiple-view test-field-based calibration for fisheye cameras. We have used around 40 images for each camera which provide us around 1500 observed control points per calibration (Nekouei and Haala, 2015). Using the same camera we performed the bundle-block calibration seven times independently and compared the final results and the deviations of the estimated models to calculate the final repetitive accuracy. The accuracy comparisons, is performed by analyzing the repetitive accuracy of bundle-block and test-stand calibration solutions. When performing each calibration for both of the solutions, the camera has been mounted/placed again in the camera fixture.
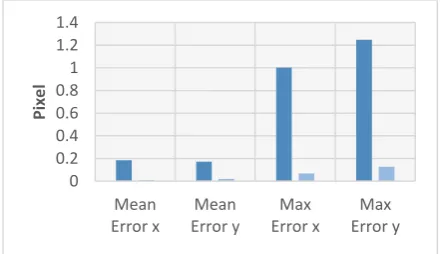
Figure 7. Analysis of repetitive accuracy using test-stand and bundle-block calibration and a single fisheye camera
Fig 7 represents the accuracy factors corresponding to the repetitive accuracy taken from processing of the calibration datasets generated using test-stand and bundle-block calibration. The “Mean Error” and “Max Error” values are calculated in image x and y directions respectively from generated distortion-field of each calibration. The latter is estimated by calculating their deviation from each other on defined projected 3D points i.e. a simulated dense sphere in space.
Figure 8. Accuracy analysis of multiple calibrations using test-stand and bundle-block calibration and a single camera
Figure 8 illustrates the standard deviation of re-projection errors for all of the simulated 3D points as further measures calculated using the calibration dataset for both of the calibration solutions. We should also note that these values could be interpreted as the amount of noise or random error in two different calibration processes which again implies a higher repetitive accuracy for test-stand calibration, which is one of the many important aspects in the camera calibration.
We can see in Fig 7 and Fig 8 that the repetitive accuracy of test-stand calibration is higher than bundle-block calibration. The reason behind this accuracy difference is that it is usually not possible to guaranty the realization of the same ideal point distribution in every bundle-block calibration and thus the deviations of point distributions (or the low stability in point distribution) directly affect the estimated camera intrinsic parameters. In contrast to that, in test-stand calibration the presence of a stable ideal point distribution has increased the accuracy of the test-stand calibration. Also the advantage of an automated calibration procedure (i.e. performed with machine) in test-stand has contributed to a more stable calibration procedure which has further increased the calibration accuracy and stability.
5. CAMERA CALIBRTION ACCURACY ANALYSIS
We performed the test-stand camera calibration for a fisheye camera using the Free-Function calibration model (Nekouei and Haala, 2015). The designed test-stand point distribution in image space is especially beneficial in this case because it makes possible a high quality modelling of local lens distortions. Furthermore the high accuracy threshold for test-stand measurement makes it possible to achieve high sub-pixel accuracies in distortion modelling of the optical module.
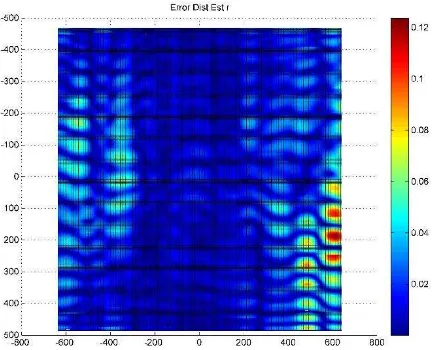
Figure 9. The remaining errors from Free-Function calibration (of degree 16) for a fisheye image
The colour-bar and axes coordinates are in pixel units.
Figure 10. The remaining errors from Free-Function calibration (of degree 32) for a fisheye image
The colour-bar and axes coordinates are in pixel units.
Figure 9 and Figure 10 show the remaining errors of local lens distortion modelling. As we can see the remaining errors are very small which means the local distortion is very well modelled. In Table 2 the accuracy parameters (after performing camera calibration) are available. The “RMSE” values are calculated using all of the observed control points in image and the “Max Error” values are calculated over the entire image (Nekouei and Haala, 2015).
Parameter Name
Free-Function Model (degree 16)
Free-Function Model (degree 32)
RMSEx 0.012 0.001
RMSEy 0.016 0.001
Max Error x 0.061 0.014
Max Error y 0.123 0.022
Table 2. Accuracy analysis of the Free-Function model used in test-stand calibration (All the parameters are in pixel units)
As we can see in Table 2 using the designed test-stand as the calibration hardware platform, and the Free-Function model we could achieve outstanding sub-pixel accuracy compared to classical calibration solutions.
6. CONCLUSION
We designed a test-stand in order to realize the specifications and geometrical features of multiple-view test-field-based camera calibration referred to as bundle-block calibration. To have the advantageous point distribution features from bundle-block calibration in our calibration test-stand, we have used the geometrical shape of a spherical helix (type: 3D spherical spiral). One of the special characteristics of this geometrical shape is that it has a uniform radius which corresponds to the uniform motion. The geometrical feature was realized using three dimensional truncated icosahedrons which practically allow the implementation of a spherical helix on multiple surfaces.
This uniform and dense point distribution helps us to have extrapolation capabilities in the calibration model (after last-squares adjustment) further beyond the last detected image point at the image edge. Depending on the calibration model such as C.Mei or Free-Function model used to model the optical parts, this point geometry can help in estimating a valid projection function and thus modelling the lens distortion accurately all over the image (comparable to bundle-block calibration accuracy).
Furthermore, such a point distribution is beneficial when using calibration models such as Free-Function model which enable us to model of local lens distortion with high accuracy and quality all over the image.
A very important feature of this test-stand is having the capability of performing camera/sensor alignment-testing, a feature which is very important for testing the geometrical alignment of the internal mechanical elements of each camera.
There is also another special advantage of this test-stand design which is having operational automation i.e. the use of machines to perform the calibration procedure. Using automated machines and algorithms would increase the stability and accuracy of the calibration and thus ensures the quality and speed of the calibration for cameras used in video-based driver assistant systems.
REFERENCES
Abraham, S., and Hau, T., 1997. Toward Autonomous High-Precision Calibration of Digital Cameras, Institute of Photogrammetry, Bonn University, SPIE 3174, Videometrics V, 82
Benhenni, K., Degras, D., 2011. Local Polynomial Regression Based on Functional Data, Journal of Multivariate Analysis
Dahlquist Germund and Björck Åke, 1974. Numerical Methods, Dover Publication Inc., p 101-103
Hosoya, H., 2011. High π-Electronic Stability of Soccer Ball Fullerene C60 and Truncated C24 Among Spherically Polyhedral
Networks, The Mathematics and Topology of Fullerences, Springer, Chapter 13, p 249-252
Laderman, J., and Laderman J.D., 1982. Simplified Forecasting by Polynomial Regression with Equally Spaced Values of the Independent Variable, Mathematics of Computation, Volume 38, Number 158
Mei, C., and Rives, P., 2007. Single View Point Omnidirectional Camera Calibration from Planar Grids, IEEE International Conference on Robotics and Automation (ICRA) 3945-3950 doi: 10.1109/ROBOT.2007.364084
Nekouei, M., and Haala, N. 2015. Introducing free-function camera calibration model for central-projection and omni-directional lenses, Proc. SPIE 9630, Optical Systems Design 2015: Computational Optics, 96300P (September 23, 2015); doi: 10.1117/12.2191121
Pottmann, H., Wallner, J., Leopoldseder, S., 2001. Kinematical methods for the classification, reconstruction and inspection of surfaces, Comptes rendus du Congr`es national de math´ematiques appliqu´ees et industrielles, (Corr`eze, France), p 51–60.
Pottmann, H., et al., 2004. Line Geometry for 3D Shape Understanding and Reconstruction, Classification of Surfaces by Normal Congruences, Computer Vision – ECCV: 8th European Conference on Computer Vision, (Springer), p 300-301
Raizner, C., 2012. Objective and Automated Stray Light Insection of High-Dynamic-Range Cameras, Shaker Verlag, Herzogenrath 2012, ISBN 978-3-8440-1287-3, 240 S
Stakhov, A., 2009. The Mathematics of Harmony: From Euclid to Contemporary Mathematics and Computer Science, World Scientific, Vol 22, p 144-146
Tang, R., Fritsch, D., Cramer, M., 2012a. A novel family of mathematical self-calibration additional parameters for airborne camera systems, European Calibration and Orientation Workshop (EuroCOW 2012), 7 pages on CD-ROM