Effects of ozone on the production and utilization of
assimilates in
Plantago major
Youbin Zheng
1, Tom Lyons *, Jeremy Barnes
Air Pollution Laboratory,Department of Agricultural and En6ironmental Science,Ridley Building,The Uni6ersity, Newcastle Upon Tyne NE1 7RU,UK
Received 14 August 1999; received in revised form 26 October 1999; accepted 28 October 1999
Abstract
The impact of ozone (O3) on the production and utilization of photoassimilates was examined inPlantago major
population ‘Valsain’. Plants were exposed in controlled environment chambers to either charcoal/Purafil®-filtered air
(CFA) or CFA plus O3 (15 nmol mol−1O3overnight rising to a maximum of 75 nmol mol−1 between 12:00 and
16:00 h). Measurements of leaf gas exchange and non-structural carbohydrate content were made on the youngest fully expanded leaf after 28 and 42 days of O3 exposure. Destructive harvests were made after 28 and 91 days.
Impacts of O3on reproductive structures were assessed at the final harvest. Daily carbon budgets constructed for the
youngest fully expanded leaf revealed that at the younger growth stage (after 28 days exposure), net CO2assimilation
rate as well as the amount and relative proportion of newly fixed carbon exported in the light were reduced in O3-treated plants. As a result, non-structural carbohydrates (mainly starch) accumulated in source leaves during the
day. ‘Costs’ associated with dark respiration were increased in O3-treated plants after 28 days fumigation. The effects
of the pollutant on plant growth were consistent with shifts in leaf carbon metabolism; relative growth rate (R) between 0 and 28 days fumigation was decreased by O3, but the pollutant caused a stimulation in R over the
subsequent 63 days of the experiment. Despite this compensatory growth response, plants exhibited a reduction in biomass and a decrease in the number of seeds produced per plant following exposure to environmentally relevant O3
concentrations. © 2000 Elsevier Science B.V. All rights reserved.
Keywords:Assimilates; Growth rate; Ozone; Photosynthesis; Plant age; Respiration; Yield
www.elsevier.com/locate/envexpbot
1. Introduction
Ozone (O3) is the most damaging air pollutant
to which plants are exposed (Chameides et al., 1994). Current levels of the pollutant are high * Corresponding author. Tel.: +44-191-222-6589; fax: +
44-191-222-5229.
E-mail address:[email protected] (T. Lyons)
1National Institute for Environmental Studies, Onogawa
16-2, Tsukuba, Ibaraki, Japan.
enough to cause significant decreases in the growth and yield of sensitive genotypes in many parts of the world (Heck et al., 1983; Wahid et al., 1995; Fuhrer et al., 1997). Numerous factors are considered to underlie the decline in productivity induced by O3, including reduced photosynthetic
capacity (Darrall, 1989; Heath, 1994; Pell et al., 1994), enhanced rates of maintenance respiration (Amthor, 1988), and increased retention of fixed carbon in source leaves (Balaguer et al., 1995).
Plant responses to the pollutant vary both within and between species, and may be influ-enced by the stage of growth and/or leaf develop-ment (Cooley and Manning, 1987; Fuhrer et al., 1997; Danielsson et al., 1999). In addition, the impacts of O3 are profoundly influenced by
sev-eral other environmental factors (Wolfenden and Mansfield, 1991; Barnes et al., 1996; Barnes and Wellburn, 1998). Previous work onPlantago ma
-jor has demonstrated that geographically discrete populations exhibit wide variation in O3
sensitiv-ity (Reiling and Davison, 1992a; Lyons et al., 1997); exposure of sensitive populations to envi-ronmentally relevant concentrations of the pollu-tant causing decreases in the rate of net CO2
assimilation (Reiling and Davison, 1994, 1995; Whitfield et al., 1996), plant growth (Reiling and Davison, 1992a,b; Pearson et al., 1996; Lyons et al., 1997) and reproductive performance (Reiling and Davison, 1992b; Whitfield et al., 1996; Lyons and Barnes, 1998). However, O3-sensitive
popula-tions may become more resistant to the pollutant as plants age (Reiling and Davison, 1992b; Lyons and Barnes, 1998), a phenomenon that has also been documented in other species (Blum and Heck, 1980; Walmsley et al., 1980; Lee et al., 1988; Held et al., 1991; Kasana, 1991; Younglove et al., 1994).
The present study was undertaken to test the hypothesis that plant responses to O3 are
influ-enced by developmental age. An O3-sensitive
pop-ulation ofP.major (‘Valsain’; Lyons and Barnes, 1998; Lyons et al., 1999a) was employed to exam-ine the effects of the pollutant on photosynthesis and assimilate utilization by individual leaves at contrasting stages of plant growth.
2. Materials and methods
2.1. Plant culture and fumigation
Seed ofP.majorL. ‘Valsain’ was germinated in a propagator containing a standard potting com-post (John Innes No. 2) in a controlled environ-ment chamber ventilated with charcoal/ Purafil®-filtered air (CFA,B5 nmol mol−1 O
3).
The propagator lid was removed following germi-nation, and 7-day-old seedlings (i.e. three-leaf stage) transplanted individually in to 2.5 cm2
plugs of 10×7 modules containing the same com-post. Plants were then transferred to duplicate controlled environment chambers and exposed to CFA (24 h days−1) or CFA plus O
3(CFA plus 15
nmol mol−1O
3overnight rising to a maximum of
75 nmol mol−1 between 12:00 and 16:00 h).
De-tails of the chambers are given elsewhere (Zheng et al., 1998). Plants were transplanted in to pro-gressively larger pots (0.45 and 1.74 dm3)
contain-ing the same standard compost after 14 and 28 days, respectively, watered daily and fertilized once every 2 weeks using a medium strength commercial nutrient solution (Phostrogen, Cor-wen, Clwyd, UK).
2.2. Leaf gas exchange
After 28 and 42 days of exposure to CFA or O3, the rate of CO2 and H2O exchange of the
youngest fully expanded leaf borne on six plants per chamber was recorded every 2 h over a 24-h period using a portable PP-systems infra-red gas analysis (IRGA) system employing a standard Parkinson leaf cuvette (PLC-B) coupled to a twin-channel CO2/H2O IRGA (CIRAS; PP Systems,
Hitchin, Herts., UK). Measurements were per-formed inside each chamber under ‘growth condi-tions’. Day-time measurements were made at a PPFD of 200910mmol m−2 s−1, representative of the PPFD at canopy height in the growth chambers, employing a reference (i.e. ambient) CO2 concentration of 36591 mmol mol
−1, a
were made in rotation on individuals exposed to CFA and O3, allowing sufficient time for each leaf
to attain a steady-state (5-min equilibration pe-riod during the day, 20 min at night) prior to recording data. Because of the time taken to attain reliable gas exchange data in the dark, night-time measurements were restricted to three plants per chamber (i.e. six plants per treatment).
2.3. Carbohydrate analyses and the construction of carbon budgets
Leaves employed for diurnal gas exchange mea-surements were harvested immediately prior to the end of the photoperiod (‘dusk’, 21:00 – 22:00 h) and an equivalent set of leaves harvested from five additional plants in each chamber (i.e. ten plants per treatment) immediately prior to the beginning of the next photoperiod (‘dawn’, 06:00 – 07:00 h). Plants were sampled after 28 and 42 days exposure to CFA or O3, the same day
that diel gas exchange measurements were per-formed. The projected area and weight of each leaf was recorded, then ethanol-soluble and water-soluble carbohydrates separated according to Far-rar (1980, 1993) by successive extractions in hot (80°C) 95% (v/v) ethanol (ethanol-soluble carbo-hydrates) and acetate buffer (pH 4.5) (water solu-ble carbohydrates). Starch was extracted from the residual leaf material, following grinding, auto-claving and the addition of 10 U a-amylase (EC 3.2.1.1) and 10 U amyloglucosidase (EC 3.2.1.3) to the cooled extracts.
Carbohydrate concentrations were determined using the phenol/sulphuric acid assay described by Dubois et al. (1956). Borland and Farrar (1985) have previously shown that the fractions contain: (i) ethanol soluble-fraction – neutral sugars; su-crose, glucose, fructose and low d.p. fructans (d.p.B5), (ii) water-soluble fraction – high d.p. fructans, and (iii) starch (a-amylase/ amyloglucosi-dase extracts).
Daily carbon budgets were constructed as de-scribed by Borland and Farrar (1985). Assimilate export in the light was calculated by subtracting the amount of non-structural carbohydrate accu-mulated during the day (i.e. stored in the light) from the total amount of CO2 assimilated over
the same period. Carbohydrate losses associated with dark respiration (Rd) were calculated from night-time measurements of the rate of CO2efflux
from leaves under the assumption that respiratory processes are fuelled solely by hexose carbohy-drates at night.
2.4. Growth and dry-matter partitioning
Thirty seedlings were randomly harvested when plants were transferred to fumigation chambers, and this process was repeated on five plants per chamber (i.e. ten plants per treatment) after 28 and 91 days exposure to CFA or O3. Plants were
separated in to root and shoot, and then dried to constant weight in an oven at 70°C. Plant relative growth rate (R) and root/shoot allometry (K) were calculated according to Hunt (1990). At the final harvest (91 days), the number of flower spikes were recorded, before separating from each plant and drying to constant weight in an oven at 70°C. The number of capsules per plant, and the number of seeds per capsule, number of seeds per plant and the dry weight of 50 seeds were subse-quently recorded based on determinations for five capsules per spike and five spikes per plant. Re-productive effort was calculated from the ratio of total dry weight of seeds per plant:total dry weight of the whole plant (Pearson et al., 1996).
2.5. Statistical analyses
Statistical analyses were performed using SPSS (SPSS Inc., Chicago, IL, USA). Data were first subjected to analysis of variance (ANOVA) inves-tigating the influence of chamber on all measured parameters. No significant chamber to chamber variation was found within treatments, so data for individual plants were reanalyzed using a reduced multivariate ANOVA (MANOVA) model to test the effects of O3under the assumption that plants
3. Results
3.1. Visible injury
No typical visible symptoms of O3 injury were
observed during the study, and leaves showed no signs of senescence within the measurement period.
3.2. Diurnal gas exchange
Fig. 1 shows the effects of O3 on the rate of
CO2exchange of the youngest fully expanded leaf
following 28 and 42 days fumigation. After 28 days, a decline (PB0.05) in the rate of CO2
assimilation (A) was found in the O3-treated
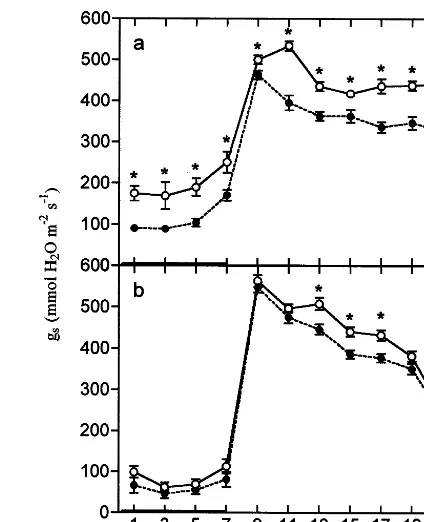
Fig. 2. Impact of O3 on leaf stomatal conductance (gs) of P.
major. Values represent the mean of between nine and ten measurements made on the youngest fully expanded leaf, after 28 (a) and 42 (b) days exposure to either CFA (open symbols) or O3 (15 nmol mol−1overnight rising to a maximum of 75
nmol mol−1 between 12:00 and 16:00 h, shaded symbols).
Bars represent the S.E. The thickened parts of the x-axis indicate the dark period. Significant differences from CFA are indicated: *PB0.05.
Fig. 1. Impact of O3on leaf CO2 assimilation rate (A) ofP.
major. Values represent the mean of between nine and ten measurements made on the youngest fully expanded leaf, after 28 (a) and 42 (b) days exposure to either CFA (open symbols) or O3(15 nmol mol−1overnight rising to a maximum of 75
nmol mol−1 between 12:00 and 16:00 h, shaded symbols).
Bars represent the S.E. The thickened parts of the x-axis indicate the dark period. Significant differences from CFA are indicated: *PB0.05.
plants. The effect became significant 5 h into the daily period of fumigation and persisted after the O3 concentration in the chambers returned to
basal night-time levels. In contrast, no significant effects of the pollutant on A were found after 42 days exposure to O3. During the dark period,
exposure to O3resulted in significantly (PB0.05)
enhanced rates of dark respiration (Rd) after 28 days, but there were no statistically significant changes in Rd after 42 days exposure.
Stomatal conductance (gs, see Fig. 2) was sig-nificantly (PB0.01) reduced by O3 after 28 and
42 days fumigation (−19 and −9%, respec-tively). During the dark period,gsremained lower in O3-exposed plants than in equivalent plants
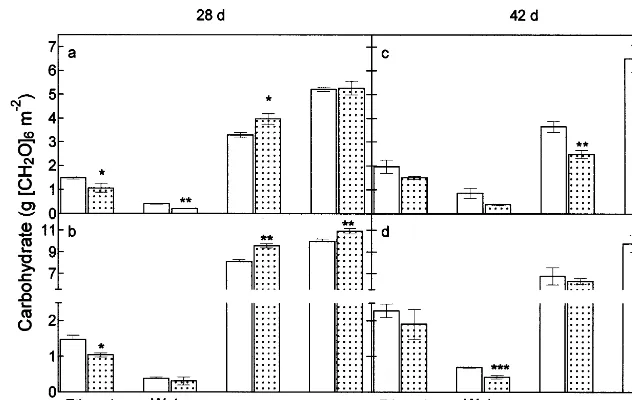
Fig. 3. Impact of O3on leaf ethanol soluble and water soluble carbohydrate, starch and total non-structural carbohydrate content
ofP.major. Values represent the mean of ten measurements made on the youngest fully expanded leaf at 07:00 h (a, c) and at 21:00 h (b, d) after 28 (a, b) and 42 (c, d) days exposure to either CFA (open columns) or O3(B15 nmol mol−1overnight rising to a
maximum of of 75 nmol mol−1between 12:00 and 16:00 h, shaded columns). Bars represent the S.E. Significant differences from
CFA are denoted: *PB0.05, **PB0.01, ***PB0.001.
42 days: −35%,PB0.01). However, the response ofgsto O3was not significantly affected by plant
age.
3.3. Diurnal leaf carbon budgets
Fig. 3 shows the effects of O3 fumigation on
leaf non-structural carbohydrate. The major form of carbohydrate accumulated over the photope-riod was found to be starch. After 28 days, O3
-treatment reduced (PB0.05) the ethanol-soluble carbohydrate fraction in leaves (−28%) and caused the enhanced (PB0.05) accumulation of starch (+21%). These effects persisted overnight. Ozone fumigation decreased the level of water-soluble carbohydrates in the leaf at dawn (−48%,
PB0.01). However, no significant difference was found at 21:00. After 42 days fumigation, dawn levels of starch were reduced in O3 fumigated
leaves (−32%, PB0.01), and at dusk the water-soluble carbohydrate level was decreased by O3
(−39%, PB0.001).
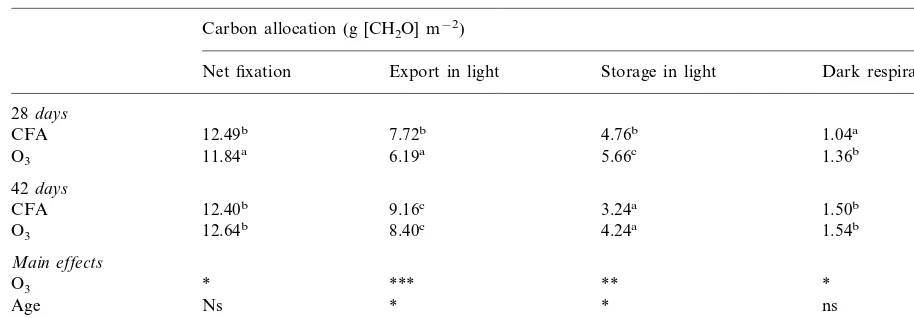
The partitioning and relative allocation of newly fixed carbon to export and storage in the light and the relative cost of dark respiration are
shown in Tables 1 and 2, respectively. After 28 days fumigation, net CO2 fixation was reduced
(PB0.05) by 5% over the whole photoperiod in the O3-treatment. There was a significant decline
Table 1
Impact of O3 on the daily partitioning of photosynthetically
fixed carbon to export, storage and respiration ofP.majora
Partitioning of fixed carbon (%)
Dark respira-Storage in
Export in light
tion light
28days
8.3
CFA 61.8 38.1
11.5
52.3 47.8
O3
42days 73.9
CFA 26.1 12.1
O3 66.5 33.5 12.2
aValues represent the mean of between six and ten
measure-ments made on the youngest fully expanded leaf, after 28 and 42 days exposure to either CFA or O3 (15 nmol mol−1
overnight rising to a maximum of 75 nmol mol−1 between
Table 2
Impact of O3on net carbon fixation, carbohydrate export, storage in the light and consumption by dark respiration ofP.majora
Carbon allocation (g [CH2O] m−2)
Export in light Storage in light
Net fixation Dark respiration
28days
7.72b 4.76b
12.49b 1.04a
CFA
6.19a 5.66c
O3 11.84a 1.36b
42days
CFA 12.40b 9.16c 3.24a 1.50b
8.40c 4.24a
12.64b 1.54b
O3
Main effects
*** **
* *
O3
*
Age Ns * ns
* ns *
*** O3×age
aValues represent the mean of between six and ten measurements made on the youngest fully expanded leaf, after 28 and 42 days
exposure to either CFA or O3(15 nmol mol−1overnight rising to a maximum of 75 nmol mol−1between 12:00 and 16:00 h). Within
column, means bearing the same superscript are not significantly different at the 5% level. Significant effects are denoted: *PB0.05.
**PB0.01. ***PB0.001.
Table 3
Impact of O3on shoot and root dry weight, relative growth rate (R) and allometric root/shoot growth (K) ofP.majora
ShootCFA(DW, g)
Growth age Shoot% RootCFA(DW, g) Root% RCFA R% KCFA K%
39*** 0.09490.01 37*** 1.4390.01
28 days 0.44190.025 83***0.9890.01 99
91 days 10.790.4 67*** 1.5590.16 74** 0.3590.01 117*** 0.8790.03 108
Main effects
***
O3 * *** ns
***
Age *** *** ***
ns ***
***
O3×age ns
aValues represent the mean of ten measurements made after 28 and 91 days exposure to either CFA or O
3 (15 nmol mol− 1
overnight rising to a maximum of 75 nmol mol−1 between 12:00 and 16:00 h). Shoot% is (Shoot
O3/ShootCFA)×100, Root% is (RootO3/RootCFA)×100,R% is (RO3/RCFA)×100,K% is (KO3/KCFA)×100.RandKfor 91 days represent the relative growth rate
from 28 to 91 days. Significant effects are denoted: *PB0.05.
**PB0.01. ***PB0.001.
(PB0.001) in the amount and relative proportion of the fixed carbon exported during the day and an increase (PB0.05) in the amount and relative proportion of starch stored in leaves during the photoperiod. There was also a significant (PB
0.05) increase in the utilization of carbohydrate associated with Rd. However, after 42 days, O3
exposure resulted in no significant effects on car-bon allocation.
3.4. Plant growth and resource allocation
Table 3 provides a summary of the effects of O3
28 and 91 days exposure to O3. Shoot and root
biomass was found to be markedly (PB0.001) reduced by O3 at both harvests, but effects were
found to be less pronounced after 91 days expo-sure to O3 in comparison with those after 28 days
(O3×plant age, PB0.001). Since plant dry
weight represents the cumulative effects of the pollutant over the whole growth period, the rela-tive growth rate of the plant (R) was calculated between the two harvests to enable a comparison of the relative effects of O3over the first 28 days
and the subsequent 63 days. These data indicated that R declined substantially (PB0.001) with plant age and that there was a contrasting effect of O3 with plant age (O3×plant age, PB0.001);
O3 exposure resulted in a 17% decline in R over
the first 28 days of the fumigation, but caused a 17% stimulation in R over the subsequent 63 days. At neither stage of growth was O3found to
significantly change the balance between root and shoot growth (K).
3.5. Effects of ozone on reproducti6e structures
Table 4 shows the effects of O3 on potential
reproductive capacity. Ozone was found to signifi-cantly reduce the number of flower spikes (PB
0.05) and the number of capsules per plant (PB0.001), resulting in a significant (PB0.001) reduction the number of seeds produced per plant. There was no significant effect of O3on the
average number of seeds per capsule or seed dry weight. Also, the weight of seed produced per plant relative to the dry weight of whole plant (reproductive effort) was not significantly affected by exposure to O3.
4. Discussion
Exposure of P. major ‘Valsain’ to environmen-tally relevant concentrations of O3 resulted in a
decline in relative growth rate in young plants (0 – 28 days exposure), but plant growth rate was enhanced in the later stages of development (28 – 91 days) (Table 3). These findings confirm previ-ous studies on the same genotype of P. major
performed by Lyons and Barnes (1998) that demonstrated that the sensitivity of this popula-tion to O3decreases with plant age. The decline in
pollutant sensitivity with plant age was consistent with observed shifts in the daily carbon budgets constructed for the youngest fully expanded leaf: (i) net CO2 assimilation rate under chamber
con-ditions was reduced by O3 after 28 days (sensitive
stage of growth), but there was no effects after 42 days exposure (Fig. 1), (ii) at the sensitive stage of growth the amount and relative proportion of the newly fixed carbon exported in the light was reduced, resulting in the enhanced accumulation of non-structural carbohydrate (mainly in the form of starch) in source leaves during the day (Tables 1 and 2), and (iii) at the sensitive stage of growth (i.e. after 28 days), ‘costs’ associated with dark respiration were increased (Table 2).
As in the leaves of the majority of dicotyle-donous species, the non-structural carbohydrate pool was dominated by starch (Fig. 3). After 28 days, O3was found to reduce the soluble
carbohy-drate content of leaves and enhance starch accu-mulation (i.e. enhance storage in the light). This finding is consistent with the reported effects of O3 on a diverse range of herbaceous species and
trees (Barnes et al., 1990; Ebel et al., 1990; Schiff-gens-Gruber and Lu¨tz, 1992; Gu¨nthardt-Goerg et Table 4
Impact of O3 on the number of flower spikes per plant,
number of seeds per capsule, number of capsules per plant, number of seeds per plant, the dry weight (DW) of 50 seeds and reproductive effort (total dry weight of seeds per plant/ to-tal dry weight of the whole plant) ofP.majora
O3
CFA
13.290.8
Flower spikes plant−1 12.490.4*
12.390.5 11.790.3
Reproductive effort 0.31790.017
aValues (mean 9S.E.) represent the mean of ten
measure-ments made on individual plants after 91 days exposure either to CFA or O3(15 nmol mol−1overnight rising to a maximum
of 75 nmol mol−1 between 12:00 and 16:00 h). Significant
differences between CFA and O3 are denoted:
al., 1993; Wellburn and Wellburn, 1994; Balaguer et al., 1995; Barnes et al., 1995). However, the mechanisms underlying such shifts in carbon allo-cation are poorly understood. It is possible that O3 directly effects the enzymes (e.g. fructose
bis-phosphatase and sucrose phosphate synthase) that regulate sucrose/starch synthesis (Huber and Hu-ber, 1992) or that the effects of the pollutant represent a down-stream consequence of a restric-tion in the loading and translocarestric-tion of assimi-lates in source tissue (Okano et al., 1984; Spence et al., 1990; Wolfenden and Mansfield, 1991; Wellburn and Wellburn, 1994). It is interesting to note, however, that the enhanced accumulation of photoassimilates in O3-treated leaves was not
as-sociated with changes in the relative balance be-tween root and shoot growth (K); implying that other factors (e.g. enhanced rates of night-time export) may have counter-balanced the increased storage of starch in the light. The finding that O3
enhanced rates of dark respiration (Rd) at the sensitive stage of growth is consistent with previ-ous reports (see Dizengremel et al., 1994) and probably reflects the ‘costs’ associated with the detoxification of O3 and the repair of damaged
membranes and proteins (Amthor, 1988, Alscher and Amthor, 1988). The diversion of resources to fuel repair (maintenance) processes utilized addi-tional carbohydrate that would otherwise have been available to support growth (Alscher and Amthor, 1988; Amthor, 1988). Consequently, the enhanced Rd following O3-treatment would be
expected to contribute to the observed decline in biomass accumulation and plant growth rate dur-ing the early stages of the fumigation.
Ozone reduced the number of seeds produced per plant (by 31%), through a reduction in the number of flower spikes per plant and the number of seed capsules produced on each flower spike (Table 4). However, paralleling the lack of effects of the pollutant onK, the allocation of resources to seed production relative to vegetative biomass (i.e. reproductive effort) was not significantly af-fected by O3. This suggests that the decline in seed
production was comparable with the magnitude of the change in whole plant biomass on an individual plant basis (Pearson et al., 1996). Seed weight was also not affected by O3, a finding
consistent with previous studies on P. major
(Reiling and Davison, 1992b; Pearson et al., 1996; Whitfield et al., 1996; Lyons and Barnes, 1998) and some crops species (Oshima et al., 1975; 1979; Manning and Feder, 1976; Cooley and Manning, 1987; Mckee et al., 1997; Ollerenshaw and Lyons, 1999), but contrasting with other reports where O3 exposure was found to reduce seed weight
(Fuhrer et al., 1992; Fangmeier et al., 1994; Wahid et al., 1995; Ojanpera¨ et al., 1998). The lack of effect of O3on seed weight and
‘reproduc-tive effort’ indicates that there was no change in the allocation of carbon to the development of individual seeds. It remains to be established whether reproductive structures are directly af-fected by O3 (Bosac et al., 1994).
The impacts of O3 on the assimilation and
allocation of newly fixed carbon were consistent with the observed effects of the pollutant on plant biomass accumulation, and plants produced fewer seeds, despite some evidence of compensatory growth responses following prolonged exposure to the pollutant (Table 3). These results imply that the decline in plant biomass induced by O3at the
final harvest was largely the result of detrimental impacts during the early stages of development (i.e. during seedling and juvenile stages of growth; 0 – 28 days) and that in the absence of the ob-served compensatory growth responses, the im-pact of prolonged exposure to the pollutant may have been considerably greater. The greater sensi-tivity of young plants to O3 may have
consider-able importance within natural communities, by decreasing the competitive fitness of the plants (Lyons and Barnes, 1998). Field-based studies are needed to verify these findings. The mechanism(s) underlying the shift in O3 resistance with plant
age is not clear, however there was no evidence to suggest (from measurements of stomatal conduc-tance) that the dose of the pollutant absorbed by leaves declined with developmental age (see Fig. 2). Previous studies on ‘Valsain’ have suggested that changes in resistance with plant age may be associated with alterations in antioxidant status, particularly in the apoplast (Lyons et al., 1999a). The relative importance of apoplastic antioxidants in the detoxification of O3is currently the focus of
Acknowledgements
The authors thank Dr A. Borland for her guid-ance in the analysis of carbohydrates and infor-mative discussions during the writing-up of this work, and Mr P. Green and Mr A. White for technical assistance. The work was financed by The Swales Foundation and the Overseas Devel-opment Administration through awards made to JDB, with additional support to cover the day-to-day running costs of the phytotron provided by The Royal Society, Newcastle University Equip-ment Fund.
References
Alscher, R.G., Amthor, J.S., 1988. The physiology of free-rad-ical scavenging: maintenance and repair processes. In: Schulte-Hostede, S., Darrall, N.M., Blank, L.M., Well-burn, A.R. (Eds.), Air Pollution and Plant Metabolism. Elsevier, New York, pp. 94 – 110.
Amthor, J.S., 1988. Growth and maintenance respiration in leaves of bean (Phaseolus 6ulgaris L.) exposed to O3 in open-top chambers in the field. New Phytol. 110, 319 – 325. Balaguer, L., Barnes, J.D., Panicucci, A., Borland, A.M., 1995. Production and utilisation of assimilates in wheat (Triticum aesti6umL.) leaves exposed to elevated O3and/or CO2. New Phytol. 129, 557 – 568.
Barnes, J.D., Wellburn, A.R., 1998. Air pollutant combina-tions. In: De Kok, L.J., Stuhlen, I. (Eds.), Responses of Plant Metabolism to Air Pollution and Global Change. Backhuys, Leiden, pp. 147 – 164.
Barnes, J.D., Eamus, D., Brown, K.A., 1990. The influence of ozone, acid mist and soil nutrient status on Norway spruce [Picea abies (L.) Karst.]. 2. Photosynthesis, dark respira-tion and soluble carbohydrates of trees during late autumn. New Phytol. 115, 149 – 156.
Barnes, J.D., Ollerenshaw, J.H., Whitfield, C.P., 1995. Effects of elevated CO2 and/or O3 on growth, development and
physiology of wheat (Triticum aesti6umL.). Global Change Biol. 1, 129 – 142.
Barnes, J.D., Hull, M.R., Davison, A.W., 1996. Impact of air pollutants and rising CO2 in wintertime. In: Yunus, M.,
Iqbal, M. (Eds.), Plant Response to Air Pollution. John Wiley and Son, London, pp. 135 – 166.
Blum, U., Heck, W.W., 1980. Effects of acute ozone exposures on snap bean at various stages of its life cycle. Environ. Exp. Bot. 20, 73 – 85.
Borland, A.M., Farrar, J.F., 1985. Diel patterns of carbohy-drate metabolism in leaf blades and leaf sheaths of Poa annuaL. andPoaxjemtlandica(Almq.) Richt. New Phy-tol. 100, 519 – 531.
Bosac, C., Roberts, J.A., Black, V.J., Black, C.R., 1994. Impact of O3 and SO2 on reproductive development in
oilseed rape (Brassica napusL.).2. Reproductive site losses. New Phytol. 126, 71 – 79.
Chameides, W.L., Kasibhatla, P.S., Yienger, J., Levy, H., 1994. Growth of continental-scale metro-agro-plexes, re-gional ozone pollution, and world food production. Sci-ence 264, 74 – 77.
Cooley, D.R., Manning, W.J., 1987. The impact of ozone on assimilate partitioning in plants: a review. Environ. Pollut. 47, 95 – 113.
Danielsson, H., Gelang, J., Pleijel, H., 1999. Ozone sensitivity, growth and flower development in Phleumgenotypes of different geographic origin in the Nordic countries. Envi-ron. Exp. Bot. 42, 41 – 49.
Darrall, N.M., 1989. The effect of air pollutants on physiolog-ical processes in plants. Plant Cell Environ. 12, 1 – 29. Dizengremel, P., Sasek, T.W., Brown, K.J., Richardson, C.J.,
1994. Ozone-induced changes in primary carbon metabolism enzymes of loblolly-pine needles. J. Plant Phys-iol. 144, 300 – 306.
Dubois, M., Gilles, K.A., Hamilton, J.K., Rebus, P.A., Smith, F., 1956. Colorimetric method for the determination of sugars and related substances. Anal. Chem. 28, 350 – 356. Ebel, B., Rosenkranz, J., Schiffgens-Gruber, A., Lu¨tz, C.,
1990. Cytological observations on spruce needles after prolonged treatment with ozone and acid mist. Environ. Pollut. 64, 323 – 335.
Fangmeier, U., Brockerhoff, U., Gru¨ters, U., Ja¨ger, H.-J., 1994. Growth and yield responses of spring wheat (Triticum aesti6umL. cv. Turbo) grown in open-top cham-bers to ozone and water stress. Environ. Pollut. 83, 317 – 325.
Farrar, J.F., 1980. Allocation of carbon to growth, storage and respiration in the vegetative barley plant. Plant Cell Environ. 3, 97 – 105.
Farrar, J.F., 1993. Carbon partitioning. In: Hall, D.O., Scur-lock, J.M.O., Bolhar-Nordenkampf, H.R., Leegood, S.C., Long, S.P. (Eds.), Photosynthesis and Production in a Changing Environment. A Field and Laboratory Manual. Chapman and Hall, London, pp. 232 – 246.
Fuhrer, J., Grandjean Grimm, A., Tschannen, W., Shariat-Madari, H., 1992. The response of spring wheat (Triticum aesti6umL.) to ozone at higher elevations. II. Changes in yield, yield components and grain quality in response to ozone flux. New Phytol. 121, 211 – 219.
Fuhrer, J., Ska¨rby, L., Ashmore, M.R., 1997. Critical levels for ozone effects on vegetation in Europe. Environ. Pollut. 97, 91 – 106.
Gu¨nthardt-Goerg, M.S., Keller, T., Matyssek, R., Scheideg-ger, C., 1993. Differentiation and structural decline in the leaves and bark of birch (Betula pendula) under low ozone concentrations. Trees 7, 104 – 114.
Heck, W.W., Adams, R.M., Cure, W.W., Heagle, A.S., Heggestad, H.E., Kohut, R.J., Kress, L.W., Rawlings, J.O., Taylor, O.C., 1983. A reassessment of crop loss from ozone. Environ. Sci. Technol. 12, 572A – 581A.
Held, A.A., Mooney, H.A., Gorham, J.N., 1991. Acclimation to ozone stress in radish: leaf demography and photosyn-thesis. New Phytol. 118, 417 – 423.
Huber, S.C., Huber, J.L., 1992. Role of sucrose – phosphate synthase in sucrose metabolism in leaves. Plant Physiol. 99, 1275 – 1278.
Hunt, R., 1990. Basic Growth Analysis. Unwin Hyman, London.
Kasana, M.S., 1991. Sensitivity of three leguminous crops to O3as influenced by different stages of growth and
develop-ment. Environ. Pollut. 69, 131 – 149.
Lee, E.H., Tingey, D.T., Hogsett, W.E., 1988. Evaluation of ozone exposure indices in exposure – response modelling. Environ. Pollut. 53, 43 – 62.
Lyons, T., Barnes, J.D., 1998. Influence of plant age on ozone resistance inPlantago majorL. New Phytol. 138, 83 – 89. Lyons, T.M., Barnes, J.D., Davison, A.W., 1997.
Relation-ships between ozone resistance and climate in European populations ofPlantago major. New Phytol. 136, 503 – 510. Lyons, T., Ollerenshaw, J.H., Barnes, J.D., 1999a. Impacts of ozone on Plantago major: apoplastic and symplastic an-tioxidant status. New Phytol. 141, 253 – 263.
Lyons, T., Plo¨chl, M., Turcsa´nyi, E., Barnes, J.D., 1999b. Extracellular antioxidants: a protective screen against ozone? In: Agrawal, S., Agrawal, M. (Eds.), Environmen-tal Pollution and Plant Responses. CRC Press, Boca Ra-ton, pp. 183 – 201.
Manning, W.J., Feder, W.A., 1976. Effects of ozone on eco-nomic plants. In: Mansfield, T.A. (Ed.), Effects of Air Pollutants on Plants. Cambridge University Press, Cam-bridge, pp. 45 – 60.
Mckee, I.F., Bullimore, J.F., Long, S.P., 1997. Will elevated CO2 concentrations protect the yield of wheat from O3
damage? Plant Cell Environ. 20, 77 – 84.
Ojanpera¨, K., Pa¨tsikka¨, E., Yla¨ranta, T., 1998. Effects of low ozone exposure of spring wheat on net CO2 uptake,
Ru-bisco, leaf senescence and grain filling. New Phytol. 138, 451 – 460.
Okano, K., Ito, O., Takeba, G., Shimizu, A., Totsuka, T., 1984. Alteration of13C-assimilate partitioning in plants of
Phaseolus 6ulgaris exposed to ozone. New Phytol. 97, 155 – 163.
Ollerenshaw, J.H., Lyons, T., 1999. Impacts of ozone on the growth and yield of field-grown winter wheat. Environ. Pollut. 106, 67 – 72.
Oshima, R.J., Taylor, O.C., Braegelmann, P.K., Baldwin, D.W., 1975. Effects of ozone on the yield and plant biomass of a commercial variety of tomato. J. Environ. Qual. 4, 463 – 464.
Oshima, R.J., Braegelmann, P.K., Flagler, R.B., Teso, R.R., 1979. The effects of ozone on the growth, yield and
partitioning of dry matter in cotton. J. Environ. Qual. 8, 474 – 479.
Pearson, S., Davison, A.W., Reiling, K., Ashenden, T., Ollerenshaw, J.H., 1996. The effects of different ozone exposures on three contrasting populations of Plantago major. New Phytol. 132, 493 – 502.
Pell, E.J., Landry, L.G., Eckardt, N.A., Click, R.E., 1994. Effects of gaseous air pollutants on ribulose bisphosphate carboxylase/oxygenase: effects and implications. In: Alscher, R.G., Wellburn, A.R. (Eds.), Plant Response to the Gaseous Environment. Molecular, Metabolic and Physiological Aspects. Chapman and Hall, London, pp. 239 – 254.
Reiling, K., Davison, A.W., 1992a. Spatial variation in ozone resistance of British populations ofPlantago majorL. New Phytol. 122, 699 – 708.
Reiling, K., Davison, A.W., 1992b. Effects of a short ozone exposure given at different stages in the development of Plantago majorL. New Phytol. 121, 643 – 647.
Reiling, K., Davison, A.W., 1994. Effects of exposure to ozone at different stages in the development ofPlantago majorL. on chlorophyll fluorescence and gas-exchange. New Phytol. 128, 509 – 514.
Reiling, K., Davison, A.W., 1995. Effects of ozone on stom-atal conductance and photosynthesis in populations of Plantago majorL. New Phytol. 129, 587 – 594.
Schiffgens-Gruber, A., Lu¨tz, C., 1992. Ultrastructure of meso-phyll cell chloroplasts of spruce needles exposed to O3, SO2
and NO2alone and in combination. Environ. Exp. Bot. 32,
243 – 254.
Spence, R.D., Rykiel, E.J., Sharpe, P.J.H., 1990. Ozone alters carbon allocation in loblolly pine: assessment with carbon-11 labelling. Environ. Pollut. 64, 93 – 106.
Wahid, A., Maggs, R., Shamsi, S.R.T.A., Bell, J.N.B., Ash-more, M.R., 1995. Air pollution and its impacts on wheat yield in the Pakistan Punjab. Environ. Pollut. 88, 147 – 154. Walmsley, L., Ashmore, M.R., Bell, J.N.B., 1980. Adaptation of radish Raphanus sati6usL. in response to continuous exposure to ozone. Environ. Pollut. 23, 165 – 177. Wellburn, F.A.M., Wellburn, A.R., 1994. Atmospheric ozone
affects carbohydrate allocation and winter hardiness of Pinus halepensis(Mill.). J. Exp. Bot. 45, 607 – 614. Whitfield, C.P., Davison, A.W., Ashenden, T.W., 1996.
Inter-active effects of ozone and soil volume onPlantago major. New Phytol. 134, 287 – 294.
Wolfenden, J., Mansfield, T.A., 1991. Physiological distur-bances in plants caused by air pollutants. Proc. R. Soc. Edinburgh 98B, 117 – 138.
Younglove, T., McCool, P.M., Musselman, R.C., Kahl, M.E., 1994. Growth-stage dependent crop yield response to ozone exposure. Environ. Pollut. 86, 287 – 295.
Zheng, Y., Stevenson, K.J., Barrowcliffe, R., Wang, H., Chen, S., Barnes, J.D., 1998. Ozone levels in Chongqing: a poten-tial threat to crop plants commonly grown in the region? Environ. Pollut. 99, 299 – 308.