*Fax:#44-0161-280-6783.
E-mail address:[email protected] (R.D. Baker).
Calculating the expected failure rate of complex equipment
subject to hazardous repair
Rose D. Baker*
Centre for Operational Research and Applied Statistics, University of Salford, Salford, M5 4WT, UK
Abstract
In hazardous repair of a repairable system, there is a strong probability of further failure during a period immediately following the repair. To model failures of such systems under failure-based maintenance, a class of point process models is proposed in which the failure intensity is a function only of equipment age and of time since most recent repair. Cost modelling requires the computation of the expected number of failures by agetas a function of equipment age. This expected number is shown to satisfy a Volterra (integral) equation of the second kind that generalises the renewal equation. A solution algorithm is given. A simple (four-parameter) model from this class is introduced, and the methodology is exempli"ed using a database of failures of non-maintained medical equipment. ( 2000 Elsevier Science
B.V. All rights reserved.
Keywords: Renewal equation; Failure rate; General repair; Poisson process; Repairable systems
1. Introduction
Mathematically, the failures of a repairable sys-tem such as an ECG monitor are most naturally described using the failure intensity o. This is the instantaneous rate of failure of a system at age tgiven its previous history of failures and mainten-ance interventions. In this paper the equipment considered was not subject to preventive mainten-ance, so that the failure intensity was a function of equipment age and failure history only.
Failure intensity usually increases with age for mechanical equipment, but may decrease with age for electronic equipment or software, where defects are gradually weeded out (e.g. [1]). Such models of
failure intensity as the power law and loglinear Poisson processes are often used. The distinguish-ing feature of Poisson processes is that the previous history of failure times t
1,2,tn does not a!ect failure intensity.
However, in practice failure repair does some-times a!ect failure rate. In the extreme case of a system comprising a single component that is replaced on failure, such as a lightbulb, the inter-failure periods constitute a renewal process, and one can imagine that for more complex systems each repair might replace and so renew a propor-tion of the components. This would usually (but not inevitably) lead to a decrease of failure intensity following repair. Brown and Proschan [2] developed an imperfect repair model, in which a repair renewed the system with probabilityp, while with probability 1!p it had no e!ect on failure intensity.
A common experience with systems encountered in daily life, such as photocopiers, is that the system has anincreasedintensity of failure just after failure repair. Either as a result of the repair fresh prob-lems were created, or the repair was incomplete and did not really solve the original problem.
With the limited data that are typically available, it is not possible to"t complex models that include the whole history of repair. In general, the most recent repair should have a larger e!ect on current failure rate than earlier repairs. A model in which failure intensity is a function only of system age and of time since last repair is therefore attractive. These variables can equivalently be taken as system age and age at last repair.
Such models generalise both Poisson processes and renewal processes, and so can be used to ap-proximate the e!ect of repair on failure rate, whether it is due to component replacement or to hazardous or imperfect repair. These models can be more pessimistic than the Brown and Proschan model in that&imperfect repair'is here allowed to mean that the repair might even increase failure rate over that arising from a minimal repair.
This paper shows how to carry out computations for calculating optimum age-based replacement policies under such models. For completeness, the other steps needed in the"tting of such models to data are also (very) brie#y summarised. Without an exploratory analysis of data, and model"tting and validation, the functional forms and parameter values of an appropriate model would be unknown. However, those steps are not the intended focus of this paper. A much fuller account of them is given in a companion paper [3].
Before going further, it is necessary to give a more precise de"nition ofo(tDH
t), the intensity of failure at aget, whereH
tdenotes the history of the failure process (number and timing of failures) to aget.N(tDH
t) is the number of failures occurring by aget, and the intensity is de"ned as
o(tDH which two or more failures never occur in the same
in"nitesimal interval dt, theno(tDH
t) dttends to the probability of a failure occurring in the in" nitesi-mal interval (t,t#dt], given the previous history of the process up to age t. Then o(tDH
t) dt is the probability that a single failure occurs in the in" ni-tesimal interval dt, and so is also the expected number of failures occurring in dt. Hence,o(tDH
t) is the expected failure rate at timetgiven the previous history of failures.
For a Poisson process, the intensity o(tDH t) is numerically equal to the expected rate of occur-rence of failures (ROCOF)l(t). Althougho(t) is the quantity that is estimated from data, it isl(t) that is required for replacement calculations. Note that
l(t), being an expected rate, is not conditional on the failure history. Ascher and Feingold [1] or Thompson [4] discuss these concepts in more detail.
The class of failure intensity models proposed here iso"o(u,t), whereuis the system age at the most recent failure. A simple heuristic model of this form has
o(u,t)"ab(at)b~1M1#cexp(!g(t!u))N, (1) wherea,b, candgare positive constants. Immedi-ately after repair, at ageu`, the failure intensity is scaled up above the power-law process level at age u~by a factor of 1#c, which then decays back to unity. Ifcis negative, the model gives a decreased failure intensity after repair. Note that we require c*!1 so thato*0. It is also possible to generate many other plausible models from this class.
Lawless and Thiagarajah [5] discuss models of type o"exp(hTz(t)), where h is a vector of para-meter values andz(t) is a function of t and H(t). Models of this type do not represent repair e!ects well. By taking one element ofzas a Heaviside step function one could obtain models in which the failure intensity would jump either up or down after repair, but the modi"cation to the&baseline' inten-sity would not then attenuate with time.
Their formalism is more general than that pre-sented here in that it allows the full history of repairs to a!ect intensity, but is less general in that their intensity is a product of factors, so that for example model 1 is not of their type.
a system experiences a power-law process of shocks, and k'0 shocks cause a failure, where kneed not be an integer. This model is of the class proposed here, and can model either hazardous (k(1) or partially renewing repairs.
With only three parameters however, the dura-tion and size of any repair e!ect can not both be arbitrary. A realistic model needs two parameters to specify the &baseline' Poisson failure process, then a further two to parameterise the repair e!ect: one to specify its size, and one to specify its duration.
Under an age-based replacement policy we need to compute the optimum replacement age. With discounting of costs at rate c, the sum of money D(¹,c) needed to"nance initial system purchase at costCand expected repairs to replacement at time ¹is
D(¹,c)"C#b
P
T 0l(u) exp(!cu) du, (2)
where l(u) is the ROCOF introduced earlier and bis the mean repair cost. Costs for the replacement system are all downweighted by a factor exp(!c¹), costs for the second replacement by a factor exp(!2c¹) and so on, so that the sum needed to cover all future costs, given an in"nite series of replacements at age¹is
S(¹)"D(¹,c)/(1!exp(!c¹))
"C#b:T0l(u) exp(!cu) du 1!exp(!c¹)
(see e.g. [7,8] for a discussion of discounting). For small values of the discounting ratec,
S(¹)KC#:T0l(u) du
c¹ "D(¹,c)/c¹,
so that as cP0,cS(¹)PD(¹, 0)/¹, and the opti-mum age-based replacement policy that minimises the discounted sumS(¹) becomes equivalent to the policy that minimises cost per unit timeD(¹, 0)/¹. To calculate either S(¹) orD(¹,c)/¹one must compute the ROCOFl(t)"rst.
A direct way to computel(t) and its integral
M(t)"
P
t 0l(u) du (3)
for an assumed o(u,t) is by simulation. A large number of realizations of the point process are generated, andM(t), the expected cumulative num-ber of failures by age t, read o! as the sample average number of failures per system by timet. To simulate a realization of the failure process, after each failure, one generates a random time to the next failure.
The pdf of failure at timetafter a repair at time uis
f(u,t)"o(u,t) exp
A
!P
t uo(u,v) dv
B
(4)and for convenience de"ne f(u,t)"0 when u't. This follows becauseo(u,v), besides being a failure intensity, is also numerically equal to the hazard function for the"rst failure at timev'u. Eq. (4) is a standard equation relating the hazard function to the pdf, but where here the time origin is the last repair timeurather than zero.
The all-purpose&inverse method'of random vari-ate generation is to genervari-ate a random number Xfrom the uniform distribution to correspond to the distribution function F(u,t)":t
uf(u,v) dv, and to then solve the equationF(u,>)"X to obtain the required random variate>. For the model in Eq. (1), this nonlinear equation involves the incom-plete gamma function, which can be solved by Newton}Raphson iteration.
Simulation, which seems at"rst to be a simple and direct method of calculation, is in fact more di$cult to program than the method developed below. In addition, accuracy increases only slowly with the number of realizations.
Much previous work on&general repair' has used virtual age models, in which repair changes the virtual or e!ective age of a system, and integral equations for M(t) have been derived [9,10]. Baker and Wang [11] "tted such an age-reduction model. Other models also lead to renewal-type equations [12].
2. A generalised renewal equation
Since the quantity l(t) dt is also the uncondi-tional probability of a failure occurring in (t,t#dt), it follows thatl(t) is the density function of the "rst, second, etc., failure occurring at t. Hence,
This equation looks simpler on discretizing the interval (0,t) into n steps of D"t/n, when f(u,v)
On rewriting Eq. (5) as an equation for l(u), formingl(u)f(u,t) and integrating over all possible last failure timesu, we have
P
tThis is an integral equation forl(t), very similar to the renewal equation, except that, for a renewal process, the general function ofuandtappearing here reduces to f(t!u).
The e!ect of repair on intensity may well be absent before the "rst failure, because the system starts from&new'rather than from a repaired state. For example, a simple power-law intensity
o(t)"ab(at)b~1 could be used instead of Eq. (1),
and on proceeding as before this yields the modi"ed equation
Note that it is possible to derive a second integral equation, which corresponds to premultiplying Eq. (5) byfrather than postmultiplying, which is
l(0,t)"f(0,t)#
P
t 0f(0,u)l(u,t) du
in an obvious notation, but this equation does not lend itself to recursive solution as does Eq. (7). It cannot be derived when the pdf of "rst failure is anomalous,f
0Of.
On integrating Eq. (7) and changing the order of double integration,
The starting point for numerical calculation of
3. Computation of cost functions
The general solution developed here is an ad-aptation of the method described in [13]. Setting t"0 in Eq. (7), we havel(0)"f(0, 0), and on dis-cretizing,l0"f
00.
Carrying out integrals by the trapezoidal rule incurs an error of O(D2), and Eq. (7) becomes
so thatli is found recursively as
l
The pdffis similarly discretized, with
f
It is not necessary to compute and store the full matrix f before use, as elements f
ji,j)i, can be computed forifrom 1 ton, by storing the exponent of Eq. (10) and the hazardso
j,i~1, and updating the lower triangle fromi!1 toi.
Again,Mis found as the integral oflby discretiz-ing Eq. (3) as
Finally, accuracy can be greatly improved by Richardson extrapolation, in which
MP(4MD!M2D)/3.
The quantity of interestlorMmust then also be calculated at twice the step length, which requires little extra computation if done in parallel with the original calculation. Use of this extrapolation is equivalent to use of Simpson's rule, and produces an error of order O(D4).
The algorithm withntime steps requires time of O(n2) to execute, and storage arrays of size O(n).
4. Example
An inventory and maintenance database of medical equipment serviced by a large teaching hospital was studied. Besides purchase cost, the main data were ages of equipment at failure. Sev-eral items of equipment subject to failure mainten-ance only, such as ECG monitors, showed an increased failure rate for some time after repair.
In general, before a cost function can be plotted as a function of replacement age¹, there is a need for at least the following steps:
1. an exploratory analysis of the data, that will indicate a suitable failure rate model;
2. "tting of a model or models to data;
3. some assurance that the model"t is acceptable.
It is not the purpose of this paper to discuss these issues, so the methodology used is presented only brie#y.
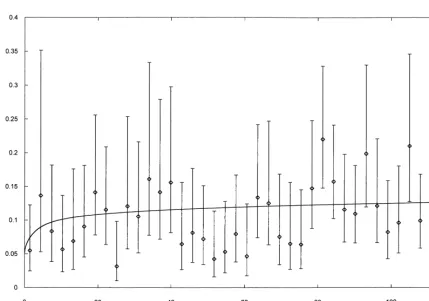
Aalen plots [14] provide a non-parametric estimate of failure intensity of repairable systems as a function of machine age. This can be written as
A(t)"m(t)+ i/1
1/>(s
i), (11)
where>(s) is the number of systems operational at ages,s
i is the system age at theith failure andm(t) the total number of failures by aget. Fig. 1 shows the Aalen plot for ECG monitors.
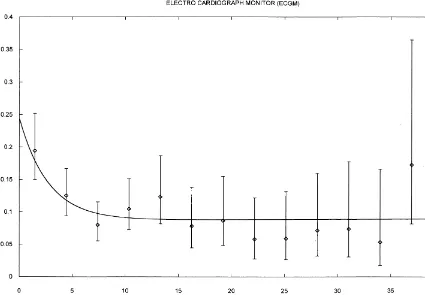
Besides a plot of failure intensity as a function of age, it was also necessary to plot the hazard of the next failure as a function of time from repair. Eq. (11) still applies, except that the&lifetime'tnow becomes the failure interarrival period. Fig. 2 shows this plot for ECG monitors.
Models were"tted by the method of maximum likelihood, where the likelihood function is L"<N
k/1Lk, andLk, the likelihood function for thekth ofN machines of one type, is
L
Subscriptskhave been suppressed for clarity on the right-hand side. Aget
Fig. 1. Aalen estimator of the rate of occurrence of failures for ECG monitors, with 95% con"dence interval, and"tted curve from the heuristic model. Diamonds show Aalen estimates, the vertical lines show con"dence intervals.
age at which observation ceases. This form of likeli-hood function is derived in [14] as the limit of a product-moment form.
Fortran95 programs written by the author and using the NAG library (e.g. [15]) were used to carry out model"tting.
Goodness of model"t was assessed by examina-tion of Figs. 1 and 2, where the model"t line can be seen to lie well within the 95% con"dence intervals. Fitted model parameters were a("0.072 per month,bK"1.07,c("1.85,g("0.37 per month. The low value ofbmeans that failure intensity increases only slowly with age, with roughly 0.07 failures per month. After repair, failure intensity increased by a factor of 2.85, decaying back to &baseline' over a period of order 1/gor 3 months.
The curve in Fig. 1 was calculated by dividing 20 years into 10 000 intervals, and this calculation
took a few seconds on a Pentium 2 processor. The discretized form of Eq. (9) was used. The "tted curve in Fig. 2 was derived by calculating the haz-ard of ("rst) failure after repair after each observed failure time t
i for each ECG monitor, and averaging.
Fig. 2. Aalen estimator of the hazard of failure after repair for ECG monitors, with 95% con"dence interval, and the"tted curve from the heuristic model.
litigation by patients impose a service life of only 10}20 years. Christer and Scarf [16] discuss this situation.
5. Conclusions
A simple class of models of repairable systems failure and general repair has been presented, to-gether with what is perhaps the &obvious' model from this class. The model"ts the data reasonably well. A use of such model-"tting is to identify haz-ardous repair, so that practice could be changed. Without extensive data analysis it may not be clear that there is a problem. Even after analysis, the cause of the problem remains to be investigated. It may not be due to any error on the part of the repair personnel, but rather to replacement of failed components with decreasing force of mortality
(DFOM) components, whose hazard of failure is initially high. Hazardous repair may thus not be completely removable. Either way, such modelling both quanti"es the e!ect and enables a cost}bene"t analysis of possible remedial actions to be under-taken.
Although models are formulated most naturally in terms of failure intensityo, calculation of costs under age-based replacement policies requires the computation of another measure of &failure rate', the ROCOF or expected rate of occurrence of failuresl(t).
An algorithm for calculating the ROCOF as a function of system age, and so"nding optimum age-based replacement policies, has been presented and its use exempli"ed. A fortran95 program is available from the author on request.
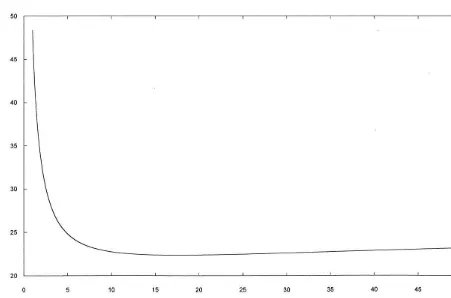
Fig. 3. Cost of an age-based replacement policy for ECG monitors by replacement age, for the heuristic model.
and in assessing the performance of the class of models described here on typical failure data. They could for example be compared with models of the type discussed by Calabria and Pulcini [6], and also with virtual age models, in which repair cha-nges the failure intensity to that corresponding to an earlier or later age. A drawback of virtual age models is that they can not accommodate the short-term increased risk of failure after a hazard-ous repair.
These models could also be used to model the failure intensity of maintained plant. The situation there is more complex, as the e!ect of maintenance must also be modelled.
There is also scope for more theoretical work in this area. For example, derivation of asymptotic results akin to those known for renewal processes. A referee has suggested derivation of the necessary
conditions for the optimum replacement period to be"nite.
Acknowledgements
I would like to thank two anonymous referees, whose comments have improved the clarity of this paper.
References
[1] H. Ascher, H. Feingold, Repairable Systems Reliability. Modeling, Inference, Misconceptions and their Causes, Marcel Dekker, New York, 1984.
[3] R.D. Baker, Data-based modelling of the failure rate of repairable equipment, Lifetime Data Analysis, 2000, in press.
[4] W.A. Thompson Jr., Point Process Models with Applica-tions to Safety and Reliability, Chapman & Hall, New York, 1988.
[5] J.F. Lawless, K. Thiagarajah, A point-process model in-corporating renewals and time trends, with application to repairable systems, Technometrics 38 (1996) 131}138. [6] R. Calabria, G. Pulcini, On testing for repair e!ect and
time trend in repairable mechanical units, Communica-tions in Statistics, Theory and Methods 28 (1999) 367}387. [7] A.H. Christer, Operational Research applied to industrial maintenance and replacement, In: R. Eglese, G. Rand (Eds.), Developments in Operational Research, Pergamon Press, Oxford, 1984, pp. 31}58.
[8] D.W. Hands, Introductory Mathematical Economics, Heath & Co., Lexington, MA, p. 185.
[9] J.S. Dagpunar, Renewal-type equations for a general repair process, Quality and Reliability Engineering Inter-national 13 (1997) 235}245.
[10] J.S. Dagpunar, Properties and computational results for a general repair process, Naval Research Logistics 45 (1998) 391}405.
[11] R.D. Baker, W. Wang, Developing and testing the delay-time model, Journal of the OR Society 44 (1993) 361}374.
[12] M.S. Finkelstein, The concealed age of distribution functions and the problem of general repair, Journal of Statistical Inference and Planning 65 (1997) 315}321. [13] W.H. Press, B.P. Flannery, S.A. Teukolsky, W.T.
Vetter-ling, Numerical Recipes, 2nd Edition, Cambridge Univer-sity Press, Cambridge, 1992.
[14] P.K. Andersen,". Borgan, R.D. Gill, N. Keiding, Statist-ical Models Based on Counting Processes, Springer, New York, 1993.
[15] T. Hopkins, C. Phillips, Numerical Methods in Practice using the NAG Library, Addison-Wesley, Wokingham, 1988.