www.elsevier.com / locate / econbase
How accurate are confidence intervals for impulse responses in
large VAR models?
a,b ,
*
aLutz Kilian
, Pao-Li Chang
a
Department of Economics, University of Michigan, Ann Arbor, MI 48109-1220, USA
b
Centre for Economic Policy Research, London, UK
Abstract
We study the finite-sample accuracy and average length of pointwise confidence intervals for impulse responses in vector autoregressive models with many variables and many lags. Our results complement existing simulation evidence based on much simpler bivariate models. 2000 Elsevier Science S.A. All rights reserved.
Keywords: Monetary policy; Bootstrap; Delta method; Monte Carlo integration
JEL classification: C32; C53
1. Introduction
Estimates of impulse responses to monetary policy shocks play an important role in empirical macroeconomics. Runkle (1987) questioned the reliability of the estimated policy responses and proposed the use of bootstrap confidence intervals and of intervals based on the asymptotic normal approximation. Since then, it has become standard practice in the VAR literature to display confidence bands for impulse response estimates. The methods of constructing asymptotic and bootstrap
¨
confidence bands for VAR impulse responses have subsequently been refined by Lutkepohl (1990), Kilian (1998a), and Wright (1996). Some progress in assessing the reliability of impulse response
¨
confidence intervals has been made in recent years (e.g., Griffiths and Lutkepohl, 1993; Fachin and Bravetti, 1996; Kilian, 1998a,b; Sims and Zha, 1999). This paper breaks new ground along three dimensions.
First, one serious limitation of existing studies is that they tend to focus on bivariate VAR(1) models. Whether their results generalize to large-dimensional VAR models with many lags–models of the type used in applied studies of monetary policy–remains an open question. In contrast, in this
*Corresponding author. Tel.: 11-734-764-2320; fax: 11-734-764-2769. E-mail address: [email protected] (L. Kilian).
study we will analyze VARs with four, five, and seven variables and between four and twelve lags. Second, existing studies tend to be based on artificial data generating processes (DGPs) without economic interpretation, whose realism is often questionable. In contrast, in this study we treat vector autoregressive models estimated by leading VAR practitioners as the DGP, and we focus exclusively on responses to monetary policy shocks. Third, results of existing studies based on artificial DGPs are difficult to interpret in that the degree of coverage accuracy may differ greatly across impulse response functions. The fact that the DGP is ad hoc makes it impossible to decide which of these conflicting results is representative for applied work. In this study, we avoid this ambiguity by focusing directly on the responses of interest in applied work.
2. Simulation design
Our study compares four methods of constructing pointwise confidence intervals. Perhaps the most popular method of constructing error bands for impulse responses is the Bayesian procedure available in RATS. Kilian (1998a) shows that this procedure has several undesirable features and cannot be recommended. We will focus instead on a recent modification of the Bayesian Monte Carlo integration method used by Sims and Zha (1999). This method has been shown to be very competitive in simple VAR models even by classical criteria (see Kilian, 1998a,b). We also include the bootstrap method of Runkle (1987) and the bias-adjusted bootstrap method proposed by Kilian (1998a) as the two leading
1
representatives of bootstrap methods for VAR impulse responses. Both methods are based on the percentile bootstrap interval (see Davison and Hinkley, 1997; Efron and Tibshirani, 1993). We do not consider percentile-t bootstrap confidence intervals, because these intervals tend to be unreliable and unnecessarily wide in the present context (see Kilian (1999), Berkowitz and Kilian (2000) for further
2 ¨
discussion). Finally, we consider the asymptotic delta method interval of Lutkepohl (1990). All four methods are well documented in the literature, and the interested reader is referred to the references cited.
Our DGPs are based on three typical VAR studies by leading practitioners. These studies are representative examples of monetary policy studies in the literature. We treat the estimated VAR models as the DGPs for our study and model the innovations as normally distributed. The models include a 5-variable VAR(6) model based on 197 monthly post-Bretton Woods era observations (based on Eichenbaum and Evans, 1995), a 4-variable VAR(12) model based on 348 monthly postwar observations (based on Bernanke and Gertler, 1995), and a 7-variable VAR(4) model based on 136 quarterly postwar observations (based on Christiano et al., 1996). In all cases, the modulus of the dominant root of the VAR-DGP is less than unity. The data are described in the appendix.
1
In order to ensure the highest possible accuracy, we do not use the computational short-cut proposed in Kilian (1998a) and referred to as the bootstrap-after-bootstrap method, but rather the unabbreviated double bootstrap loop. The first-order mean bias corrections are estimated by bootstrap as well. In large VAR systems this approach is faster computationally than calculating the asymptotic bias estimates. Nevertheless, for some DGPs, assessing the coverage accuracy of the bias-adjusted bootstrap interval may require more than one year of continuous simulations on a Pentium 230 computer.
2
Throughout the paper, we follow the standard practice of specifying all regressions in levels with an intercept. The regression models are estimated by the method of least squares. We generate 1000 Monte Carlo trials of the same length as the original data. The enormous computational costs do not allow us to increase the number of trials or to consider additional models (see footnote 1). For each trial, we construct nominal 90 percent bootstrap confidence intervals using 1000 bootstrap replications of the underlying DGP, and 100 bootstrap replications for bias estimation. Similarly, we use 1000 draws from the posterior distribution for the corresponding Monte Carlo integration intervals. We evaluate the coverage rate (defined as the fraction of trials in which the confidence interval includes the true impulse response) and average length of each of the four confidence intervals across the 1000 trials. The Monte Carlo simulation standard error for the coverage estimates is less than one percent.
3. Simulation results
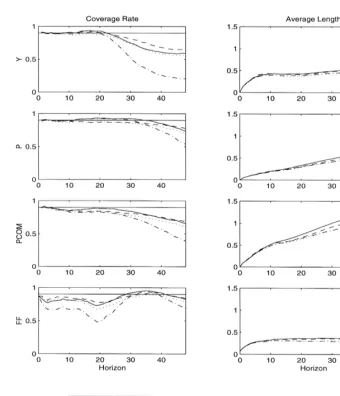
Figs. 1–3 show the coverage rates and the average length for each of the four alternative confidence intervals for selected responses to a monetary policy shock. Ideally, all intervals should have coverage rates of 90 percent. This target rate has been superimposed on the coverage plots as a horizontal line at 0.9. In practice, no interval has close to nominal coverage for all responses and horizons, but there are important differences across methods.
3.1. Relative performance of methods
Regardless of DGP, the differences in coverage accuracy between the bias-corrected bootstrap method (BC-BOOT) and the Monte Carlo integration method (MCI) are comparatively minor. Neither interval dominates the other. This is an interesting finding because the Bayesian Monte Carlo integration method was not designed to have good coverage accuracy, yet for these three DGPs it performs about as well as the bias-corrected bootstrap method. The small differences in coverage accuracy between the two methods are broadly consistent with simulation results in Kilian (1998a,b) for much simpler processes. The intuitive explanation for the similarity is that the Sims and Zha method–unlike the RATS method–allows for asymmetries in the impulse response distribution, thus eliminating one of the major differences to the bootstrap approach. Moreover, by directly drawing from a symmetric Gaussian posterior distribution for the VAR slope parameters, it effectively avoids the small-sample bias of the bootstrap least-squares estimator, an operation akin to bias-correcting the bootstrap slope parameter estimates as in Kilian (1998a).
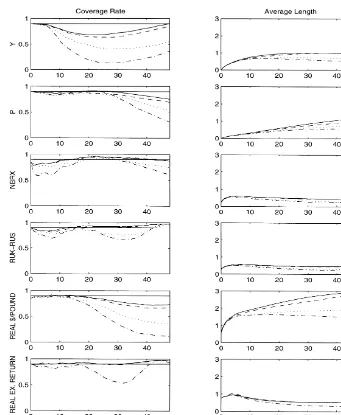
Both the bootstrap and the Monte Carlo integration interval tend to be more accurate than the asymptotic method (ASY), especially for the Eichenbaum–Evans VAR in Fig. 2. In some cases, the coverage accuracy of the asymptotic interval is substantially lower (by as much as 0.4), but in many cases it is only slightly lower than that of the BC-BOOT and MCI intervals. The accuracy of the conventional bootstrap interval (BOOT) used by Runkle (1987) tends to be poor in most cases. This method is less accurate than even the asymptotic delta method interval. In one case, the coverage of the nominal 90 percent BOOT interval is as low as 0.12. This tendency is consistent with the evidence for VAR(1) processes. It can be traced to the fact that this bootstrap method tends to propagate and amplify the small-sample bias of the least-squares estimator (see Kilian, 1998a).
Fig. 1. Coverage accuracy and average length of impulse response confidence intervals. Bernanke–Gertler model (VAR(12) for monthly data).
Fig. 2. Coverage accuracy and average length of impulse response confidence intervals. Eichenbaum–Evans Model (VAR(6) for monthly data).
3.2. Performance in absolute terms
Fig. 3. Coverage accuracy and average length of impulse response confidence intervals. Christiano–Eichenbaum–Evans Model (VAR(4) for quarterly data).
One of the more important findings of this study is that, in general, there is a tendency for the coverage accuracy of confidence intervals in monthly models to deteriorate substantially after about 20 months. This decline in accuracy raises questions about the interpretation of confidence intervals at longer horizons. For the quarterly model, the horizon is limited to 16 quarters and no similar systematic deterioration of the coverage accuracy occurs.
and 0.73 (0.73). In Fig. 2, the corresponding results are 0.68 (0.68), 0.86 (0.75), 0.78 (0.78), 0.84 (0.84), 0.87 (0.72), 0.89 (0.89). Similar results hold for the MCI interval. For the quarterly model in Fig. 3, the lowest coverage rates of the BC-BOOT interval for the first 16 periods are 0.53, 0.82, 0.90, 0.65, 0.82, 0.88, and 0.87.
However, as these numbers show, even at shorter horizons there are some important differences in accuracy across impulse response functions. In particular, intervals for the response of output to a monetary tightening tend to lack coverage for two of the three DGPs. The lowest coverage rates for the BC-BOOT interval are 0.68 in Fig. 2 and 0.53 in Fig. 3. Further investigation reveals that it is not uncommon for the true output response to be larger in magnitude than indicated by the confidence interval. This fact suggests that applied users will tend to underestimate the effectiveness of monetary policy, even after accounting for sampling uncertainty.
We also find that intervals for the response of policy variables to policy shocks tend to be less reliable than other responses (with the exception of output). This is true for the FF responses in Figs. 1 and 3 (with coverage rates as low as 0.73 and 0.65, respectively, for the BC-BOOT interval) and for the NBRX response in Fig. 2 (with a low point of 0.78). If we discard not only the output responses, but the responses of the policy variables as well, and focus on the first 20 months or 16 quarters, respectively, the remaining coverage rates of the BC-BOOT interval range from 0.85 to 0.89 in Fig. 1, from 0.84 to 0.89 in Fig. 2 and from 0.82 to 0.90 in Fig. 3.
4. Conclusions
We examined the coverage accuracy and average length of pointwise confidence intervals for the estimated responses of major economic aggregates to monetary policy shocks. Our study was the first study involving impulse responses to policy shocks in large dimensional VAR models. We argued that previous evidence on the accuracy of impulse response intervals was not directly relevant for most applied work.
Our main finding was that the accuracy of confidence intervals for large-dimensional VARs is questionable. One practical recommendation is to discount interval estimates for higher horizons. In our Monte Carlo study, we observed a substantial deterioration of the accuracy of confidence intervals at higher horizons. For monthly data in particular, the coverage accuracy of the confidence intervals tended to decline substantially after about 20 months. These results suggest caution in interpreting such interval estimates in applied work. In contrast, the coverage rates of intervals in the quarterly system we analyzed showed no similar systematic deterioration within the first 16 quarters. However, even at shorter horizons the intervals for some responses tended to be inaccurate. This was true especially for responses of policy variables to policy shocks and for the output responses. In the case of the output responses, we found that there was a systematic bias toward underestimating the effect of monetary policy shocks on the level of output. We conclude that intervals for such responses are of limited practical value.
We also addressed the question of which impulse response confidence intervals are likely to be most accurate in large-dimensional VAR models. We found important differences in accuracy across different types of confidence intervals. Based on the three DGPs we investigated, we strongly caution applied users against the use of the bootstrap interval used by Runkle (1987). Similarly, the
¨
little to choose between the latter two intervals.
How general are these results? One limitation of this study was the comparatively small number of DGPs. The number of models to be analyzed was constrained by the computational costs of Monte Carlo studies of simulation methods such as the bias-corrected bootstrap method. In some cases, more than a year of computer time was required for the analysis of one DGP and method. As computing power improves, experiments with additional DGPs would be useful. However, notwithstanding the small number of models analyzed, it is clear from this study that even the best current practice of constructing confidence intervals for impulse responses cannot be considered reliable for large-dimensional VAR models. This insight is practically important and was not readily apparent from existing studies of the reliability of VAR impulse responses based on smaller models.
A second qualification is that throughout this study we focused on unrestricted VAR models specified in levels. Our examples closely followed the current practice as established by leading practicioners in the field. The level specification is common in applied work, but it raises questions about the asymptotic validity of the procedures for constructing confidence intervals. It is possible that roots near unity rather than the dimension of the VAR system are the primary cause of the poor coverage accuracy of the intervals for some responses, although we note that for other responses the intervals were rather accurate notwithstanding the high degree of persistence. Thus, it is possible that interval estimates of impulse responses will be more accurate in VAR models in differences or in vector error correction form. The investigation of this conjecture is left for future research.
Finally, there are some other important caveats. Throughout this paper we maintained some perhaps unrealistic assumptions. In particular, we assumed that the model is correctly specified, that the lag order is finite and known, and that the innovations are normally distributed. The importance of these assumptions and the consequences of their violation have been documented in Braun and Mittnik (1993) and Kilian (1998b, 2000). We also abstracted from the inclusion of deterministic time trends which may have important adverse effects on the coverage accuracy of impulse response intervals (see Kilian, 1998a; Wright, 1998). Thus, impulse response intervals for large-dimensional VAR models may be even less reliable in practice than our study would suggest. Nevertheless, our results provide a useful benchmark for the reliability of VAR impulse response intervals and may serve as the starting point for further analysis.
Data Appendix
Bernanke –Gertler model
Data Period: Monthly data for 1965.1–1993.12.
Description: Industrial production (Y), consumer prices excluding shelter (P), commodity price index (PCOM), Federal Funds rate (FF). All variables are in logs except the interest rate. Data Source: CitiBase.
Eichenbaum –Evans model
Description: U.S. industrial production (Y), U.S. consumer prices (P), ratio of nonborrowed to total reserves (NBRX), difference between the U.S. and U.K. short-term interest rates (RUK-RUS), and the real exchange rate (REAL $ / £). All variables are in logarithms except the interest rates.
Data Source: CitiBase and IFS.
Christiano –Eichenbaum –Evans model
Data Period: Quarterly data for 1960.I–1992.IV.
Description: Real gross domestic product (Y), GDP price deflator (P), index of sensitive commodity prices (PCOM), Federal Funds rate (FF), nonborrowed reserves (NBRD), total reserves (TR), M1 (M1). All variables are in logarithms except the interest rates.
Data Source: Courtesy of the authors.
References
Bernanke, B.S., Gertler, M., 1995. Inside the black box: the credit channel of monetary policy transmission. Journal of Economic Perspectives 9, 27–48.
Berkowitz, J., Kilian, L., 2000. Recent developments in bootstrapping time series. Econometric Reviews 19, 1–49. Braun, P.A., Mittnik, S., 1993. Misspecifications in vector autoregressions and their effects on impulse responses and
variance decompositions. Journal of Econometrics 59, 319–341.
Christiano, L., Eichenbaum, M., Evans, C.L., 1996. The effects of monetary policy shocks: evidence from the flow of funds. Review of Economics and Statistics 78, 16–34.
Davison, A.C., Hinkley, D.V., 1997. Bootstrap Methods and their Applications. Cambridge University Press, Cambridge, U.K.
Efron, B., Tibshirani, R.J., 1993. An Introduction to the Bootstrap. Chapman and Hall, New York.
Eichenbaum, M., Evans, C.L., 1995. Some empirical evidence on the effects of shocks to monetary policy on exchange rates. Quarterly Journal of Economics 110, 975–1009.
Fachin, S., Bravetti, L., 1996. Asymptotic normal and bootstrap inference in structural VAR analysis. Journal of Forecasting 15, 329–341.
¨
Griffiths, W., Lutkepohl, H., 1993. Confidence Intervals for Impulse Responses from VAR Models: A Comparison of ¨
¨ ¨
Asymptotic Theory and Simulation Approaches. Institut fur Statistik und Okonometrie, Humboldt-Universitat zu Berlin. Kilian, L., 1998a. Small-sample confidence intervals for impulse response functions. Review of Economics and Statistics 80,
218–230.
Kilian, L., 1998b. Confidence intervals for impulse responses under departures from normality. Econometric Reviews 17, 1–29.
Kilian, L., 1999. Finite-sample properties of percentile and percentile-t bootstrap confidence intervals for impulse responses. Review of Economics and Statistics 81, 652–660.
Kilian, L., 2000, Impulse response analysis in vector autoregressions with unknown lag order. Forthcoming: Journal of Forecasting.
¨
Lutkepohl, H., 1990. Asymptotic distributions of impulse response functions and forecast error variance decompositions of vector autoregressive models. Review of Economics and Statistics 72, 116–125.
Runkle, D.E., 1987. Vector autoregressions and reality. Journal of Business and Economic Statistics 5, 437–442. Sims, C.A., Zha, T., 1999. Error bands for impulse responses. Econometrica 67, 1113–1155.
Wright, J.H., 1996. Confidence Intervals for Impulse Responses with Near Unit Roots. Department of Economics, University of Virginia.