Economics Letters 67 (2000) 49–52
www.elsevier.com / locate / econbase
A further interpretation of Friedman’s hypothesis: the
cointegration of component CPI indexes
*
Gary L. Shoesmith (Associate Professor of Economics)
Babcock Graduate School of Management, Wake Forest University, Center for Economic Studies, P.O. Box 7659,
Winston-Salem, NC 27109, USA
Received 8 February 1999; accepted 23 September 1999
Abstract
This study extends the Friedman (1977) [Friedman, M., 1977. Nobel lecture: inflation and unemployment, Journal of Economic Dynamics and Control 12, 231–254] hypothesis regarding inflation means and variances to show that high inflation is also associated with greater divergence of component inflation indexes over time. This finding follows Friedman’s reasoning involving inflation uncertainty and time-lagged adjustments.
2000 Elsevier Science S.A. All rights reserved.
Keywords: Inflation variability; Cointegration
JEL classification: E30; E31
1. Introduction
The Friedman (1977, p. 465) statement that, ‘‘high inflation is not likely to be steady . . . rather, the higher the rate, the more variable it is likely to be,’’ has resulted in numerous studies investigating the relationship between the mean and variance of inflation. Variance has typically been measured in terms of the variability of inflation rates across individual components within an overall inflation index. Soon after the Friedman (1977) article, papers by Foster (1978), Fisher (1981) and Taylor (1981) offered evidence of a positive relationship between the mean and variance of inflation. While some studies have raised questions regarding the relationship (e.g., Engle, 1983), most empirical evidence supports Friedman’s hypothesis.
Recent work on this issue continues to rely on inflation means and variances. Caporale and McKiernan (1997) use a GARCH model with the lagged level of inflation as a regressor in the
*Corresponding author. Tel.: 11-336-758-5053; fax: 11-336-758-4514.
E-mail address: [email protected] (G.L. Shoesmith)
50 G.L. Shoesmith / Economics Letters 67 (2000) 49 –52
variance equation and again find a positive relationship between the level of inflation and inflation variability. Debelle and Lamont (1997) show a positive correlation between inflation and relative price variability (RPV) based on data from a cross-section of U.S. cities. Cities with above average inflation also have higher than average RPV. Debelle and Lamont (1997) also provide a detailed account of the extensive work done in this area, dating back to Mills (1927).
While the Friedman (1977, p. 466) discussion of government policy, inflation, and uncertainty clearly suggests analyses involving inflation means and variances, his reasoning also points to a second form of inflation dispersion associated with higher inflation; namely, the divergence of disaggregate inflation indexes over time:
‘‘A burst of inflation produces strong pressure to counter it. Policy goes from one direction to the other, encouraging wide variation in the actual and anticipated rate of inflation. And, of course, in such an environment, no one has single-valued anticipations. Everyone recognizes that there is great uncertainty about what actual inflation will be over any specific future interval.’’
Friedman (1977) goes on to argue that increased variability in inflation makes indexing more advantageous, but also states that, ‘‘indexing is, even at best, an imperfect substitute for stability of the inflation rate. Price indexes are imperfect; they are available only with a lag and generally are applied to contract terms only with further lags.’’ Thus, Friedman’s reasoning is as much about the uncertain dynamics of inflation over time as it is about inflation uncertainty in any single period. Specifically, increased uncertainty regarding inflation ‘over any specific future interval’ is as likely to lead to divergence among disaggregate inflation measures over time as it is to result in increased variance among them at any point in time.
If component prices do diverge more during periods of high inflation, then Friedman’s argument regarding the loss of economic efficiency is intensified by this added dimension of uncertainty. That is, not only are disaggregate measures of inflation more unpredictable about the mean at various points in time, but even more so as they drift apart from one another over time. Johansen (1988) test for cointegration is used in the next section to evaluate this second form of dispersion among disaggregate component measures of inflation.
2. The data and cointegration results
To complement previous work, the disaggregate measures of inflation used here follow those by Debelle and Lamont (1997) and other researchers. Ten component U.S. consumer price index (CPI) series are tested for cointegration over the two 10-year time intervals 1978–87 and 1988–97. The source for all monthly CPI data is the Bureau of Labor Statistics’ Selective Data Access on the Internet. The final year of 1997 is chosen as the last year prior to the BLS’s 1998 CPI revision. The CPI (all urban consumers) inflation rate averaged 6.56 percent per year during the 1978–87 period and roughly half that at 3.52 percent during 1988–97.
G.L. Shoesmith / Economics Letters 67 (2000) 49 –52 51
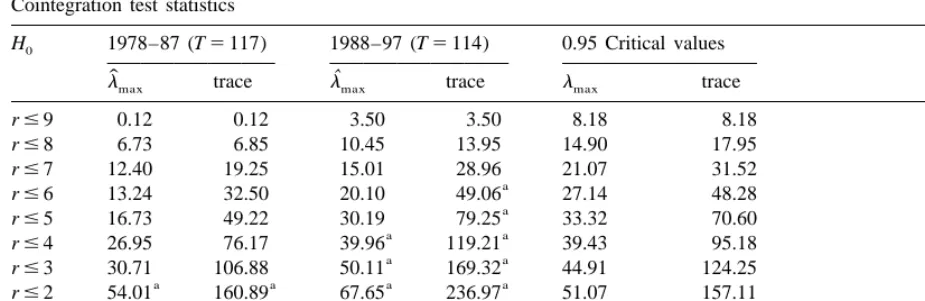
Table 1
Cointegration test statistics
H 1978–87 (T5117) 1988–97 (T5114) 0.95 Critical values
0
ˆ ˆ
l trace l trace l trace
max max max
r#4 26.95 76.17 39.96 119.21 39.43 95.18
a a
r#3 30.71 106.88 50.11 169.32 44.91 124.25
a a a a
r#2 54.01 160.89 67.65 236.97 51.07 157.11
a a a a
r#1 64.28 225.16 89.93 325.90 57.00 192.84
a a a a
r50 84.48 309.65 121.93 447.83 62.42 232.49
a
Eigenvalues and eigenvectors (cointegrating vectors) are available from the author. Critical values are from Osterwald-Lenum (1992).
( p) for each system of ten equations is determined using a likelihood ratio procedure based on a Chi-squared statistic for the unconstrained vector autoregression model in levels. This procedure involves successively testing shorter lag lengths as restrictions against longer lag lengths where the lag order is set uniformly across the ten equations. For the 1978–87 period, p53. For 1988–97, p56. Johansen’s procedure is then applied to the two systems.
Table 1 shows the lmax and trace test statistics for the two 10-year periods. For 1978–87, both the l and trace tests successively reject the null hypotheses of r50, r#1, and r#2 at the 0.05 level,
max
indicating r53 cointegrating vectors. That implies seven common price trends among the ten component series during 1978–87. In contrast, for 1988–97, thel test indicates r55 cointegrating
max
vectors, while the trace test indicates r57 cointegrating vectors. This implies a maximum of five common trends during 1988–97. Thus, there is noticeably more integration (less dispersion) among the ten component CPIs during 1988–97 than 1978–87.
3. Conclusion.
A closer reading of the Friedman (1977) argument regarding uncertainty and time-lagged adjustments associated with high inflation suggests that component inflation measures are not only more variable at each point in time, but also more dispersed over time. This study offers evidence that component price indexes do drift apart considerably more during periods of relatively high inflation, implying more uncertainty for businesses and consumers than previous studies indicate.
References
52 G.L. Shoesmith / Economics Letters 67 (2000) 49 –52
Debelle, G., Lamont, O., 1997. Relative price variability and inflation: Evidence from US cities. Journal of Political Economy 105, 132–152.
Dickey, D.A., Fuller, W.A., 1981. Likelihood ratio statistics for autoregressive time series with a unit root. Econometrica 49, 1057–1072.
Engle, R.F., 1983. Estimates of the variance of US inflation based upon the ARCH model. Journal of Money, Credit and Banking 15, 286–301.
Fisher, S., 1981. Relative shocks, relative price variability, and inflation. Brookings Papers Economic Activity 2, 381–431. Foster, E., 1978. The variability of inflation. Review of Economics and Statistics 60, 346–350.
Friedman, M., 1977. Nobel lecture: Inflation and unemployment. Journal of Political Economy 85, 451–472.
Johansen, S., 1988. Statistical analysis of cointegration vectors. Journal of Economic Dynamics and Control 12, 231–254. Mills, F.C., 1927. The Behavior of Prices, NBER, New York.
Osterwald-Lenum, M., 1992. A note with quantiles of the asymptotic distribution of the maximum likelihood cointegration rank test statistics. Oxford Bulletin of Economics and Statistics 54, 461–472.