ANALYSIS
Measuring the total economic value of restoring ecosystem
services in an impaired river basin: results from a contingent
valuation survey
John Loomis
a,*, Paula Kent
b, Liz Strange
c, Kurt Fausch
c, Alan Covich
c aDepartment of Agricultural and Resource Economics,Colorado State Uni6ersity,Fort Collins,CO80523-1172,USAbNorthwest Economics Associates,Vancou
6er,WA,USA cDepartment of Fish and Wildlife Biology,Colorado State Uni
6ersity,Fort Collins,CO80523-1172,USA Received 2 April 1999; received in revised form 9 August 1999; accepted 23 September 1999
Abstract
Five ecosystem services that could be restored along a 45-mile section of the Platte river were described to respondents using a building block approach developed by an interdisciplinary team. These ecosystem services were dilution of wastewater, natural purification of water, erosion control, habitat for fish and wildlife, and recreation. Households were asked a dichotomous choice willingness to pay question regarding purchasing the increase in ecosystem services through a higher water bill. Results from nearly 100 in-person interviews indicate that households would pay an average of $21 per month or $252 annually for the additional ecosystem services. Generalizing this to the households living along the river yields a value of $19 million to $70 million depending on whether those refusing to be interviewed have a zero value or not. Even the lower bound benefit estimates exceed the high estimate of water leasing costs ($1.13 million) and conservation reserve program farmland easements costs ($12.3 million) necessary to produce the increase in ecosystem services. © 2000 Elsevier Science B.V. All rights reserved.
Keywords:Ecosystem services; Willingness to pay; Total economic value; Contingent valuation method
www.elsevier.com/locate/ecolecon
1. Importance and controversy of ecosystem valuation
Valuation of ecosystem services is controversial because of the potential importance such values may have in influencing public opinion and policy decisions. As noted by Costanza et al. (1998), p. * Corresponding author. Tel.: +1-970-491-2485; fax: +
1-970-491-2067.
E-mail address: [email protected] (J. Loomis)
68; ‘to say that we should not do valuation of ecosystems is to deny the reality that we already do, always have and cannot avoid doing so in the future’. Failure to quantify ecosystem values in commensurate terms with opportunity costs often results in an implicit value of zero being placed on ecosystem services. In most cases, ecosystem ser-vices have values larger than zero (Dailey, 1997). Attempts at valuing ecosystem services go back several decades. Notable early examples include energy-based approaches of Costanza (1981) and
Odum (1983). Ecological Economicsran a special
issue on the topic in 1995. A recent effort by
Costanza et al. (1997) published in Nature to
estimate the value of the world’s ecosystem ser-vices has focused a great deal of attention on this
topic (see the 1998 special issue of Ecological
Economics on ‘The value of ecosystem services’ for some of this debate). This ambitious effort by Costanza et al. (1997) was partly a challenge ‘..that ecosystem services are ‘big potatoes’ and we had better get busy and pay more attention to
them from many different conceptual and
methodological perspectives at once’ (Costanza et al., 1998, p. 69).
There were several critiques in this recent
spe-cial issue ofEcological Economics of the analysis
by Costanza et al. (1997). One commentator was concerned that adding up estimates from separate studies on the value of various individual ecosys-tem services might result in some double counting of benefits (El Serafy, 1998, p. 25). However, there can be potentially more than double count-ing when addcount-ing up independently derived esti-mates of willingness to pay, as substitution effects and budget constraints are often incompletely ac-counted for, leading to over-valuation even in absence of double counting (Hoehn and Randall, 1989). In addition, Toman (1998) p. 58, notes that for ecosystem valuations to provide more useful information to decision makers faced with trade-offs, that ‘one needs a specified baseline, a spe-cified measure of changes…’
Our approach attempts to rise to the challenge posed by Costanza et al. (1998) and these com-mentators by addressing all three of the above suggestions. First by eliciting a comprehensive value from the public for a set of ecosystem
services and thereby reducing the possibility for double counting as well as avoiding the indepen-dent valuation and summation problem noted by Hoehn and Randall (1989). Further we provide respondents a specified baseline and specified measure of change as suggested by Toman (1998). This is done by adapting the contingent valuation method (Mitchell and Carson, 1989) to the valua-tion of ecosystem services. Such comprehensive valuation critically depends on communicating the nature of ecosystem services to the respon-dent. This paper reports on an interdisciplinary effort to develop visual aids and text that commu-nicates the ecosystem services of a Great Plains river and the results of nearly 100 in-person inter-views with those visual aids. As is obvious, this refinement in ecosystem valuation is far less ambi-tious than Costanza’s et al. (1997) effort in both the number of services that were relevant to value in this ecosystem and the geographic scope of the analysis. We believe future efforts may be able to apply our approach to larger ecosystems with a broader range of the ecosystem services to be valued.
2. Specific ecosystem services of a Plains river
Rivers can provide many services to humans, including water supply for municipal, industrial and agricultural users, fish habitat and recreation. With excess demand by historic uses resulting in an over appropriated river basin, these uses are competitive. A dynamic society requires monitor-ing and adjustmonitor-ing the mix of these ecosystem services as society’s priorities change (Bromley, 1997) to insure that the highest valued mix of services is produced. Since uses like fish habitat and recreation are not priced, this presents a challenge to water managers.
Much of the river’s remaining flows are irrigation return flows, with additional inflows from the sewage treatment plant in Denver. Due in part to the lack of riparian vegetation to filter irrigation return flows and feedlot run-off, the South Platte ranks first in contamination by ammonia and nitrates of 20 major rivers in the US and it ranks second among the 20 major rivers in contamina-tion by phosphorous (Strange et al., 1999). In addition to polluted water, erosion of the stream-banks, irrigation return flows, and reduction of instream water by agriculture use has greatly di-minished the natural ecosystem of the South Platte river. As a result of these changes in flow regime, habitat, and water quality, six of the remaining native fish species are at risk and are being considered for the endangered species list. Due to the unnatural hydrograph resulting from waterflows timed for irrigation, non-native Rus-sian olive trees are encroaching upon and
replac-ing native cottonwoods. Birds prefer the
cottonwood for nesting and the higher abundance of insects. As the number of cottonwoods de-crease, bird species are expected to decrease by a third of their present number.
In essence, one ecosystem service from the wa-tershed, irrigation water supply, along with ‘edge to edge’ agriculture has greatly diminished other ecosystem services such as:
natural purification of water;
erosion control;
habitat for fish and wildlife;
dilution of wastewater;
recreation use.
Of course there would be opportunity costs to irrigated agriculture from reducing diversions and replacing cropping and grazing at the river’s edge with native vegetation. The question that must often be answered is what are these non-marketed ecosystems worth? It is to answering that question that we now turn.
3. What are the economic values of ecosystem services?
Ecosystem services provide many benefits to people. Dilution of wastewater, as well as erosion
control and water purification effects from ripar-ian vegetation and wetlands improves water
qual-ity. Increased water quality reduces water
treatment costs to downstream cities (Moore and McCarl, 1987), increases the aesthetics of water for visitors and supports native fish and wildlife that different people like to view or harvest or simply know exist. Since all of these uses of clean water benefit people, and are scarce, these services have an economic value.
These ecosystem services have characteristics of ‘public goods’. Specifically, it is difficult to
ex-clude downstream users from receiving the
benefits of improved water quality and many of the benefits are non-rival in nature. Many individ-uals can view the same wildlife or enjoy knowing they exist without precluding others from doing the same thing. Given these public good charac-teristics, it is difficult for the private sector to market or sell these ecosystem services.
While these ecosystem services are often with-out prices, they do contribute utility to individuals and therefore have value. This value is monetized as the individual’s net willingness to pay (WTP) or consumer surplus. It is represented by the area under the individual’s demand curve but above any cost to the user of the ecosystem service.
4. Techniques to measure economic value of ecosystem services
There are several techniques that can be used to value the benefits of improved water quality or stream restoration. If restoration of water quality or recreation occurs in an urban setting where there are residences nearby the river, the hedonic property method may be applied. The hedonic property method isolates the property value dif-ferential paid by a household for having a home along a river with improved water quality as compared to degraded water quality.
When river restoration and water quality im-provements result in both on-site recreation and increases in populations of rare or endangered fish, there will often be an existence and bequest value (Krutilla, 1967; Loomis and White, 1996). By ‘existence value’ we mean the amount an individual would pay to know that a particular native fish exists in its natural habitat. By ‘bequest value’ we mean the amount an individual would pay for preservation today, so that future genera-tions will have native fish in their natural habitat. Collectively, existence and bequest values are sometimes called non-use or passive use values. While these benefits are often quite small per person, the non-rival nature of these public good benefits results in simultaneous enjoyment by mil-lions of people. Therefore, the total social benefits can be quite large.
The only methods currently capable of measur-ing these passive use values of ecosystem services are conjoint, choice experiments and the contin-gent valuation method (CVM). CVM uses a ques-tionnaire or interview to create a realistic but hypothetical market or referendum, which allows respondents to indicate their WTP (Mitchell and Carson, 1989). The first part of the survey con-veys the description of the resource under current conditions, as well as proposed conditions if the respondent pays. Then respondents are told the means by which they would pay for these pro-posed changes, e.g. in a higher water bill or taxes. Finally, the respondents are asked whether they would pay a certain dollar amount, which varies randomly across respondents.
The concern with this method is the reliability and validity of the responses. Would these indi-viduals really pay the amount stated in the inter-view? This question has been subjected to a great deal of empirical testing. A literature analysis by Carson et al. (1996), finds that the majority of CVM WTP estimates for use values pass the test of the validity involving comparisons of values derived from actual behavior methods such as travel cost recreation demand model. All the pub-lished studies to date have shown CVM-derived responses of WTP for both use and passive use
values to be reliable in test – retest studies
(Loomis, 1989; Carson et al., 1997). CVM has
been recommended by federal agencies for per-forming benefit – cost analysis (US water resources Council, 1983) and valuing natural resource dam-ages (Interior, 1986, 1994). The CVM has been upheld by a federal court (Appeals, 1989) and was recommended as being reliable enough to provide initial estimates of passive use values by a blue ribbon panel co-chaired by two Nobel laureate economists (Arrow et al., 1993). Nonetheless, CVM-derived estimates of public good values such as existence and bequest values may over-state actual cash WTP by a factor of two – ten in some cases (Brown et al., 1996). Some CVM experiments have shown overstatement of WTP even with deliverable goods (Cummings et al., 1997; Loomis et al., 1997). Recent efforts at cali-brating stated WTP values show promise at pro-ducing equality of stated and actual cash WTP (Champ et al., 1997).
The only previous application of CVM to the South Platte river involved an in-person survey of 200 residents of Denver and Fort Collins, CO, in 1976 by Greenley et al. (1982). Individuals were asked to pay a higher water bill to reduce heavy metal pollution in the South Platte river. The average household would pay $4.50 per month in 1976 dollars or $12.50 in 1996 dollars. About half the value was recreation use, with the other half being existence and bequest values.
5. Survey design
Obtaining accurate benefit estimates using CVM requires detailed descriptions of the re-source being valued. This is evident from the name of the method, which produces values, con-tingent upon, the description of the good and method of payment. Therefore a great deal of effort was expended to carefully define and clearly display the current and proposed levels of ecosys-tem services to respondents.
service on water quality and fish/wildlife concerns, respectively. Study team members toured the site with a US fish and wildlife service biologist. The ecologists have summarized this background anal-ysis of the South Platte in Strange et al. (1999). The study section of the South Platte river was also selected based on an actual policy proposal (e.g. the centennial land trust). This rural stretch of river extends from Kersey to Fort Morgan, CO. The first step was definition of ecosystem services that could be provided by the South Platte river: dilution of wastewater, natural purifi-cation of water, erosion control, habitat for fish and wildlife and recreation.
Once the key ecosystem services were identified, we developed management actions necessary to increase the level of ecosystem services. These management actions included: a ten-mile wide conservation easement along 45 miles of the South Platte river, downstream of Greeley. This area is 300 000 acres in size. Next, restoring native vegetation along the river in the form of buffer strips and eliminating cropland and cattle grazing in the buffer strip area. Livestock grazing would be allowed in the remainder of the conservation easement. Finally, water diversions to agriculture were reduced from their current 75 to 50% of the total flow with the corresponding increase in in-stream flow from 17 to 42%. In terms of acre feet of water, this is an annual gain of 37 820 acre feet of water for instream flow, wastewater dilution, and aquatic habitat. The payment mechanism was an increase in household water bill.
The interdisciplinary team worked jointly to develop drawings and narrative that conveyed the concept of increased ecosystem services. An initial set of drawings illustrating a natural level of ecosystem services as compared to the current condition of degraded ecosystem service was prepared.
6. Focus groups
To test the validity of these drawings and nar-rative to convey the desired concepts, we pre-sented them at three focus groups in the study area. The individuals attending the focus groups
were asked to write down their description of what each diagram indicated. We asked them to point out any elements that were not clear. After each focus group, we made modifications to the diagrams and the narrative wording. We found that including a summary diagram that was a composite of all of the ecosystem services
pre-sented individually helped to improve
comprehension.
7. Pre-testing of in-person surveys
After further revisions following the focus groups, an entire survey script and revised set of diagrams were prepared and tested. We pre-tested the entire script and drawings on four individuals, two of whom served as interviewer training. Further changes were made and we be-lieve we have a fairly effective script and diagrams to elicit household willingness to pay for increas-ing ecosystem services in the South Platte river.
8. Synopsis of ecosystem services being valued in survey
Respondents were first handed a card that listed the four key ecosystem services that a re-stored plains river such as the Platte river could provide. These were listed and described as:
1. Dilution of wastewater: adequate river flows are important for diluting fertilizer and pesti-cides that run off from farm fields, wastewater discharges from treatment plants and pollu-tants in urban stormwater. This dilution in-sures the river is not toxic to fish and is safe for water-based recreation such as boating. They were then handed a color drawing that illustrated the lack of dilution along a hypo-thetical section of the Platte river.
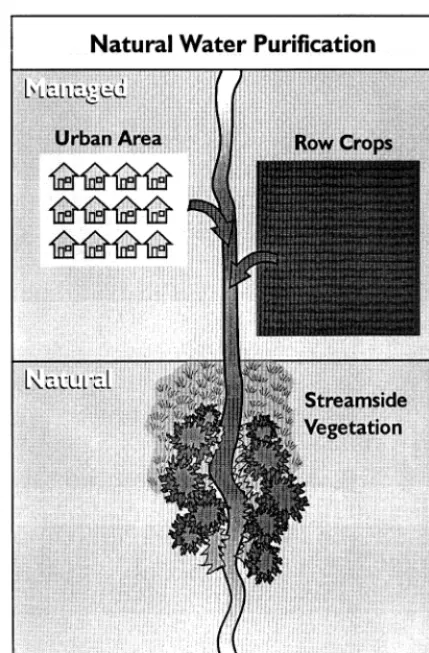
plants and broken down by plants and bacte-ria to less harmful substances. Pollutants at-tached to suspended soil particles are filtered out by grasses and other plants and deposited in floodplains. This process helps improve wa-ter quality.Respondants were then handed a color drawing contrasting the current condi-tion in the upper half of the diagram to the natural purification process in the lower part of the diagram. This diagram is illustrated in black and white in Fig. 1.
3. Erosion control: streamside vegetation also plays a role in the control of erosion. Plants and their roots hold stream banks and filter water. The results in clear, clean water re-quired by fish (point to blue water and fish on the left diagram; not shown here). In the
ab-sence of vegetation, rain and melting snow erodes the stream banks and rainfall washes soil from fields directly into river. This eroded soil fills the river bottom with mud. The result is muddy water and shallow rivers that do not provide healthy habitat for fish (point to brown water on right hand side diagram; not shown here). As noted in the above text, a color diagram contrasting presence and ab-sence of the erosion control service was pre-sented to the respondent.
4. Habitat for fish and wildlife: on the left side of the diagram (not shown) you can see the vari-ety of vegetation along the river provides habi-tat for a wide range of wildlife including woodpeckers, ducks, shorebirds and deer. Trees and shrubs in floodplains offer shelter and areas for nesting and roosting of many bird species. In addition the vegetation shades the stream keeping the water cool for fish and reducing algae growth which is detrimental to fish. Streamside corridors also are important for animal migration.
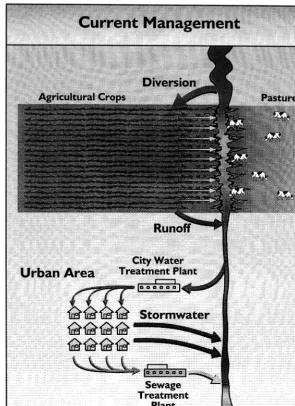
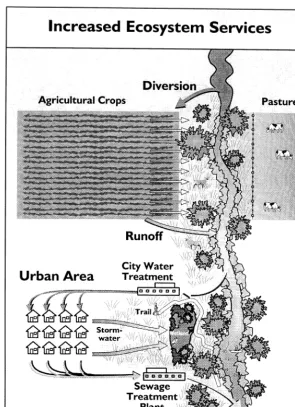
After the current state and restored level of each individual ecosystem service was described and illustrated, we then showed composite figures for current management (shown in Fig. 2) and increased ecosystem service (shown in Fig. 3). This helped to bring together all of the individual ecosystem services into what the overall ecosystem would look and function like under the current condition and restoration. Note, all of the figures used in the interviews were in color to better illustrate the change in water quality.
9. Mechanisms for restoring ecosystem services
Next we described the means by which ecosys-tem services could be restored from their current level.
1. Restoring vegetation buffer strips along
streams to increase ecosystem services such as erosion control, water quality, fish and wildlife
habitat along with limited recreation
opportunities.
Fig. 2. Diagram of current condition.
paring two pie charts shown to respondents. The top pie chart presented ‘current water use’ where 75% of water supply is now primarily for agriculture. Respondents were told that additional instream flows in the river can be obtained by:
2.1. purchasing water rights from agricultural users;
2.2. paying farmers to grow crops that use less water;
Fig. 3. Diagram of increased ecosystem services. 3. Changing land management: land
manage-ment actions necessary to restore ecosystem services were illustrated on a schematic map of the study area. Along 45 river miles of the South Platte river shown on the map, the
government would purchase conservation
easements on both sides of the river over a 10-year period from willing farmers (5 miles on either side for a total of 300 000 acres shown on the map). Respondents were told conservation easements keep the land in
plants; improve water quality and river habi-tat; help increase native fish populations so they will not go extinct; provide public access to restored natural areas for wildlife viewing including 5 miles of hiking trails.
10. Wording of WTP question
The specific wording of the WTP scenario read to respondents was:
‘‘The purchase of water and 300 000 acres of conservation easements along 45 miles of the South Platte river from willing farmers as well as restoring these areas in natural vegetation costs a great deal of money. To fund these actions a South Platte river restoration fund has been proposed. All citizens along the front range from Denver to Fort Collins would be asked to pay an increased water bill (or rent if water is included in your rent) to: (1) purchase water from farmers to increase water for fish and wildlife from 17% shown in the top pie chart to 42% as shown on the lower pie chart (point to); (2) to manage the South Platte river as shown in the increased ecosystem services (point to Fig. 3) along the 45 miles of the South Platte river shown on the map (point to area). The funds collected can only be used to restore natural vegetation along 45 miles of the South Platte river and purchase water from willing farmers to increase instream flow to improve habitat for six native fish so they are not in danger of extinction.
If the majority of households vote in favor of the South Platte river restoration fund the 45 miles of river would look like the Fig. 3 In-creased ecosystem services with inIn-creased water quality and fish and wildlife (point to increased ecosystem service; Fig. 3).
If a majority vote against, these 45 miles of the South Platte river would remain as they are today, as illustrated in current management (point to current management; Fig. 2).
If the South Platte river restoration fund was on the ballot in the next election and it
cost your household $ – each month in a higher water bill would you vote in favor or against?
– I would vote No’’ – I would vote Yes
The $ – was randomly filled in with one of 12 dollar amounts ($1, 2, 3, 5, 8, 10, 12, 20, 30, 40, 50, 100). These dollar amounts were chosen based on results from the focus group and pretest as well as the mean willingness to pay amounts from the past Platte river water quality CVM of Green-ley et al. (1982)
11. Statistical model of WTP
Given that individuals simply respond with a ‘yes’ or ‘no’ response to a single dollar amount, the probability they would pay a given dollar amount is statistically estimated using a qualita-tive choice model such as a logit model (Hane-mann, 1984).
The basic relationship is:
Probability (Yes)=1−{1+exp[B0−B1($X)]} −1
(1)
where B’s are co-efficients to be estimated using
either logit or probit statistical techniques and $X
is the dollar amount the household was asked to pay. At a minimum, the co-efficients include the bid amount the individual is asked to pay. Addi-tional co-efficients may include responses to atti-tude questions or the respondent’s demographic information such as age, education, membership in environmental organizations, etc.
From Eq. (1), Hanemann (1989) provides a formula to calculate the expected value of WTP if WTP must be greater than or equal to zero (as is logical for an improvement). The for-mula is:
Mean WTP=(1/B1)ln(1+e
Bo) (2)
where B1 is the co-efficient estimate on the bid
amount and Bois either the estimated constant (if
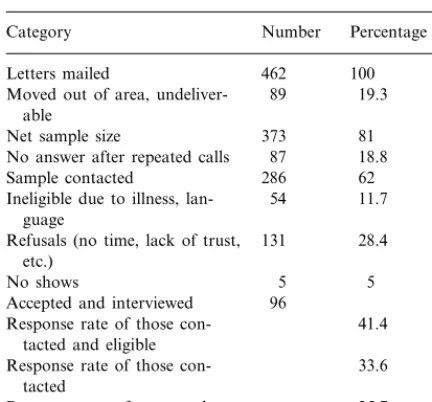
Table 1
Disposition of initial contacts and response rates Number Percentage Category
Letters mailed 462 100
89 19.3
Moved out of area, undeliver-able
373 81
Net sample size
18.8 87
No answer after repeated calls
Sample contacted 286 62
Ineligible due to illness, lan- 54 11.7 guage
131 28.4
Refusals (no time, lack of trust, etc.) Response rate of those
con-tacted and eligible
33.6 Response rate of those
con-tacted
25.7 Response rate of net sample
near the river and towns along the river (Fort Lupton, Fort Morgan, Greeley, Longmont, and Platteville). To increase the chances for a com-pleted interview, we reminded the participants with a phone call shortly before the interview. As a result, only five people or 5% failed to show for the interview. Two individuals conducted the
in-terviews in the respondent’s home.1 The
disposi-tion of these mailings is indicated in Table 1 along with three different estimates of the response rate. Depending on whether one calculates the response rate on just those that were contacted by phone or all residents, the response rate varies from a low of 25.7 to a high of 41%. The low response rate is due in part to losing some individuals at each of the many contacts made. While the low response rate does not influence the illustration of how we portrayed ecosystem services, it certainly has im-plications for generalizing the dollar value of
re-sults to the population. We address the
implications of this low response rate in the later section.
Table 2 presents the number and percent ‘yes’ responses at each bid amount. As can be seen it is a fairly, although not perfectly, well behaved dis-tribution. At the two lowest dollar amounts, 100% indicated they would pay. With the exception of three bid amounts, the percentage of ‘yes’ re-sponses decrease as the bid increases. It is not perfectly monotonic, but some of this is more than likely due to the small sample sizes in the individual cells.
independent variables times their respective
means. Confidence intervals around mean WTP were calculated using the variance-covariance ma-trix and a simulation approach of Park et al. (1991).
12. Pilot survey implementation
Sufficient funds were available to allow for a small sample using in-person interviews of about 100 individuals during the spring and summer of 1998. The sample frame were individuals living in towns nearby or along the portions of the South Platte river under study. From February to July 1998, we mailed 462 introductory letters to house-holds in the South Platte river basin in the follow-ing locations: two suburbs of northern Denver
1While two interviewers were used, we tested whether this resulted in different responses. Using a dummy variable in the logit regression of WTP we found no statistically significant effect.
Table 2
13. Statistical results
A full statistical model including all survey demographic and attitude variables was initially estimated. To conserve space, only the model with independent variables significant at the 0.05 level or better were retained. Demographic variables such as income, education or age were consis-tently insignificant and these were not included in the final model.
The final statistical model was:
[log(yes)/(1−yes)]
=Bo−B1(bid)−B2(unlimited water)
+B3(government purchase)
+B4 (environmentalist)
−B5 (average water bill)+B6 (urban) (3)
where ‘yes’ is the dependent variable and records if a person was or wasn’t willing to pay the amount asked during the interview. The number 1 records a yes vote, and 0 records a no vote.
Bid, specifies the increase in water bill the per-son was asked to pay.
Unlimited water, ‘do you agree or disagree with the statement; farmers should be allowed to use as much water as they are entitled to even if it temporarily dries up portions of streams?’ (agree, 1 and disagree, 0).
Government purchase: ‘do you agree or dis-agree with the statement; Government purchase of land along the South Platte river to increase fish and wildlife is something I would support?’ (agree, 1 and disagree, 0).
Environmentalist: are you a member of a con-servation or environmental organization? (yes, 1 and no, 0).
Average water bill: the average indoor use monthly water bill for each community.
Urban equals one if lives in urban/suburban
area, equals zero if live in rural/farm area.
14. Interpretation of the regression results
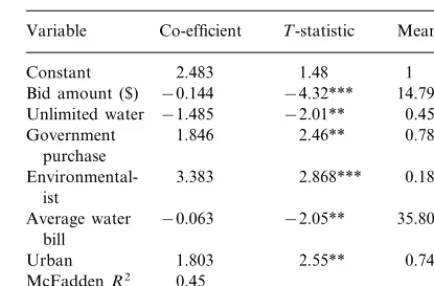
Table 3 presents the final statistical model.
Table 3
Logit regression model of probability would pay increased water bill
Variable Co-efficient T-statistic Mean 1
Unlimited water −1.485
0.78
** Significant at the 0.05 level. *** Significant at the 0.01 level.
14.1. Bid
The ‘bid’ is statistically significant at the 1% level. The negative sign denotes that the higher the dollar amount the respondent was asked to pay, the lower the probability that the respondent would vote for restoration of ecosystem services.
14.2. Unlimited water
This variable’s co-efficient is negative indicating those that agreed with the right of farmers to use their entire water right even if it dries up the stream, were less likely to agree to pay for restora-tion of ecosystem services. The variable is signifi-cant at the 5% level.
14.3. Go6ernment purchase
Respondents supporting government purchase of land along the Platte river were more likely to vote for a higher water bill to carry out such a program. This variable is significant at the 5% level.
14.4. En6ironmentalist
14.5. A6erage water bill
The negative sign suggests the higher the house-hold’s average water bill the more likely they were to vote against an increase in their water bill for this project. This variable was significant at the 5% level.
14.6. Urban
Suburban and urban residents were more likely to vote in favor of this program than rural or farm residents. This variable was significant at the 5% level.
15. Economic benefit estimates
Using the formula in Eq. (2), mean WTP was calculated at the mean of the other independent variables. The resulting mean monthly willingness to pay per household was $21 per month with a 95% confidence interval of $20.50 – 21.65, for the increase in ecosystem services on this 45-mile
stretch of the South Platte river.2
The resulting logit curve is well balanced and does not exhibit any ‘fat tail’ at the high bid amount. This is evidenced by median WTP being $20.72 nearly equal to the mean. This value is about 1.5 times the inflation adjusted value of what Greenley et al. (1982) estimated for the benefits of improving just water quality in the South Platte river in 1976. While there is always a lingering concern whether households would actually pay the mean WTP estimated from CVM responses, the respon-dents indicated they were quite certain of their WTP responses. In particular, we adopted the 10 point scale used by Champ et al. (1997) to assess validity of CVM WTP versus cash donations. The average score in our sample was 8.5 with a me-dian of 9. This is in the range that Champ et al.
(1997), found indicated criterion validity with cash donations. This score is also significantly above the level of certainty found in a mail survey of households toward the Mexican spotted owl (Loomis and Ekstrand, 1998). This higher level of certainty may be due to the extensive use of high quality visual aids and the in-person interviews. However this higher certainty and mean WTP may also be influenced upward by proximity of interviewed households to the river. That is, our sample design emphasized towns and suburbs closer to the river. Thus when the $21 monthly payment is converted to an annual payment the $252 is certainly a substantial sum. However, this is not out of line with other river or lake preserva-tion studies such as Desvousges et al. (1983) study of the Monogehela river ($196 annual WTP in 1997 dollars), Hanemann et al. (1991) study of WTP to increase salmon in the San Joaquin River ($415 using an annual payment vehicle) and Loomis (1987) for Mono Lake ecosystem preser-vation ($526 using a monthly payment vehicle).
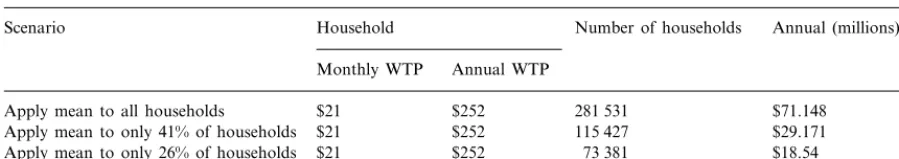
We make three expansions of these benefits to the population of regional households living along the South Platte river. The first treats our mean WTP as the best estimate of what the average household would pay. The second is a more con-servative estimate that accounts for the 59% of households that when contacted, declined to par-ticipate or respond to the survey. The proportion of households that refused to be interviewed re-garding the South Platte river are conservatively treated as having zero WTP. Finally, a lower bound is calculated that uses the most conserva-tive estimate of the response rate and assuming the remaining 74% of the population that we were unable to contact have a zero WTP. The counties of the cities interviewed were determined to be the pertinent areas to which the preservation benefits pertain. These counties include: Adams, Boulder, Weld and Morgan. For the upper bound estimate, mean willingness to pay per household was multi-plied by the number of households in this area of the South Platte river basin whereas the other estimates applied the mean only to the proportion of households that responded to the survey (Table 4).
Table 4
Annual benefits per household and along the river
Annual (millions) Household Number of households
Scenario
Monthly WTP Annual WTP
281 531 $252
$21
Apply mean to all households $71.148
$21 $252
Apply mean to only 41% of households 115 427 $29.171
$21 $18.54
Apply mean to only 26% of households $252 73 381
16. Comparison of benefits and costs of restoring ecosystem services
The annual WTP can be compared to the cost of the conservation easements and water rental necessary to deliver the ecosystem management practices in the study area. The US Department of Agriculture’s conservation reserve program (CRP) pays farmers to idle their farmland to reduce erosion and improve water quality. Rental rates in north-eastern Colorado average $41 per
acre (Page and Skold, 1996).3 Given the 300 000
acres of easements in our ecosystem management
scenario, $12.3 million would be required.4
Since even the most conservative estimate of the amount responding households would pay is $18.54 million, households could pay the CRP rental rate to farmers and have $6.24 million remaining annually to rent the 37 820 acre feet of water needed to increase instream flow, dilution of pollution and aquatic habitat as well as pay any one-time on-site restoration costs such as fencing and replanting native vegetation. Brown
(1991) shows market transactions for instream flow in California and Nevada that give annual average values of $9.75 (in 1996 dollars) per acre foot. More recently, Landry (1998) summarized annual lease prices of water for instream flow in the west at $30. Using the more recent higher cost of $30 per acre foot, the annual water leasing cost would be $1.13 million per year. Thus total costs would be $13.23 million, substantially less than even our most conservative estimate of WTP and half the next most conservative estimate of WTP. Thus, at least $5 million per year could be spent for on-site restoration with native vegetation, ri-parian improvements and fencing. Therefore, it is clear that willingness to pay of responding house-holds along the South Platte river exceeds the typical costs of the conservation easement and leasing the water rights. If one were to include all the households living in the entire South Platte river watershed, WTP would exceed the costs by an order of magnitude.
17. Conclusion
Mean WTP to increase five ecosystem services (dilution of wastewater, natural purification of water, erosion control, habitat for fish and wildlife, and recreation) along 45 miles of the South Platte river was $21 per month in a higher water bill. When the $21 is generalized to house-holds living along the river, this is sufficient to pay for the conservation easements on agricul-tural land along the river and the leasing of water for instream flow. Thus, the policy to increase ecosystem services meets the economic efficiency criteria that the gaining public could compensate 3As pointed out by a reviewer, the $41 could be an
underes-timate of the cost per acre since CRP emphasizes marginal farmland and erodable soils. Land adjacent to riparian areas may be more productive and require higher payments. As can be seen from the example, it would take a large increase in the payment to farmers before the ecosystem restoration became uneconomic.
the farmers and ranchers for the conservation easement and water and still come out ahead.
Areas for further improvement include system-atically varying the number of ecosystem services to be valued and the level of each ecosystem service to be provided. This can be done using multiple scenarios within a contingent valuation survey or through the use of contingent choice or conjoint analysis (Adamowicz et al., 1997). In this way the incremental value of specific ecosystem services could be valued and compared to the cost of providing that ecosystem service or higher level of ecosystem service.
Acknowledgements
This research was funded by the US Environ-mental Protection Agency, ecosystem valuation grant. Lucas Bair conducted about one-third of the interviews used in this analysis.
References
Adamowicz, W., P. Boxall, M., Williams, J., Louviere., 1997. Stated Preference Approaches for Measuring Passive Use Values: Choice Experiments and Contingent Valuation, 4th Annual Canadian Resources and Environmental Econom-ics Workshop.
Arrow, K., Solow, R., Portney, P., Leamer, E., Radner, R., Schuman, H., 1993. Report of the NOAA panel on contin-gent valuation. Fed. Regist. 58 (10), 4602 – 4614.
Bromley, D, 1997. Constitutional political economy: property claims in a dynamic world. Contemp. Econom. Policy 15, 43 – 54.
Brown, T., Champ, P., Bishop, R., McCollum, D., 1996. Which response format reveals the truth about donations to a public goods. Land Econom. 72 (2), 152 – 166. Brown, T., 1991. Water for wilderness areas: instream flow
needs; protection and economic value. Rivers 2 (4), 311 – 325.
Carson, R., Flores, N., Martin, K., Wright, J., 1996. Contin-gent valuation and revealed preference methodologies: comparing estimates for quasi-public goods. Land Econom. 72 (1), 80 – 99.
Carson, R., Hanemann, M., Kopp, R., Krosnick, J., Mitchell, R., Presser, S., Ruud, P., Smith, V.K., 1997. Temporal reliability of estimates from contingent valuation. Land Econom. 73 (2), 151 – 163.
Champ, P., Bishop, R., Brown, T., McCollum, D., 1997. Using donation mechanisms to value non-use benefits from
public goods. J. Environ. Econom. Manag. 33 (2), 151 – 162.
Costanza, R, 1981. Embodied energy, energy analysis and economics. In: Daly, H.E., Umana, A.F. (Eds.), Energy, Economics and the Environment: Conflicting Views of an Essential Relationship. AAAS Selected Symposium, Num-ber 64. Westview Press, Boulder, CO, pp. 119 – 145W. Costanza, R., d’Arge, R., de-Groot, R., Farber, S., Grasso,
M., Hannon, B., Limburg, K., Naeem, S., O’Neil, R., Paruelo, J., Raskin, R., Sutton, P., van den Belt, J., 1997. The value of the worlds ecosystem services and natural capital. Ecol. Econom. 25 (1), 3 – 15.
Costanza, R., d’Arge, R., de-Groot, R., Farber, S., Grasso, M., Hannon, B., Limburg, K., Naeem, S., O’Neil, R., Paruelo, J., Raskin, R., Sutton, P., van den Belt, J., 1998. The value of ecosystem services: putting the issues in perspective. Ecol. Econom. 25 (1), 67 – 72.
Cummings, R., Elliot, S., Harrison, G., Murphy, J., 1997. Are hypothetical referenda incentive compatible? J. Political Econom. 105 (3), 609 – 621.
Dailey, G, 1997. Nature’s Services: Societal Dependence on Natural Ecosystems. Island Press, Covelo, CA.
Desvousges, W., Smith, V.K., McGivney, M., 1983. A Com-parison of Alternative Approaches to Estimating Recre-ation and Related Benefits of Water Quality Improvements. Economic Analysis Division, US Environ-mental Protection Agency, Washington, DC.
El Serafy, S, 1998. Pricing the invaluable. Ecol. Econom. 25 (1), 25 – 27.
Feather, P.D., Hellerstein, D., Hansen, L., 1999. Economic Valuation of Environmental Benefits and the Targeting of Conservation Programs: Agricultural Economic Report (778). USDA Economic Research Service, Washington, DC.
Greenley, D., Walsh, R., Young, R., 1982. Economic Benefits of Improved Water Quality: Public Perceptions and Preser-vation Values. Westview Press, Boulder, CO.
Hanemann, M, 1984. Welfare evaluations in contingent valua-tion experiments with discrete responses. Am. J. Agric. Econ. 67 (3), 332 – 341.
Hanemann, M, 1989. Welfare evaluations in contingent valua-tion experiments with discrete response data: reply. Am. J. Agric. Econom. 71 (4), 1057 – 1061.
Hanemann, M., Loomis, J., Kanninen, B., 1991. Statistical efficiency of double-bounded dichotomous choice contin-gent valuation. Am. J. Agric. Econom. 73 (5), 1255 – 1263. Hoehn, J., Randall, A., 1989. Too many proposals pass the
benefit – cost test. Am. Econom. Rev. 79, 544 – 551. Krutilla, J, 1967. Conservation reconsidered. Am. Econom.
Rev. 57, 787 – 796.
Landry, C, 1998. Saving Our Streams Through Water Mar-kets. Political Economy Research Center, Bozeman, MT. Loomis, J, 1987. Balancing public trust resources of Mono
Lake and Los Angeles’ water right. Water Resour. Res. 23 (8), 1449 – 1456.
Loomis, J., White, D., 1996. Economic benefits of rare and endangered species. Ecol. Econom. 18, 197 – 206. Loomis, J., Walsh, R., 1997. Recreation Economic Decisions:
Second Edition. Venture Press, State College, PA. Loomis, J., Brown, T., Lucero, B., Peterson, G., 1997.
Evalu-ating the validity of the dichotomous choice question format. Environ. Resour. Econom. 10, 109 – 123. Loomis, J., Ekstrand, E., 1998. Alternative approaches for
incorporating respondent uncertainty when estimating will-ingness to pay. Ecol. Econom. 27, 29 – 41.
Mitchell, R., Carson, R., 1989. Using Surveys to Value Public Goods: The Contingent Valuation Method. Resources for the Future, Washington, DC.
Moore, W., McCarl, B., 1987. Off-site costs of soil erosion: a case study of the Willamette valley. West. J. Agric. Econom. 12 (1), 42 – 49.
Odum, H.T, 1983. Systems Ecology: An Introduction. Wiley, New York, NY.
Page, S., Skold, M., 1996. Crop Prices and CRP Participation: Some Analyses for Northeastern Colorado: Agricultural and Resource Policy Report. Department of Agricultural and Resource Economics, Colorado State University, Fort Collins, CO.
Park, T., Loomis, J, Creel, M., 1991. Confidence intervals for evaluating benefit estimates from dichotomous choice con-tingent valuation studies. Land Econom. 67 (1), 64 – 73. Strange, E., Fausch, K., Covich, A., 1999. Sustaining
ecosys-tem services in human dominated watersheds: biohydrol-ogy and ecosystem processes in South Platte river basin. Environ. Manag. 24 (1), 39 – 54.
Toman, M, 1998. Why not to calculate the value of the world’s ecosystem services and natural capital. Ecol. Econom. 25 (1), 57 – 60.
Department of Interior Natural Resource Damage Assess-ments: Final Rule, 1986. Federal Register 51 (148). Wash-ington, DC.
Department of Interior Natural Resource Damage Assess-ments: Final Rule, 1994. Federal Register 59 (58). Wash-ington, DC.
District Court of Appeals. State of Ohio v US Department of Interior, July 14, 1989. Case Number 86-1575. District of Columbia.
US Water Resources Council, March 10, 1983. Economic and Environmental Principles and Guidelines for Water and Related Land Resources Implementation Studies. US Gov-ernment Printing Office, Washington DC.