ANALYSIS
Managing nutrient fluxes and pollution in the Baltic: an
interdisciplinary simulation study
R. Kerry Turner
a,*, Stavros Georgiou
a, Ing-Marie Gren
b, Fredric Wulff
c,
Scott Barrett
d, Tore So¨derqvist
b, Ian J. Bateman
a, Carl Folke
b,c,
Sindre Langaas
e, Tomasz Z
;
ylicz
f, Karl-Go¨ran Ma¨ler
b,
Agnieszka Markowska
faCentre for Social and Economic Research on the Global En6ironment,Uni6ersity of East Anglia and Uni6ersity College London,
Norwich,NR4 7TJ,UK
bBeijer International Institute of Ecological Economics,The Royal Swedish Academy of Sciences,Box50005,
S-10405Stockholm,Sweden
cDepartment of Systems Ecology,Uni6ersity of Stockholm,106 91Stockholm,Sweden dLondon Business School,London,NW1 4SA,UK
eUNEP/GRID-Arendal,P.O.Box1602,Myrene,N-4801Arendal,Norway fWarsaw Ecological Economics Centre,Economics Department,Warsaw Uni
6ersity,00-41Warsaw,Poland
Received 21 July 1997; received in revised form 6 April 1999; accepted 15 April 1999
Abstract
This interdisciplinary paper reports the results of a study into the costs and benefits of eutrophication reduction in the Baltic Sea. A large multidisciplinary team of natural and social scientists estimated nutrient loadings and pathways within the entire Baltic drainage basin, together with the costs of a range of abatement options and strategies. The abatement cost results were compared with clean-up benefits on a basin-wide scale, in order to explore the potential for international agreements among the countries which border the Baltic. Most countries would seem to gain net economic benefits from the simulated 50% nitrogen and phosphorus reduction policy. © 1999 Elsevier Science B.V. All rights reserved.
Keywords: Nutrient pollution; Eutrophication; Cost-effective abatement costs; Environmental benefits valuation; Contingent valuation
www.elsevier.com/locate/ecolecon
1. Introduction
All countries with a coastline have an interest in the sustainable management of the coastal re-* Corresponding author. Tel.:+44-1603-593176; fax:+
44-1603-593739.
E-mail address:[email protected] (R.K. Turner)
source systems. The task of sustainable manage-ment, i.e. sustainable utilisation of the multiple goods and services provided by coastal resources (processes, functions and their interrelationships), is likely to be made more difficult because of the consequences of global environmental change (GEC). Understanding the interactions between the coastal zone and global changes cannot be achieved by observational studies alone. Modeling of key environmental processes also has an impor-tant role to play. In particular, modelling work on the dynamics of carbon (C), nitrogen (N) and phosphorus (P) in the coastal ocean needs to be combined with socio-economic analysis of the drivers of C, N and P fluxes and the human welfare consequences of changes in these fluxes across the coastal zone over time.
A particular characteristic of GEC (encompass-ing population growth and density increases, ur-banisation and the intensification of agriculture, etc.) is that it has led to, among other things, the progressive opening of biogenic nutrient cycles, e.g. much increased mobility of nitrogen and phosphorus. This increased mobility of nutrients has meant increased exchanges between land and surface water and consequent impacts on the eco-logical functioning of aquatic systems. Other pro-cess changes have also added to the cumulative changes experienced in coastal systems.
The major flux of nutrients from land to sea occurs through river transport via the drainage basins network. The network contains various ‘filters’ such as wetlands which retain or assimilate nutrients during their downstream passage to the sea. The effectiveness and selectivity of these filters depend on the strong biogeochemical cou-pling existing between carbon, nitrogen, phospho-rus and silica circulation. They are also affected by hydrology and land use/cover (Howarth et al., 1996).
This paper reports the overall results of an interdisciplinary study which focused on N and P fluxes on a drainage basins-wide scale in the Baltic Region (Turner et al., 1995). The Baltic Sea re-gion catchment area covers around 1 670 000 km2
and contains a population of about 85 million people in 14 countries. A significant proportion of the world’s industrial production comes from this
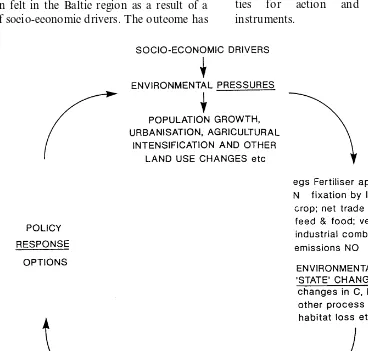
area, but up until around 40 years ago there was little recorded environmental damage in the Baltic Sea. However, since 1960 the environmental con-dition of the Baltic Sea has increasingly become a cause of public concern and is currently perceived to be in an unacceptably polluted state. Symboli-cally, eutrophication is a major problem facing policymakers and the public. The aims of the study were decomposed into a number of interre-lated intermediate goals including: (1) to provide a comprehensive and rigorous picture of the land use and ecological carrying capacity of the region, and to relate this resource inventory to the pat-terns of human activity in the region; a ‘pressure-state-impacts-response (P-S-I-R) framework (Fig. 1) was adopted to facilitate the analysis; (2) to develop a model looking at different nutrient loading scenarios and their consequences on the ecological state of the Baltic Sea and its sub-sys-tems; (3) to estimate the costs of various strategies designed to reduce the nutrient loading of the Baltic Sea, and the identification of the most cost-effective nutrient abatement options; (4) to estimate the economic valuation of eutrophication damage to the Baltic Sea; (5) to increase our understanding of the institutional issues involved in the management of the Baltic Sea.
The GEC process is a complex flux of factors, the impacts of which can manifest themselves at a number of different spatial and temporal scales. It is, however, possible to identify a group of inter-related socio-economic trends and pressures which both contribute significantly to the Baltic’s environmental change impacts, as well as to an increasing degree of environmental risk to the marine ecosystem and the surrounding drainage basins’ biophysical and socio-economic systems. This paper therefore seeks to analyse the prob-lems of the Baltic region in terms of a ‘pressure-state-impacts-response’ (P-S-I-R) framework (Fig. 1).
2. Pressure-state-impact-response framework
wet-lands, lakes and a mountainous terrain. The southern sub-basins (Baltic Proper) contain 55 million of the 85 million population and have significant agricultural areas. The Baltic Sea itself has a total surface area of 415 000 km2 and
be-cause of its semi-enclosed character has a very slow water exchange, the mean residence time for the entire water mass being of the order of 25 – 30 years (Folke et al., 1991). As we shall see this combination of biophysical and socio-economic characteristics has important implications for the environmental vulnerability of the Baltic Sea and its resource system.
An increasing degree of environmental pressure has been felt in the Baltic region as a result of a range of socio-economic drivers. The outcome has
been that the Baltic Sea and coastal zone re-sources (including the waste assimilative capacity) have been subject to a range of, often competing, usage demands. In this paper we pay particular attention to nutrient (nitrogen and phosphorus) pollution of the Baltic Sea and its consequences. Evaluating the importance (in human welfare terms) of the various environmental impacts re-quires that their effects be measured in biophysi-cal and then in monetary terms. This gives us some measure of the state of the Baltic environ-ment and the importance of the environenviron-mental degradation that has taken place. In addition, we seek to identify the causes of the problem, priori-ties for action and cost-effective policy instruments.
The Baltic Sea is the largest brackish body of water in the world and is a naturally very sensitive area. It depends on short- and long-term varia-tions in climate and has several times in its history transformed from lake to sea, from freshwater to saline water. Vertical variations in salinity cause permanent stratification, hampering the exchange of oxygen in the deeper parts of the sea. In some years as much as 100 000 square kilometres (nearly 25% of the total area) approach ‘dead bottom’ conditions.
The natural vulnerability of the area has been magnified by the magnitude and extent of socio-economic activities, impacts and interventions that have become commonplace since the 1950s. The economic and the environmental systems are now sufficiently interrelated as to be jointly deter-mined. They are now in a process of coevolution. Because of the sheer scale of economic activity the pollution generated is a pervasive problem across the drainage basin and beyond. Localised solu-tions, for example at the municipal level, are no longer sufficient; international co-operative agree-ments and actions are required.
The principal pollution sources for the Baltic Sea are municipalities, industries and agriculture, located both in the coastal zone and also beyond in the drainage basin. A range of pollution path-ways can also be identified, including diffuse ‘non-point’ sources such as airborne emissions and agricultural run-off, and ‘point’ source pollution from urban areas and industry.
Inadequate or absent municipal sewage treat-ment in the eastern, southern and south-western sections of the drainage area pose problems which are exacerbated by the synergistic effects of un-treated industrial effluent wastestreams passing through the same facilities and into the rivers and the sea. Agricultural practices, including intensive livestock husbandry, are also a major contributor to the high nutrient load and consequent eu-trophication problem. Current loads of nitrogen and phosphorous entering the Baltic sea are three times those of the 1950s (Nehring et al., 1990). The resulting excessive biomass growth causes oxygen depletion when it decays and threatens marine life. Eutrophication is now pronounced in the Gulf of Finland, Gulf of Riga and in limited
coastal areas in the eastern, southern and south-western Baltic Sea area. Many toxic algae out-breaks have also occurred.
It is important therefore to know what the principal causes of the resource degradation and pollution problems in the Baltic Sea are. One way of analysing these problems is to identify a set of interrelated ‘failures’ phenomena which seem to underlie the degradation and quality decline trends. There are two main related ‘failures’ which can be distinguished — market failure and policy intervention failure – which when combined with scientific and social uncertainties (information failure) can account for the environmental dam-age process.
3. Market and policy intervention ‘failures’
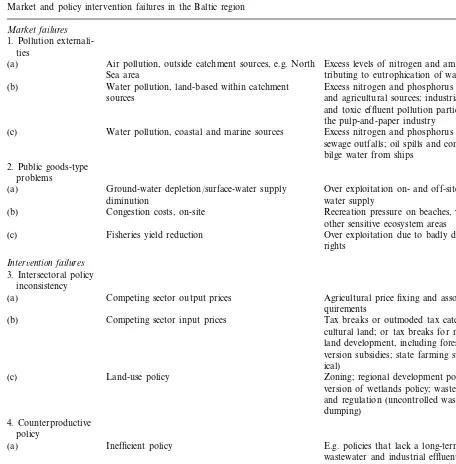
Table 1 presents a typology of market and intervention failures which is relevant to the Baltic context. The most widespread type of market failure is that of pollution externalities. The exter-nal costs result from waste generators (municipal-ities, industry and farms) who over-utilise the waste assimilative capacity of the ambient envi-ronment, e.g. rivers and the Baltic Sea, because this environmental function is perceived to be virtually free of charge (absence of market prices). Some waste generators also have had over time close to open access to the marine waste repository.
Government interventions have also been partly responsible for the environmental degradation process in the Baltic. The effectiveness of the regulation of sewage treatment facilities and prac-tices, for example, varies dramatically from coun-try to councoun-try around the Baltic. There is a general absence of properly integrated coastal re-source management policies and water catchment management and planning. This has resulted in intersectoral policy inconsistencies and resource depletion and degradation, with the loss of wet-land ecosystems being an important damage impact.
Table 1
Market and policy intervention failures in the Baltic region
Market failures
1. Pollution externali-ties
Excess levels of nitrogen and ammonia con-Air pollution, outside catchment sources, e.g. North
(a)
Sea area tributing to eutrophication of water bodies Water pollution, land-based within catchment
(b) Excess nitrogen and phosphorus from sewage
and agricultural sources; industrial wastewater sources
and toxic effluent pollution particularly from the pulp-and-paper industry
(c) Water pollution, coastal and marine sources Excess nitrogen and phosphorus from coastal sewage outfalls; oil spills and contaminated bilge water from ships
2. Public goods-type problems
Ground-water depletion/surface-water supply
(a) Over exploitation on- and off-site of wetlands’
water supply diminution
(b) Congestion costs, on-site Recreation pressure on beaches, wetlands and other sensitive ecosystem areas
(c) Fisheries yield reduction Over exploitation due to badly defined property rights
Inter6ention failures
3. Intersectoral policy inconsistency
Agricultural price fixing and associated land re-Competing sector output prices
(a)
quirements
(b) Competing sector input prices Tax breaks or outmoded tax categories on agri-cultural land; or tax breaks for non-agriagri-cultural land development, including forestry; land con-version subsidies; state farming subsidies (histor-ical)
Zoning; regional development policy; direct con-Land-use policy
(c)
version of wetlands policy; waste disposal policy and regulation (uncontrolled waste disposal dumping)
4. Counterproductive policy
(a) Inefficient policy E.g. policies that lack a long-term structure; wastewater and industrial effluent combined treatment practices; general lack of enforcement of existing policy rules and regulations (b) Institutional failure Non-integrative agencies structure, non-existent
agencies; lack of monitoring and survey capac-ity; lack of information dissemination; lack of public awareness and participation
with greater severity in Poland, Russia, the Bal-tic Republics and the Slovak and Czech Re-publics, partly as a result of the historical leg-acy left by a central planning system based on input intensive, inefficient heavy industry com-plexes.
The dire message for Baltic policymakers in the future is clear — if the agricultural sectors in Poland, etc., develop intensive methods similar to those fertiliser/pesticide-dominated regimes com-monplace in Denmark and Sweden, the outlook for the reduction of eutrophication pollution is poor.
4. Land use, nutrient loads and damage in the Baltic Sea
The current status of the Baltic Sea is deter-mined by the set of activities present in the entire drainage basin. The load of nutrients to the vari-ous sub-drainage basins is determined by several factors such as land use, population density, cli-mate, hydrology, and air transportation of nitro-gen oxides and ammonium. A set of geographic information system (GIS) map layers were created and used to generate information on the current landscape characteristics and population distribu-tion patterns in the drainage basin. The map layers included: land cover, drainage basis, ad-ministrative units, population distribution, arable lands, pasture lands, wetlands, and the terrestrial net primary production of the Baltic drainage basin. A description of the technical procedures and the primary data sources used to create each layer, as well as an assessment of data quality, is presented in Sweitzer and Langaas (1994), Folke and Langaas (1995), and Sweitzer et al. (1996).
The map layers in this database were combined to generate new results. The maps were used to generate basic statistics on land use and popula-tion in the drainage basin, which we briefly report on below. We also present results showing the distribution of land cover and population as a function of distance from the coast, since this information is directly relevant to the eutrophica-tion problem in the Baltic Sea.
It was found that forests dominate the land-scape in the drainage basin (48% coverage), fol-lowed by arable land (20%), and non-productive open lands (17%). Wetlands cover roughly 8% of the drainage basin and are most prominent in the northern regions. Turning to population, about 85 million people live in the Baltic Sea drainage
basin. Of these, the vast majority (64%) live in the Baltic Proper drainage areas. Of the total drainage basin population 26% (22 065 000 peo-ple) live within metropolitan areas (population\ 250 000). Of the total population, 54% live in towns or small cities (population between 200 and 250 000), and 29% are inhabitants of rural settle-ments (population B200 000).
Using the land cover and population map lay-ers and an adjusted map of the drainage basin we further determined the characteristics of the drainage basin as they relate to distance from the coast. The further away from the coast or from rivers that eutrophying substances are released, the more likely they are to be absorbed through ecosystem processes and prevented from entering the Baltic Sea. High population concentrations, agricultural land, and urbanised land are all im-portant nutrient generation sources. Wetlands, forests and inland water bodies can act as natural filters/sinks for nutrients as well as other pollu-tants. Given this, it is important to determine the landscape characteristics of the drainage basin as a function of distance from the coastline and rivers.
At its furthest point, the drainage basin is nearly 650 km away from the Baltic Sea shoreline. Land cover and population of the drainage basin were assessed at 10-km intervals extending away from the coast. It was found that while most of the land use classes are distributed fairly evenly throughout the drainage basin, population — par-ticularly urban population — is heavily concen-trated toward the coast. Within a 10-km distance from the Baltic coast, for example, we find 27% of the populated area and 19% of the total drainage basin population — nearly 15 million people. Of these 90% are concentrated in urban areas. Also within this area we find 8% of the total arable land, 5% of the pasture land, 5% of the forests, and 2% of the inland water bodies.
forest, and 10% of the inland lakes are found within a 50-km distance from the coast. More detailed results are reported in Sweitzer et al. (1996).
The information on the location of various land uses and population within the drainage basin provides a useful basis for the estimation of nutri-ent load discharged directly into the Baltic Sea or transported by surface water to which we now turn.
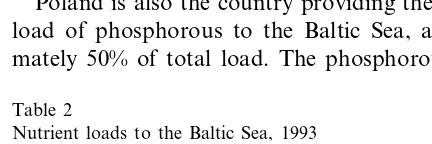
In 1993, the total load of nitrogen and phos-phorous to the Baltic Sea amounted to approxi-mately 1022 000 t of N and 39 000 t of P. The largest basin of the Baltic Sea, the Baltic Proper, receives about 85% of the total load of both nitrogen and phosphorous (Table 2).
In principle, there are two major sources of waterborne nutrient loads, arable land and sewage treatment plants. In addition atmospheric trans-ports of nitrogen are also deposited directly on the Baltic Sea. Air transports originate, not only from countries within the drainage basin, but from other external countries.
The agricultural sector, excluding the emissions of ammonium, accounts for one-fifth of the total load of nitrogen. Other water transports of nutri-ents include flows from sewage treatment plants and air emissions deposited on land within the drainage basin, accounting for nearly 50% of the total load. The direct discharges, mainly sewage treatment plants located at the coast, correspond to approximately 10% of the total load. Poland is the largest discharging country with respect to total nitrogen loading (28.5%), followed by Swe-den (10.4%) and Germany (10.2%).
Poland is also the country providing the largest load of phosphorous to the Baltic Sea, approxi-mately 50% of total load. The phosphorous load
from the agricultural sector accounts for about one-third of the total load and the direct dis-charges, mainly from sewage treatment plants cor-respond to one-quarter of the total load.
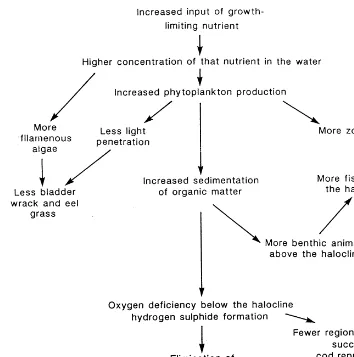
The increased nutrient flux entering the Baltic Sea implies a higher concentration of a given nutrient which in turn may lead to an overabun-dance of phytoplankton production. As a result of increases in phytoplankton production, oxygen deficits may occur which reduce the spatial extent of regions available for successful cod reproduc-tion. On the other hand, more zooplankton in-creases the stocks of other fish species (Fig. 2).
Although the impacts of greater nutrient input are well documented, the quantitative relation-ships between variations in loads of nutrients and concentration are poorly understood. For in-stance, the eutrophicating processes will alter re-dox conditions and thus the biogeochemical pathways and efficiency of internal sinks of nitro-gen and phosphorous through denitrification; phosphorous adsorption will also be altered. The different sub-basins vary in terms of water and nutrient residence times, load received, and inter-nal biogeochemical processes. These differences will significantly alter the N/P ratios in each sub-basin. Fig. 3 illustrates that there are processes in the sea that change the concentrations of nutri-ents, with specific differences between basins as well as between nutrients species: in the Bothnian Bay, the phosphorus loss (P-sink) is much more efficient than the sink for nitrogen. In the Baltic Proper, it is the opposite — a more efficient N-sink than P-sink. There is a gradient from north to south where the production in the Bothnian Bay is P-limited and the Baltic Proper is N-limited. The N/P ratio of 18 in the Baltic Proper is for total-N and P that includes a lot of refractory organic matter: for the inorganic fractions it is about 4, far below the Redfield ratio (data are not available to show inorganic N/P ratios both in terms of load and concentration).
An empirical budget model of the Baltic Proper has been expanded to cover all three sub-basins. The model consists of the three coupled basins with advective water and nutrient transports be-tween these and with Kattegat (Wulff, 1995). Em-pirical relationships between load, nutrient Table 2
Nutrient loads to the Baltic Sea, 1993
Nitrogen (t) Phosphorous (t)
Bothnian Bay 60 787 3008 100 699
Bothnian Sea 3063
32 817 Baltic Proper 861 268
38 888 1 022 754
Fig. 2. Eutrophication impacts. Regarding eutrophication problems, the quantitative relationships between variations in loads of nutrients and concentration are poorly understood.
concentrations and advective transports derived from extensive regional data sets over the last few decades have been used to empirically calculate relationships between concentration and internal nutrient sink terms. These models rely on past relationships between inputs of water, nutrients and the observed trends in concentrations in the different basins of the Baltic. Several analyses have been undertaken to collate and verify these data sets.
The basic information on the flow of nutrients from the land to the Baltic Sea and their impact on the sea is required in order that abatement measures designed to improve the conditions in
the Baltic Sea can be selected on the basis of minimum cost. But before we can address the abatement options and their costs question we need to estimate the ‘filter’/sink capacities of wet-lands in the drainage basins.
elimination capacity to be about 100 000 t per year (Jansson et al., 1999).
The GIS database was used to assess the spa-tial relationship between nutrient sources and sinks. Maps were created to show the location of wetlands in relation to population centres in the Baltic drainage basin. The assumption is that wetlands will function more effectively as nutrient traps if they are in close proximity to nutrient sources. A visual assessment of the maps shows that areas with high concentrations of wetlands in the drainage basin are not near the densely populated regions. Areas with mod-erate or low concentrations of wetlands tend to have low or moderate population densities. These results suggest that development and restoration of wetlands in highly populated and also intensively cultivated areas could be an ef-fective and practicable means to reduce nutrient flows into the Baltic Sea.
Therefore, we estimated the potential nitrogen retention/elimination capacity in a scenario where drained wetlands in the drainage basin would be restored. The capacity of wetlands to retain/eliminate nitrogen in such a scenario was estimated at about 180 000 t per year (Jansson et al., 1999). Additional analyses on the nitrogen filtering capacity will be reported on below in relation to the analyses of cost-efficient nitrogen abatement.
Fig. 4. Reduction from current levels of both N and P load with 50% to Baltic Proper.
Fig. 3. Variations in N/P ratios.
5. Nutrient reduction simulations
Two nutrient reduction simulations were car-ried out.
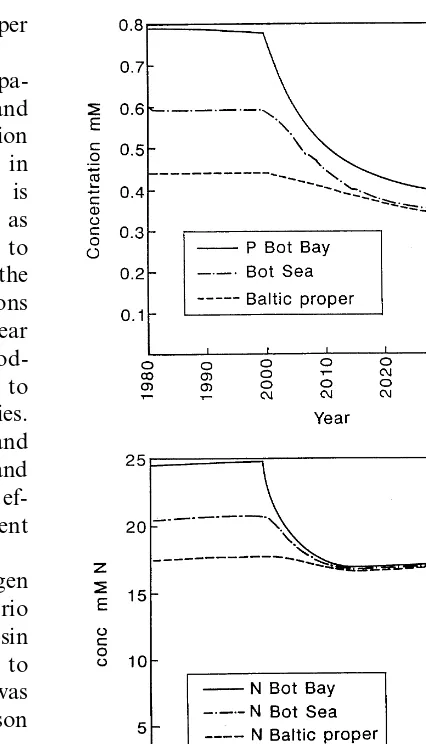
the nitrogen concentrations reach this new steady state within 10 years while it takes about 25 years for phosphorous. This is due to the inherently different behaviour of these nutrients in the Baltic (and in most other marine systems). Denitrifica-tion represents an efficient internal nutrient sink for N while P reduction is less efficient in this brackish system. According to the results pre-sented in Fig. 5, the final concentration of P and N are about 50 and 70% of the current levels in the Baltic Proper.
It is difficult to estimate the ecological conse-quences from the output of this model alone — the results have to be related to empirical knowledge of ‘the state of the Baltic’ with different trations of nutrients. The ‘new’ nutrient concen-tration corresponds roughly to levels found during the 1960s, before the drastic deterioration
Fig. 6. Reduction of phosphorus loads to Baltic Proper.
Fig. 5. Reduction from current levels of both nitrogen and phosphorus load but only to the Baltic Proper.
of the Baltic environment occurred. We would expect less primary production of organic matter and thus less frequent periods of oxygen defi-ciency in the deep basins. It is also likely that the decrease in P concentrations will reduce the fre-quency of cyanobacterial bloom during the late summer. These are now favoured by the high P concentrations (and low N/P ratio) found during summer and cause accumulations of sometimes toxic algal mats on the surface of the Baltic Proper.
input and concentration of P means that less N will be utilised in the biogeochemical cycles, since these nutrients are utilised in fixed stochiometric Redfield ratios (16 mol of N for each mol P). Thus, less N will be incorporated into organic matter and subsequently mineralised and deni-trified (lost) in this scenario. The Baltic Proper and Bothnian Sea will change from N-limited to P-limited systems in this scenario.
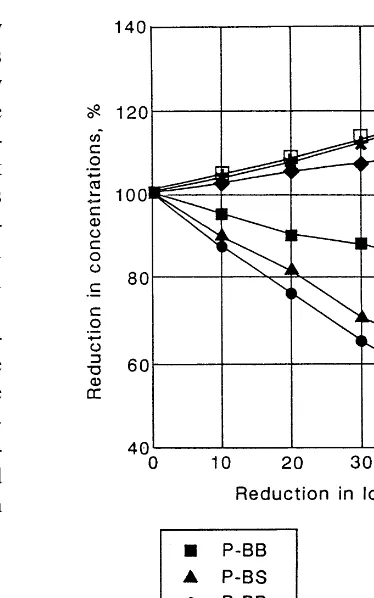
The model simulations presented above illus-trate the consequences of nutrient reductions on a basin-wide scale. However, decisions about abate-ment policies are often made because of concerns at the local or regional level, rather than on the basis of large-scale environmental concerns. The resulting conflicts from a Baltic-wide perspective are discussed by Wulff and Niemi (1992), and are further explored below in a regional study of the Gulf of Riga. A nutrient budget exists that de-scribes nutrient inputs, retention and exports of nitrogen and phosphorous from this highly eu-trophicated bay adjacent to the Baltic Proper. This is a region of the Baltic where lack of sewage treatment contributes to very large inputs of P to the sea. A reduction of P inputs of more than 30% would occur if a modern sewage treatment plant was built for the city of Riga. A model was therefore built to explore the consequences of different N and P reduction schemes on the Gulf and the Baltic Sea. One model run is illustrated in Fig. 7. The net exports of nitrogen and phospho-rous to the Baltic are shown in relation to differ-ent levels of P reduction in the inputs of the Gulf. Naturally, a P reduction in inputs will result in reduced exports of P. However, more nitrogen will be exported to the (N-limited) Baltic Proper. These model simulations, although based on very simplistic assumptions, empirical relation-ships and basic physical and biogeochemical properties, show very clearly the basic features and interactions of hydrodyanamics and biogeo-chemistry of nitrogen and phosphorous in the Baltic Sea region. The overall model clearly demonstrates that it is reduction of inputs to the Baltic Proper that is most efficient in reducing concentrations in this basin. A strategy where all inputs are uniformly reduced is not optimal since the situation in the two northern basins is not
critical in terms of eutrophication (only small amounts of nutrients are exported southwards).
The simulations also demonstrate that both nitrogen and phosphorous inputs have to be re-duced. This is also emphasised in the regional Gulf of Riga study where it was shown that a P removal might actually increase the net export to the off-shore Baltic Proper. It has also been demonstrated that it will take several decades before the nutrient levels are returned to an ac-ceptable level, particularly for phosphorous.
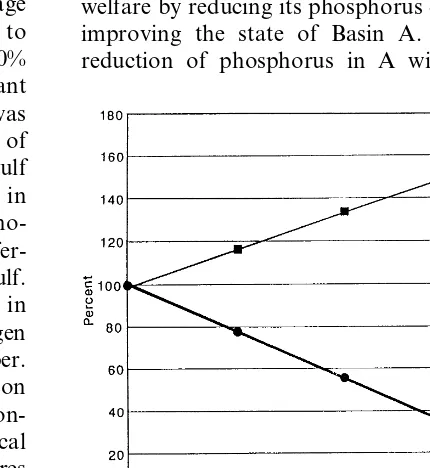
To understand the institutional implications of this result, consider a problem in which there are two basins, each controlled by a different country acting unilaterally. Basin A is phosphorus-limited (like the Gulf of Riga) while Basin B is nitrogen-limited (like the Baltic Proper). Country A con-trols discharges into Basin A and has preferences only over the quality of this Basin. Similarly, Country B controls discharges into Basin B and cares only about eutrophication in this Basin. As Basin A is phosphorus-limited, A can enhance its welfare by reducing its phosphorus discharges and improving the state of Basin A. However, the reduction of phosphorus in A will also release
nitrogen, and this released nitrogen will be ex-ported to Basin B. As B is nitrogen-limited (i.e. phosphorus-rich), eutrophication will increase in Basin B as a consequence of the actions under-taken by A. Similarly, if Country B reduces its nitrogen discharges in Basin B, phosphorus will flow into Basin A, exacerbating A’s eutrophica-tion problem.
As abatement of phosphorus by A increases eutrophication in B, Country B’s best response is to reduce its nitrogen discharges further. But in doing so eutrophication is made worse in A, and A will therefore respond by reducing its phospho-rus discharges even further. The process will con-tinue until neither country can improve its welfare by abating discharges any further. This state defi-nes the equilibrium in unilateral policies. As nei-ther A nor B take into account the effect of their actions on the welfare of the other country, each is driven to abate its own Basin’s limiting pollu-tant too much and the other Basin’s limiting pollutant too little. As is typical of all equilibria in unilateral policies, pollution of both Basins is excessive compared with the full co-operative out-come. However, in contrast to every paper so far published in the literature, abatement (of each Basin’s limiting pollutant) is also excessive in the equilibrium in unilateral policies. For more detail see Barrett (1995). The policy implication is that full co-operation is the optional strategy, but one in which abatement effort is redistributed rather than merely increased overall. Since marginal costs increase with abatement effort, this means that a small redistribution in abatement will lower total costs as well as total environmental damages.
6. Cost effective abatement strategies
Cost effectiveness is defined as achieving one or several environmental targets at minimum costs. A condition for cost-effectiveness is that the mar-ginal costs of all possible measures are equal. Marginal cost is defined as the increase in costs when, in our case, nutrient load to the Baltic Sea is decreased by 1 kg N or P. As long as the marginal costs are not equal it is always possible
to obtain the same level of nutrient reductions at a lower cost by reducing the load via measures with relatively low costs and increasing the load by the same amount via measures with relatively high costs. Thus, in order to calculate cost-effec-tive nutrient reductions to the Baltic Sea we have to (i) identify all possible measures, (ii) quantify their impact on the Baltic Sea, and (iii) calculate marginal costs for all measures.
The environmental impact of a certain reduc-tion of nutrient load at the source is, ceteris paribus, determined by the location of the source. If the source is located some distance away from the coastal waters of the Baltic Sea, only a frac-tion of any reducfrac-tion at the source is finally felt at the coast. The share of the source reduction that reaches the coast depends on the retention of the nutrient that may occur at various points between the source and the coast. This implies that, for a given marginal cost at the source, the marginal cost of coastal load reduction is higher than for remote sources with low impact on the coast. In order to calculate impacts of source-related mea-sures we require information on source location as well as on transportation of nitrogen and phos-phorous. No water and soil transport models exist for the drainage basin and so we use very sim-plified retention numbers.
The abatement measures can be divided into three different classes:
1. reductions in the deposition of nutrients on Baltic Sea and on land within the drainage basin,
2. changed land uses reducing leaching of nutri-ents, and
Table 3
Marginal costs of different measures reducing the nitrogen load to the coast, SEK/kg N reduction
Sewage treatment plants Atmospheric deposits
Region Agriculture Wetlands
Sweden 20–242 24–72 135–9500 23
24–60 874–6187
57–220 66
Finland
20–122
Germany 24–60 210–3576 27
Denmark 23–200 24–60 544–3576 12
7–35 523–3412
12–101 10
Poland
59–196
Latvia 7–35 183–1195 20
7–35 254–1723
St Petersburg 7–35 353–1884 51
7–35
Kaliningrad 28–210 273–1593 43
742–4184
obtained by a reduction in the use of fertilisers and reductions in livestock. Another measure in-cluded is a change in spreading time of manure from autumn to spring. Decreases in leaching from arable land are obtained by increasing the area covered by catch crops, energy forests, and ley grass. Nutrient sinks are created by con-structing wetlands downstream in the drainage basin close to the coastal water.
In principle, the cost of an abatement mea-sure includes the cost at the emission source and the cost impacts on other sectors of the econ-omy. In the following analysis we only include the abatement costs at the source, which are calculated by means of engineering methods and econometric techniques (see Gren et al., 1995, for details about the cost estimation work). The calculated marginal costs at the source for dif-ferent abatement measures aimed at reducing ni-trogen load in different regions (Table 3) indicate that increased nitrogen cleaning capac-ity at sewage treatment plants is a low cost measure in all countries. Further low cost mea-sures include, in the agricultural sector, the re-duction in use of nitrogen fertilisers and cultivation of cash crops. Another low cost op-tion is the construcop-tion of wetlands, whereas measures reducing air emissions are relatively expensive in all countries.
The marginal cost of phosphorous reductions tends to be much higher than those for nitrogen (Table 4). Nevertheless, measures involving im-provements in sewage treatment plants represent relatively low cost reduction options. Restora-tion of wetlands is relatively expensive. It can be seen that phosphorus reduction in Swedish wet-lands is more than ten times more expensive than Finland, for example. This is because the cheaper Swedish measures with respect to wet-lands have already been extensively deployed, whereas they have not in the other countries.
Table 4
Marginal costs of phosphorous reductions, SEK/kg P reduc-tion
Region Agriculture Sewage treat- Wetlands ment plants
155–6604
Sweden 41–52 18232
225–6080
Finland 41–52 1748
Denmark 144–2610 41–68 1202
899
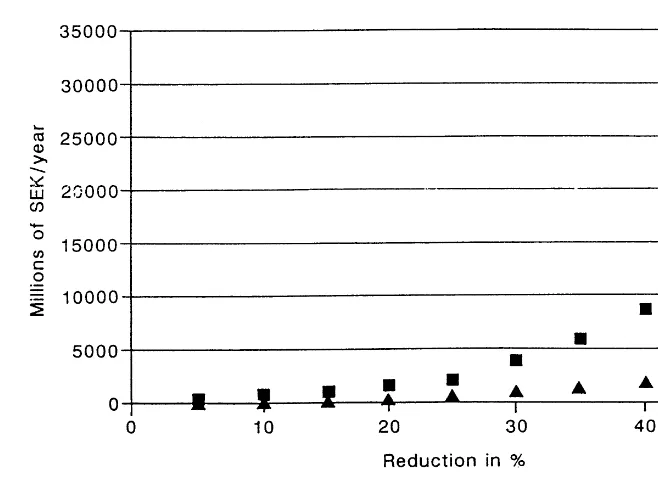
Fig. 8. Cost effective N and P reductions.
6.1. Minimum costs of nutrient reductions
Because it is reductions in nutrient loads to the Baltic Proper which have the main impact on the ratio N/P, we estimate minimum costs for load reductions to this basin only. The minimum costs for various reductions in either N or P are shown in Fig. 8.
We can see from the figure that the costs of reducing the load of nitrogen are much higher than the costs of corresponding decreases in phos-phorous loads.
Several of the measures, such as livestock re-ductions, change of manure spreading time and wetlands restoration, imply reductions in both nitrogen and phosphorous. When one of these measures is implemented with the aim of reducing the load of one nutrient, reductions are obtained in the other nutrient load ‘free of charge’. These joint impacts on several nutrients imply that abatement measures are relatively less costly if simultaneous reductions in N and P are under-taken. Total costs for various reduction levels are then lower for simultaneous decisions on N and P
than for separate decisions, especially for abate-ment levels in excess of 40% reductions (see Gren (1995) for more details). Note that P is more ‘mobile’ than N and therefore requires more abatement effort, thus P can be the ‘keystone’ pollutant, i.e. if P is managed then so is N but not usually the other way around.
In order to achieve a 50% reduction in nitrogen loading the most cost effective mix of measures would be one in which agriculture, wetlands and sewage treatment plant-related measures account for 35, 28, and 31%, respectively, of the total nitrogen reduction. Measures involving air emis-sions account for 6%. The single most important country source in a cost effective reduction strat-egy is Poland, which accounts for 40% of the total reduction (corresponding to about 2/3 of the Pol-ish load of nitrogen). We also note that Poland, Russia and the Baltic states account for 72% of the total nitrogen reduction. The nitrogen reduc-tion contribureduc-tion of Swedish and Finnish regions amounts to only 8 and 7%, respectively.
and in fact it is only in Germany that such measures form part of a cost-effective abatement package. Instead, measures relating to sewage treatment plants are of major importance, ac-counting for 66% of the total reduction. This is a reflection of the relatively large load of phospho-rous from households and industries and the availability of low cost abatement options. Again the single most important country source in a cost effective reduction strategy is Poland, which ac-counts for 67% of the total reduction. The Baltic states, Poland and Russia together account for approximately 90% of the total phosphorus reduction.
It is important to emphasise that the cost esti-mates are based on several assumptions of a biological, physical and economic character. The biological assumptions refer to retention of nutri-ents, the leaching impact of agricultural measures and the nitrogen removal capacity of wetlands. The physical assumptions concern the feasibility limits of different measures such as nutrient clean-ing capacity of sewage treatment plants and area of land available for alternative land uses. The economic assumptions relate to the estimation of the costs of the various measures. According to the results of sensitivity analysis, both the costs of nitrogen and phosphorous reduction seem to be sensitive to assumptions of a biological character. Changes in the physical assumption about land available for agricultural measures often have a significant impact of the total costs. It should be noted, however, that the sensitivity analysis was carried out only for an overall reduction of 50% in the load of both nutrients. At other overall reduction levels, the costs may be sensitive to other types of assumptions.
7. Benefits valuation
The process of measuring the economic value of eutrophication damage in the Baltic involves three basic stages. Firstly, discharges of nutrients into the Baltic lead to eutrophication as outlined ear-lier and this leads to reductions in the various measures of environmental quality. Second, these changes in environmental quality lead to changes
in the stream of services (use and non-use values) provided by the Baltic region. Third, the change in the stream of services will affect individuals’ well-being and the economic proxy for well-being, money income, such that willingness to pay for the stream of services will change.
A concerted attempt was made to estimate the economic benefits of environmental improvements in the Baltic. A total of 14 empirical valuation studies in three countries — Poland, Sweden, and Lithuania — were carried out to look at benefit estimation issues. These included the total eco-nomic value of reducing the effects of eutrophica-tion, as well as sub-components of this total value such as beach recreation benefits, existence and option values of preserving species and their habi-tats, and the benefits from preserving and restor-ing wetlands. Of the applied studies that have been done in the different countries, some of them have focused on similar valuation issues, thus enabling a comparative evaluation of the studies to be carried out between the differing economic, cultural and political systems. We also have con-sidered the question of total basin-wide benefit estimates and benefits transfer. Whilst the studies outlined here provide a large amount of informa-tion about the value of the Baltic’s resources, there are still gaps in our knowledge of total basin-wide benefit estimates. Nevertheless, the es-timates that are available indicate the significant value of the limited number of resource types considered.
The full results of all the studies are presented in Georgiou et al. (1995). Here we present the results of two of the studies carried out in Poland and Sweden which looked at the use and non-use value of reducing eutrophication to a sustainable level. These two studies were used to estimate basin-wide benefits.
The eight-page questionnaire is presented in detail in So¨derqvist (1995). It contained, inter alia, summary information on the causes and effects of eutrophication of the Baltic Sea. In the valuation scenario, the respondents were asked to assume that an action plan against eutrophication had been suggested, and that this action plan would imply that the eutrophication in 20 years would decrease to a level that the Baltic Sea can sustain. The types of action that this plan would involve were briefly described. It was also explained that the way to finance the actions would be to intro-duce an extra environmental tax in all countries around the Baltic Sea.
The respondents then met the following ques-tion: ‘‘If there were a referendum in Sweden about whether to launch the action plan or not, would you vote for or against the action plan if your environmental tax would amount to SEK X per year during 20 years?’’. Seven different amounts of money, X, were randomly used for the ques-tion. The answers to the question give an estimate of mean annual Willingness To Pay (WTP) of about 5900 SEK per person (or 3300 SEK if we assume non-respondents to the survey have a zero willingness to pay).
It is likely that the respondents considered use values as well as non-use values when they an-swered the WTP question. This means that the WTP reflects perceived total benefits. However, note that there may be important differences be-tween perceived benefits and real benefits. One reason for this is that the information communi-cated to the respondents about the eutrophication and its effects was far from complete. Moreover, the results from this CVM study may be influ-enced by embedding phenomena, i.e. that the respondents have also considered their WTP for other environmental improvements, and not only for a reduction of eutrophication. Embedding is a recognised problem in CVM studies. Note also that it is not easy to relate the outcome in the valuation scenario — a reduction of the eutrophi-cation to a level that the Baltic Sea can sustain — to a specific reduction of the nutrient load (though such an outcome is probably consistent with the 50% nutrient reduction target adopted by the Helsinki Commission). A time horizon of 20
years is reasonable in the sense that even if con-siderable action is taken today, it takes many years until any results will be evident. The de-scription of the outcome as a ‘sustainable’ level reflects the fact emphasised by ecologists that actions against eutrophication will probably result in neither the complete disappearance of eutrophi-cation, nor a return to the same ecological situa-tion that characterised the Baltic Sea some decades ago, but rather to some new equilibrium. The second study was almost identical to the first, except that it was carried out in Poland, thus providing a direct international comparison to be made between the benefit estimates found in both countries. Again a mail questionnaire was used and 600 questionnaires were sent out to a random sample of Polish adults. The response rate was just above 50% which was considered reasonable for this context and location. It was found that the level of support for the environmental tax was 54.9%. Mean annual willingness to pay per person for the action plan was 840 SEK (or 426 SEK if we assume non-respondents to the survey have a zero willingness to pay).
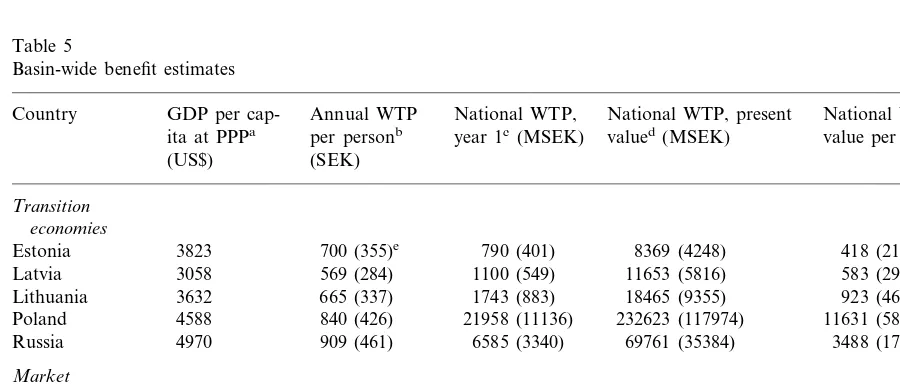
In order to calculate basin-wide benefit esti-mates we need to add up the values for the different activities carried out, taking care not to double count, and using the relevant correct pop-ulations. Since there are benefit estimates avail-able for the same valuation scenario in only two of the 14 countries that are included in the Baltic drainage basin, any aggregation to the whole basin has to rely on strong assumptions. The aggregate benefit estimates to be presented below should thus not be taken too literally. However, they may give useful information regarding the order of magnitude of basin-wide benefit estimates.
for the transition economies around the Baltic Sea, i.e. Estonia, Latvia, Lithuania, Poland, Russia; and the Swedish mean WTP estimate of 5900 SEK (3300 SEK) is taken as representative of the market economies of Finland, Germany, Norway and Sweden (Table 5). The possible WTP of the population in the other countries included in the Baltic drainage basin (Belarus, Czech Republic, Norway, Slovakia and Ukraine) will be ignored in this analysis.
In order to calculate national WTP estimates, the estimate per person was multiplied by the (adult) population in the Baltic drainage basin part of each country. According to Table 5, the basin-wide estimate for total economic value is SEK 69 310 million per year (SEK 37 892 mil-lion per year). This is a highly uncertain figure, but it indicates that the benefits from a Baltic Sea clean-up of eutrophication may be consider-able.
Table 6 brings together both the costs of pollu-tion abatement and related economic benefit esti-mates in a cost-benefit analysis framework. It is clear that there are considerable net benefits avail-able to a number of Baltic countries, sufficient for them to pay their own clean-up costs and sub-sidise the Baltic republics’ abatement programme, while still gaining increased economic welfare benefits. While the economic benefit calculations are not precise point estimates, they are indicative of the range or order of magnitude of clean-up benefits in the Baltic.
Poland faces the largest cost burden because of its relatively high pollution loading contribution and the modest levels of effluent treatment that it currently has in place.
The costs in Table 6 refer to the allocation of nitrogen reductions that minimises total costs. We note that the reductions, measured in percentages of original loads, vary between 39% (Germany)
Table 5
Basin-wide benefit estimates
GDP per cap- National WTP,
Country Annual WTP National WTP, present National WTP, present
year 1c(MSEK) valued(MSEK)
per personb value per year (MSEK)
ita at PPPa
(SEK) (US$)
Transition economies
Estonia 3823 700 (355)e 790 (401) 8369 (4248) 418 (212)
569 (284) 1100 (549)
Latvia 3058 11653 (5816) 583 (291)
Lithuania 3632 665 (337) 1743 (883) 18465 (9355) 923 (468) 840 (426) 21958 (11136) 232623 (117974)
Poland 4588 11631 (5899)
4970 909 (461)
Russia 6585 (3340) 69761 (35384) 3488 (1769)
Market economies
6770 (3790) 23365 (13080) 247529 (138570) 12376 (6929) Denmark 19306
15483 5430 (3040)
Finland 20387 (11414) 215980 (120920) 10799 (6046)
Germany 18541 6500 (3640) 15800 (8848) 167385 (93736) 8369 (4687) 5900 (3300)
Sweden 16821 39122 (21882) 414458 (231818) 20723 (11591)
Total 130850 (71533) 1386223 (757821) 69310 (37892)
aPPP=purchasing power parity.
bFor the transition economies, the Polish mean WTP estimate of SEK 840 (SEK 426) was multiplied by the ratio between each country’s GDP per capita (at purchasing power parity) and Poland’s GDP per capita at PPP. For the market economies, the Swedish mean WTP estimate of SEK 5900 (SEK 3300) and Sweden’s GDP per capita at PPP were used correspondingly. Source of GDP data: OECD.
cThe annual mean WTP estimates per person multiplied by the (adult) population in the Baltic drainage basin part of the country. dTime horizon: 20 years (specified in the CVM studies). Discount rate: 7% (this rate was also used in the estimation of nutrient reduction costs.
Table 6
Costs and benefits from reducing the nutrient load to the Baltic Sea by 50%, millions of SEK/yeara
Costs Benefits
Country Reduction in % Net benefits
5300
Sweden 42 20 723 (11 591) 15 423 (6291)
Finland 52 2838 10 799 (6046) 7961 (3208)
2962
Denmark 51 12 376 (6929) 9414 (3967)
4010 8369 (4687)
39 4359 (677)
Germany
63
Poland 9600 11 631 (5899) 1761 (−3701)
586 3488 (1769)
Russia 44 2902 (1183)
1529 418 (212)
aFigures in brackets are for benefit figures which assume zero WTP of non-respondents.
and 63% (Poland). If the abatement cost strategy was based not on a cost-effectiveness criterion linked to an overall ambient quality target, but on some ‘political’ solution based, for example, on uniform national load reductions, then aggregate costs would be increased significantly (Table 7). This cost increase is due to the expensive mea-sures that have to be implemented in Germany and Sweden. However, several countries with re-duction levels exceeding 50% in Table 6 will gain from a country restriction as compared to a re-striction of the total load of nitrogen.
The costs presented in Table 6 may also be overestimated because they do not include other environmental improvements associated with these nutrient reductions such as improved ground water quality and less acidification related to nitrogen oxides emissions. It is well known that several of the measures implying land use changes also yield other ecological services. For example, wetlands provide food, biodiversity and flood wa-ter buffering, and energy forestry on arable land provides fuel and may act as a carbon sink. If all these other positive aspects were included, some measures might imply internal net benefits instead of net costs.
The simulation results derived from our mod-elling of nutrient transports in the Baltic Sea provide a proxy for the missing dose-response scientific data. The model simulates the impacts of nutrient reduction on the concentration ratios of N and P but does not provide any detailed
infor-mation on the impacts on the biological condi-tions and production of ecological services. The available model does, however, predict that a 50% reduction in the loads of nitrogen and phospho-rous to the Baltic Sea may correspond to the levels found during 1960s, i.e. before the major deterioration in the Baltic environment occurred. This scenario is likely to be consistent with the one used in the CVM studies. Therefore, a crucial assumption when comparing costs and benefits is that a 50% reduction in the loads of nitrogen and phosphorous imply that we reach ecological con-ditions which resemble those of the Baltic Sea prior to 1960s. Another important assumption
Table 7
Cost change of a move from a 50% reduction in total load to 50% reduction in the load of each country, in percenta
Region Nitrogen reduc- Phosphorous reduc-tion
tion
Sweden −57.8 361.8
−51.9
Finland 718.1
Denmark −48.8 29.1
Germany 543.6 32.1
St. Petersburg −80.0
Kaliningrad 779.4 −81.6
concerns the nutrient filtering capacity of differ-ent Baltic Sea coasts, which is likely to vary a lot. There is, however, no appropriate data on the coasts’ filtering capacity. Therefore, no dis-tinction has been made between different coastli-nes. Given all these qualifying assumptions, estimated costs and benefits of an overall reduc-tion in the nutrient loads by 50% for different countries are as presented in Table 7. Note that Belarus, Czech Republic, Norway, Slovakia and Ukraine are excluded, since these countries were excluded from the cost estimation work.
8. Policy implications
There is considerable merit in the adoption of a basin-wide approach to pollution abatement policy in the Baltic and therefore in the imple-mentation of an integrated coastal zone manage-ment strategy. It is clear that the ambient quality of the Baltic Sea is controlled by the coevolution of both biophysical and socio-eco-nomic systems throughout the macro-scale drainage basin.
Despite the pioneering nature (i.e. in the ‘transition’ economies) of some of the economic benefits research, there seems to be little doubt that a cost-effective pollution abatement strategy roughly equivalent to the 50% nutrients’ reduc-tion target adopted by the Helsinki Commission would generate significant positive net economic benefits (benefits minus costs). The research into the monetary valuation of environmental benefits also indicated that the public’s and ex-perts’ perception of environmental quality and quality decline are not necessarily synonymous.
A policy of uniform pollution reduction targets is neither environmentally nor economi-cally optimal. Rather, what is required is a dif-ferentiated approach with abatement measures being concentrated on nutrient loads entering the Baltic Proper from surrounding southern sub-drainage basins. The northern sub-drainage basins possess quite effective nutrient traps and contribute a much smaller proportionate impact on the Baltic’s environmental quality state. The countries within whose national jurisdiction these southern sub-basins lie are also the biggest
net economic gainers from the abatement strat-egy.
Although there are a range of feasible individ-ual N-reduction and P-reduction measures avail-able, our research indicates that the simultaneous reduction of both N and P load-ings into the Baltic is more environmentally ef-fective as well as cost efef-fective. The increased deployment of N-reduction and P-reduction measures within existing sewage effluent treat-ment works, combined with coastal wetland cre-ation/restoration schemes and changes in agricultural practice, would seem to be a partic-ularly cost-effective option set.
The marginal costs of nutrient reduction mea-sures increase sharply towards the full works treatment end of the spectrum. This finding sug-gests that the greatest environmental and eco-nomic net benefits are to be gained by an abatement policy that is targeted on areas which lack treatment works of an acceptable standard, rather than on making further improvements to treatment facilities that already provide a rela-tively high standard of effluent treatment. This finding, combined with our findings relating to the importance of the spatial location of nutri-ent loading, suggests that nutrinutri-ent reduction measures in the Polish and Russian coastal zone areas would be disproportionately effective. The financing of such measures remains problematic if only ‘local’ sources of finance are to be de-ployed. Non-commercial funding from the Eu-ropean Commission and other international agencies, together with bilateral agreements, could play a vital role in the enabling process for an effective and economic Baltic clean-up programme.
Acknowledgements
References
Barrett, S., 1995. Institutional analysis. In: Turner, R.K., Gren, I.-M., Wulff, F. (Eds.), The Baltic Drainage Basin Report: EV5V-CT-92-0183. European Commission, Brus-sels Ch. 8.
Folke, C., Langass, S., 1995. Land use, nutrient loads and damage in the Baltic Sea. In: Turner, R.K., Gren, I.-M., Wulff, F. (Eds.), The Baltic Drainage Basin Report: EV5V-CT-92-0183. European Commission, Brussels Ch. 2. Folke, C., Hammer, M., Jansson, A.-M., 1991. Life-support value of ecosystems: a case study of the Baltic Sea region. Ecol. Econ. 3, 123 – 137.
Georgiou, S., Bateman, I.J., So¨derqvist, T., Markowska, A., Zylicz, T., 1995. Benefits valuation. In: Turner, R.K., Gren, I.-M., Wulff, F. (Eds.), The Baltic Drainage Basin Report: EV5V-CT-92-0183. European Commission, Brus-sels Ch. 7.
Gren, I.-M., 1995. Cost effective nutrient reduction to the Baltic Sea. In: Turner, R.K., Gren, I.-M., Wulff, F. (Eds.), The Baltic Drainage Basin Report: EV5V-CT-92-0183. Eu-ropean Commission, Brussels Ch. 6.
Gren, I.-M., Elofsson, K., Jannke, P., 1995. Costs of nutrient reductions to the Baltic Sea. Beijer International Institute of Ecological Economics, Royal Swedish Academy of Sci-ences, Stockholm. Beijer Discussion Paper Series No. 70. Howarth, R.W., Billen, G., Swaney, D., Townsend, A.,
Ja-worski, N., Lajtha, K., Downing, J.A., Elmgren, R., Caraco, N., Jordan, T., Berendse, F., Freney, J., Kude-yarow, V., Murdoch, P., Zhu, Z.L., 1996. Regional nitro-gen budgets and riverine N-and-P fluxes for the drainages
to the north atlantic ocean — natural and human influ-ences. Biogeochemistry 35, 75 – 139.
Jansson, A,., Folke, C., Langaas, S., 1999. Quantifying the nitrogen retention capacity of natural wetlands in the large scale drainage basin of the Baltic Sea. Landscape Ecol. (in press).
Nehring, D., Hansen, H.P., Hannus, M., Jo¨rgensen, L.A., Ko¨rner, D., Mazmatchs, M., Perttila¨, M., Wulff, F., Yurkovskis, A., Rybinski, J., 1990. Nutrients. Ambio 7, 5 – 7 Special Report, September.
So¨derqvist, T., 1995. The benefits of reduced eutrophication of the Baltic Sea: a contingent valuation study. Stockholm School of Economics and Beijer International Institute of Ecological Economics, Stockholm (mimeo).
Sweitzer, J., Langaas, S., 1994. Modelling population density in the Baltic states using the digital chart of the world and other small data sets. In: Proceedings from EUCC/WWF Conference on Coastal Conservation and Management in the Baltic Region, May 2 – 8, Klaipeda, Lithuania. Depart-ment Systems Ecology, Stockholm University, Stockholm. Sweitzer, J., Langaas, S., Folke, C., 1996. Land use and population density in the Baltic Sea drainage basin: a GIS database. Ambio 25, 191 – 198.
Turner, R.K., Gren, I.-M., Wulff, F., 1995. The Baltic Drainage Basin Report: EV5V-CT-92-0183. European Commission, Brussels.
Wulff, F., 1995. Natural systems state. In: Turner, R.K., Gren, I.-M., Wulff, F. (Eds.), The Baltic Drainage Basin Report: EV5V-CT-92-0183. European Commission, Brussels Ch. 3. Wulff, F., Niemi, A., 1992. Priorities for the restoration of the Baltic Sea — a scientific perspective. Ambio 21 (2), 193 – 195.
.