Experimental Investigation of the Effects of Reverse Bending and
Straightening Process on Carbon Steel Bars used for Civil
Engineering Applications
Adewole, K. K.
1and Bull, S. J.
1Abstract: This paper presents an experimental investigation of the effects of reverse bending and straightening process on the mechanical properties of a typical carbon steel bar used for civil engineering applications. Twenty four specimens each were used for the metallogarphy, microhardness and tensile tests. The investigation revealed that the reverse bending and
straightening process has no significant effect on the bars’ through-thickness microstructure and
hardness. However, the reverse bending and straightening process reduces the yield load, ultimate load, and displacement at fracture of the bars by 4.27%, 2.58%, and 18.62% respectively. These results highlight the need to take into consideration the effects of the previous loading history of the bars/wires, particularly the reduction in the displacement at fracture and consequently, the ductility of the bars/wires in the design and fitness for purpose assessment of components made from them, since the bars/wires could experience high strain during installation and in service due to overloads.
Keywords: Carbon steel bars, hardness, microstructure, reverse bending and straightening, tensile property.
Introduction
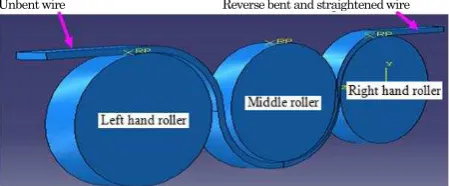
Carbon steel wires and bars are steel elements or materials with sizes from 2.5 mm to 8 mm and 10 mm to 32 mm respectively [1]. Carbon steel wires and bars are used as pre-stressing steel and suspen-sion bridge wires/bars. They are also incorporated into flexible pipes used for offshore oil and gas transportation to resist longitudinal and hoop stress-es which the pipstress-es experience during installation and in service. As a quality assurance check, the wires and bars are subjected to a reverse bending and straightening test to detect laminations in the wires/bars. Laminations are elongated line type defects or long cracks which represent a material separation or discontinuity that are usually parallel to the surface of metal products produced through rolling or drawing processes and are normally invisible at the surface [2]. The reverse bending and straightening test [Figure 1] is typically conducted by bending the wire/bar over the left hand roller.
1 School of Chemical Engineering and Advanced Materials, New-castle University, NewNew-castle upon Tyne, UNITED KINGDOM, NE1 7RU, E-mail: [email protected], [email protected], Tel: +2348092540024.
Note: Discussion is expected before June, 1st 2014, and will be
published in the “Civil Engineering Dimension” volume 16, number
2, September 2014.
Received 19 January 2014; revised 12 February 2014; accepted 17 February 2014.
The bent wire/bar is then subjected to reverse bending over the middle roller, and finally, the reverse bent wire/bar is straightened over the third roller. For wires and bars of thicknesses of a few millimetres, the roller diameter is typically about 100 mm.
During the reverse bending and straightening operation, the upper part of the wire/bar is sub-jected to tensile bending stress during bending, followed by a compressive bending stress during reverse bending, and finally, to a tensile bending stress during straightening. Similarly, the reverse bending and straightening operation subjects the lower part of the wire/bar to a compressive bending stress during bending, followed by a tensile bending stress during reverse bending, and finally, to a compressive bending stress during straightening. Consequently, the upper and the lower parts of the wire/bar experience high bending stresses and a different double stress/strain reversal (i.e. during the reverse bending and straightening operations).
Unbent wire Reverse bent and straightened wire
This difference in mechanical history may affect the performance of the wire in service. Given this obser-vation, the industry requires an understanding of the effects of the high bending stresses and the double stress/strain reversal on the wires/bars.
The published experimental work on reverse bending of wire rod by Gillstrom and Jarl [3], investigated the effectiveness of the use of the reverse bending process for mechanical descalling of
wire rods. To the best of the authors’ knowledge,
neither the experimental work on the effects of the reverse bending of wires nor the experimental work on the effect of the reverse bending and straighte-ning of wires on their mechanical properties, parti-cularly, their tensile properties has been published. In this paper, an experimental investigation of the effects of the reverse bending and straightening process on a typical carbon steel bar for civil engineering applications used as tensile load support is presented. The investigation covered the effects of the reverse bending and straightening process on the microstructure, hardness, and the tensile properties of the bars. Details of the experimental work are presented in the following section.
Experimental
Details of the bending, reverse bending and the straightening of the bar specimens and the
labora-tory preparation of the tensile, metallography and
hardness specimens are presented in this section. The laboratory investigations were conducted on 12x5 mm2 cross-sectional dimensions bars supplied by the bars’ users. The bars have rounded edges
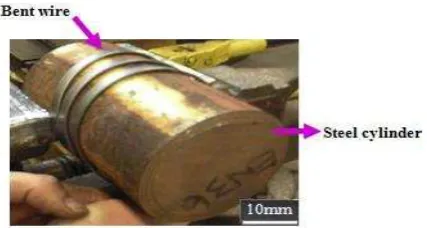
introduced during manufacture but were not finished in any way before testing. Six 1400 mm long cut lengths of the bars were subjected to reverse bending to produce the reverse bent specimens, and another six 1400 mm long cut lengths were subjected to reverse bending and straightening to produce the reverse bent and straightened specimens. The reverse bent specimens were produced by bending the six 1400 mm long cut lengths round a100 mm diameter cylindrical steel as shown in Figure 2 and reverse bending of the bent cut lengths round the same 100 mm cylindrical steel followed by the straightening of the reverse bent cut lengths.
Figure 2. Experimental Simulation of Reverse Bending of
Details of the bending, reverse bending, reverse bending and straightening treatments given to the bar cut lengths are shown in Table 1.
Twenty four (four from each cut lengths) 170 mm long, 50 mm gauge length tensile test specimens were then cut out of the reverse bent and straightened bar cut lengths. Twenty four 170 mm long, 50 mm gauge length tensile test specimens were also cut out of the as-received unbent bars. All the tensile test specimens cut from the reverse bent and straightened bars and from the as-received unbent bars hereinafter referred to as the reverse bent and straightened bar specimens and the unbent bar specimens respectively, were subjected to tensile testing.
Forty eight 20 mm long bar specimens (length in the rolling direction of the bar) were also cut out of the reverse bent, and the reverse bent and straightened bars. Twenty four of the forty eight 20 mm long bar specimens were used for metallography test and the remaining twenty four were used for the hardness test. The metallography and hardness tests were conducted to investigate the effects of the reverse bending, and reverse bending and straightening
treatments/processes on the bars’ through thickness
microstructure and hardness. Details of the number of test specimens employed for the tensile, metal-lography, and hardness tests are presented in Table 2 and details of the three tests are presented in the following sections.
Tensile Testing Techniques
Tensile tests were conducted at an ambient tempera-ture of 20°C and a relative humidity of 38% on un-machined full cross section [4,5], unbent and reverse bent and straightened bar specimens; a test sample is shown in Figure 3. The tension tests were con-ducted at a cross head speed of 5 mm/minute with an Instron universal testing machine series IX 4505 fitted with an Instron 2518 series load cell with a maximum static capacity of ±100 kN. An Instron 2630 -112 clip on strain gauge extensometer with a
50 mm gauge length was used for the displacement
measurement.
Metallography Techniques
was carried out using a µEye digital camera attach-ed to a Nikon Eclipse LV150 reflectattach-ed light micros-cope. The images were captured using Buehler OmniMet software.
Hardness Testing Techniques
The through-thickness microhardness profiles of the 20 mm long, 5 mm thick specimens of the unbent, reverse bent, reverse bent and straightened bar were measured using a Buehler MMT-7 digital micro-hardness tester fitted with a Vickers diamond indenter. The measurements were performed using a test load of 200 gf (1.96 N) and the hardness is quoted in Vickers Units (HV=kgmm-2).
A JVC colour video camera was used to photograph the indents at 400x magnification and the corres-ponding hardness values were calculated using the Buehler OmniMet HMS software, which is a cali-brated image analysis package.
Results
For confidentiality purposes (nondisclosure agree-ment on the tensile properties of the bars made with
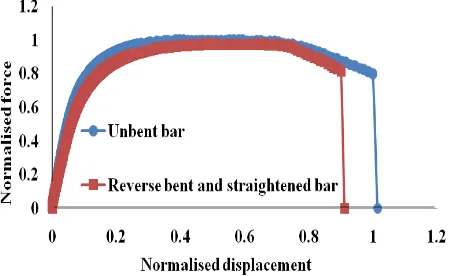
the bars’ supplier), the force-displacement curves in
this paper are normalised by the ultimate load and displacement at fracture of the unbent bar. Variation of test results between different samples was small (a few percent with standard deviations of 0.30, 0.34, and 0.41 in the yield, ultimate, and the displacement at fracture of the bars) and the force displacement-curves from the sample with properties closest to the mean are used in the plot in Figure 4. The through-thickness micrographs obtained from the unbent, reverse bent, and reverse bent and straightened bar specimens are presented in Figures 5, 6, and 7.
The through-thickness microhardness profiles of the unbent, reverse bent, and reverse bent and straight-tened bar specimens are shown in Figure 8. In Figure 8, the number 0 (zero) on the depth axis
represents the bar’s mid-thickness, while 0 to 2.5 mm and 0 to -2.5 mm represent the upper and the lower parts of the 5 mm thick bar respectively.
Figure 3. Un-machined Full Size Bar Specimen
Figure 4. Normalised Force-displacement Curves from Unbent and Reverse Bent and Straightened Bar Speci-mens.
Table 1. Bending, Reverse Bending and Straightening Treatments Given Bar Specimens
Specimen type Number of 1400mm cut lengths
Treatment/processing
Bending Reverse bending Straightening after reverse bending
Unbent specimens 6 No No No
Reverse bent specimens 6 Yes Yes No
Reverse bent and straightened specimens 6 Yes Yes Yes
Tabel 2. Number of Specements for each Tests.
Type of test Number of
specimens Source
Tensile testing of unbent bars 24 Unbent/as-received bar cut length Tensile testing of reverse bent and
straightened bars
24 Reverse bent and straightened bar cut lengths
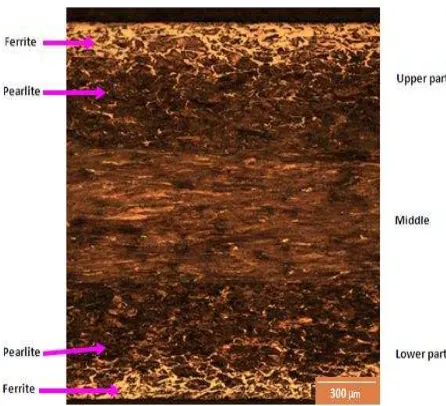
Figure 5. Through-thickness Micrograph of Unbent Bar
Figure 6. Through-thickness Micrograph of Reverse Bent Bar
Figure 7. Through-thickness Micrograph of Reverse Bent
Figure 8. Through-thickness Microhardness Profiles
Discussion
Figure 4 shows that the reverse bending and straightening process reduces the yield load, the ultimate load and the displacement at fracture (i.e. the ductility) of the bars by 4.27%, 2.58%, and 18.62% respectively. As stated in the introduction section, the bar experiences double strain reversal during the reverse bending and straightening process and the reduction in the yield load of the bar could be due to the Bauschinger effect associated with the double strain reversal the bar is subjected to. The Bauschinger effect is the phenomenon res-ponsible for the reduction in the yield strength of a metal subjected to strain reversal [6]. Dislocations generated during the tension part of the loading cycle are easier to move in the opposite direction once the load reversal takes place and the generation of many new dislocations is not required to accommo-date the required deformation. The reduction in the ultimate load of the bar could be due to a reduction in the thickness of the bar as a result of thinning of the wires due to necking of the outer surfaces of the bar caused by high back tension and stretching of the outer fibres during bending, reverse bending and straightening operations.
amount of plastic deformation the reverse bent and straightened wire could undergo was due to the reduction in the total mobile available dislocations, as work hardening has tied up many of those that were available [8,9].
The reduction in the displacement at fracture and
consequently the reduction in the bars’ ductility
highlight the need to take into consideration the effects of the previous loading history of the bars during the design and integrity assessment of bars and bar-reinforced structures. This is due to the fact that the reduction in the ductility could threaten the integrity of the bars and bar-reinforced structures. For the bars considered in this work in particular, the reduction in the ductility of the bars will reduce the ability of the bars to withstand high strain during installation and high strain due to overloads the components made from them could experience in service.
From the micrographs in Figures 7, there is no significant difference in the microstructure of the unbent, reverse bent, and reverse bent and straigh-tened bar specimens. The micrographs show that the outermost layers (upper and lower surfaces) of the bar contain mostly ferrite, which are the white areas of the micrographs, while below the surfaces and throughout the middle of the bar contain mostly pearlite which is the dark areas of the micrographs. This is evidence of decarburisation during bar manu-facture and means that the surfaces of the bar are easier to plastically deform and work harden. The grains in the middle of the bar are elongated in the rolling/drawing direction. From the predominant presence of pearlite across the bar thickness except at the upper and lower surfaces, which contains mainly ferrite, the bar can be described as pearlitic.
The through-thickness microhardness profiles shown in Figures 7 shows that there is no significant difference in the through-thickness microhardness of the unbent, reverse bent, and reverse bent and straightened bar specimens. It also shows that the hardness of the bar is not uniform across its thick-ness with a 57HV0.3, 61HV0.3, and 83HV0.3 difference in the hardness values between the softest and the hardest parts of the unbent bar, reverse bent, reverse bent and straightened bar specimens respec-tively. Generally, the hardness value of the middle part of the bar is higher than that of the outer surfaces. This could be attributed to the fact that the middle part of the bar which consists of pearlite, is harder than the decarburised outer surfaces which are predominantly ferrite.
Conclusion
In this paper, an experimental investigation of the effects of the reverse bending and straightening process on the tensile properties, microstructure and the hardness of typical carbon steel wires used for civil engineering applications as tensile armour members is presented. The investigation revealed that the reverse bending and straightening process
has no significant effect on the bars’ through
-thick-ness hard-thick-ness and the bar’s through-thickness
References
1. Sengupta, A. K. and Menon, D., Pre-Stressed Concrete Structures, Indian Institute of Techno-logy, Madras, http://nptel.iitm.ac.in/courses/ IITMADRAS/PreStressed-Concrete-Structures/ pdf/1_Introduction/1.7_Prestressing_Steel.pdf, assessed on 25/09/2012.
2. Smith, B.O., Jenning, A.P.H., and Grimshaw, A.G., A Portable Lamination Detector for Steel Sheet, The British Iron and Steel Research Association, Battersea Park Road, London, 1957.
3. Gillstrom, P. and Jarl, M., Mechanical Descaling of Wire Rod using Reverse Bending and Brush-ing, Journal of Materials Processing Technology, 172, 2006, pp. 332-340.
4. ASTM E8M., Standard Test Method for Tension Testing of Metallic Materials, American Society for Testing of Materials, 2009.
5. BS EN 10002-1, Tensile Testing of Metallic Materials. Method of Test at Ambient Tempera-ture, British Standards Institutes, 2001.
6. Takeda, T. and Chen Z. Yield Behavior of Mild Steel after Prestraining and Aging under Reversed Stress. Metallurgical and Materials Transactions A, 30, 1999, pp. 411-416.
7. Han, K., Van Tyne, C.J., and Levy, B.S., Effect of Strain and Strain Rate on the Bauschinger Effect Response of Three Different Steels, Metal-lurgical and Material Transactions A, 36, 2005, pp. 2379-2384.
8. Terada K., Matsui, K., Akiyama, M., and Kuboki T., Numerical Re-examination of the Micros-cale Mechanism of the Bauschinger Effect in Carbon Steels, Computational Material Science, 31, 2004, pp. 67-83.
9. Boger, R.K., Wagoner, R.H., Barlat, F., Lee, M.G., and Chung K., Continuous Large Strain Tension/Compression Testing of Sheet Material, International Journal of Plasticity, 21, 2005, pp. 2319-2343.