THE EFFECT OF GOOD AGRICULTURE PRACTICES (GAP) ON
SOYBEAN PRODUCTIVITY WITH COBB-DOUGLAS PRODUCTION
FUNCTION ANALYSIS IN KULON PROGO REGENCY
Pengaruh ‘Good Agriculture Practices’ (GAP) Terhadap Produktivitas Kedelai
dengan Pendekatan Fungsi Produksi Cobb-Douglas di Kabupaten Kulon Progo
Fitry Purnamasari, Lestari Rahayu Waluyati, Masyhuri Faculty of Agriculture, Universitas Gadjah Mada
St. Flora-Bulaksumur, Yogyakarta [email protected]
Diterima tanggal : 21 Juli 2017 ; Disetujui tanggal : 17 September 2017 ABSTRACT
This study aims to determine the level of adoption of Good Agriculture Practices (GAP) and the inluence of GAP and other factors of production on soybean productivity. The number of respondents in this research was 50 farmers taken by random sampling. This research used proportional parameter test and multiple linear regression analysis with Ordinary Least Square (OLS) method. This research has been declared valid, reliability, data have been the normal distribution, free from multicollinearity and heteroscedasticity problem. The result of the analysis shows that (1) the adoption rate of GAP of soybean farmers in Kulon Progo Regency is categorized as a high category. Farmers adopted 83,07% of the overall GAP portion of input, land preparation, planting, fertilizing, crop protection, irrigation, harvesting, and post-harvest. (2) The result of the R2test shows that 47,8% variation of soybean productivity can be explained by the eight independent variables and the remaining is explained by variables outside the model. F test results show that the independent variables together affect the productivity of soybeans. The result of t test shows that Seed, manure, Gandasil fertilizer, GAP adoption rate signiicantly positive and NPK fertilizer signiicantly negatively affect soybean productivity.
Keywords : Cobb-Dauglas, GAP, Productivity, Soybean INTISARI
menunjukkan bahwa 47,8% variasi produktivitas kedelai dapat dijelaskan oleh kedelapan variabel independen dan sisanya dijelaskan oleh variabel diluar model. Hasil Uji F menunjukkan bahwa variabel independen secara bersama-sama berpengaruh terhadap produktivitas kedelai. Hasil Uji t menunjukkan bahwa benih, pupuk kandang, pupuk Gandasil, tingkat adopsi GAP secara signiikan berpengaruh positif dan pupuk NPK secara signiikan berpengaruh negatif terhadap produktivitas kedelai.
Kata Kunci : Cobb-Dauglas, GAP, Kedelai, Produktivitas
is 32,796 tons), South Sulawesi 6.20% (average production is 38,036 tons), and DI Yogyakarta 2.26% (average production is 13,886 tons) (Badan Pusat Statistik, 2016). Kulon Progo Regency is one of the soy-producing districts in Yogyakarta besides Gunungkidul and Sleman. Soybean crop is used as a crop after rice plant. Soybean production is still low.
Low soybean production is caused by several things, which are: (1) lack of land allocation deinitively and speciically intended for soybean production systems; (2) high risk farming of soybean, low productivity and low income of soybean farming; (3) the subject of soybean farming is a traditional farmer with a small scale; (4) the adoption of production technology is slow; and (5) the data of harvested area is less accurate, often biased and soybean production enhancement program is not focused on the expansion of new areas (Sumarno and Adie, 2010).
According to Alimmoeso (2008), quoted by Zakaria (2010) suggested that the increase in soybean production could be done with the expansion of planted area, INTRODUCTION
Soybean which the latin name is Glycine max (soybean yellow); Glycinesoja (black soybean) is a versatile plant. One of the important food commodities for Indonesia after rice plant and maize is soy. The average demand for soybean in Indonesia annually is ± 2.2 million tons of dry seeds. Meanwhile, according to BPS data in 2015 showed that production only reached 963,099 tons, while the rest is imported from other countries.
the increasing in productivity, production security and institutional strengthening.
A good guidelines for the cultivation of food crops/ Good Agriculture Practices (GAP) was published as a guideline in carrying out the cultivation of food crops correctly and properly, with the expectation it will be obtain a high productivity, good product quality, maximum profitability, environmental friendliness and attention to security aspects, health and welfare of farmers and sustainable production efforts. The legal basis of GAP in Indonesia for food crops regulated in Ministry of Agriculture Regulations Number 48/ Permentan/ OT.140/ 10/2006.
Setiawan et al (2015) in his research about GAP (Good Agriculture Practice) implementation of pepper and the effect on pepper productivity has significant influence accumulatively. Bayramoglu, et al(2010) EurepGAP certified tomato producers gained higher output and gained 2.8 times more net proit than non-certiied EurepGAP.
Soybean productivity also affected by other factors of production besides GAP. Production factors is known as the term inputs, production factors and production sacriice. Production factors determinethe size of production, whether it is big or small. In various experiences indicate that the land as production factors, the capital to buy seeds, fertilizer, medicine, labor and management aspects are the
most important production factors. The relationship between production factors (input) and production (output) is usually called as production function or referred to the relationship factor (Isnowati, 2014). Soekartawi (1990), quoted by Rahayu (2010) states that the use of production factors such as land, labor, capital (fertilizers, seeds and medicines) plays an important role in farming activity. In agricultural development, inaccuracy of number and combination for production factors produce a low production result or high cost of production which makes farmer income is low.
The purpose of this study is to determine the level of GAP adoption on soybean commodity in Kulon Progo Regency and the effect of GAP and soybean production factors on productivity.
METHODS
This research used secondary and
primary data to get the data. Secondary data was a data obtained from literature
and a reference document from related
institutions. Primary data obtained directly
from farmers used a questionnaire by
interview. The number of respondents
in this research was 50 farmers taken by
random sampling. An instrument that was
given to the farmer respondents should
be analyze its validity and reliability in
advance used SPSS 16.0, so the data
instrument was said to have good validity
if it can measure accordingly. Validity
(questionnaire) was calculated with the
formula fromproduct moment correlation (Pearsons correlation) as follows:
Description:
r xy = coeficient of correlation per item N = Number of respondents
X = Score per item / items Y = Total Score
Product Moment Correlation then compare correlation number with critique numbers from table correlation r which is its value should be at certain degree (5%). If the correlation number is greater than the igures in the table r = 0.632, then the item is declared as valid question.
Reliability test is the consistency of a measuring instrument that shows the extent to which the measuring instrument is trustworthy or reliable when used repeatedly. To measure the reliability of research instrument, it will be carried out statistical tests Cronbach’sAlpha. The suggested value ofCronbach’s Alphais ≥ 0.6.
Likert scale is used to measure the adoption level of GAP, then it use parameter proportion test as follows.
Description:
P = Percentage of adoption rate of observations
P0 = Percentage of adoption rate (at 0.50) N = Number of Samples
To determine the factors that affect the soybean productivity in Kulon Progo Regency it can use the multiple regression analysis with Ordinary Least Square method (OLS). The model use the equation of Cobb-Douglas function as follows:
Ln Yq = ln α + b1lnx1 + b2lnx2 + b3lnx3 + b4lnx4 + b5lnx5 + b6lnx6 + b7lnx7 + b8lnx8 + μ
Description:
YQ = Soybean Productivity (Kg/ Ha) a = value of the constant
b1,b2,b3,b4,b5 = regression coeficient x1 = Land (Ha)
x2 = Seeds (kg/Ha)
x3 = NPK Fertilizer (kg/Ha) x4 = Manure (kg/Ha)
x5 = Gandasil Fertilizer (gram/ha) x6 = Pesticides (liters / ha)
x7 = Labor (HOK / ha)
x8 = GAP Adoption Rate (score) μ = mistake factor
Classical Assumption Test
multicollinearity and heterocedasticity) should be done.
Normality test analyze use the Jarque-Bera (JB). This test was based on the coeficient of kurtosis (kurtosis and coeficient slope or skewness). The formula Jarque Bera as follows.
The formula above contain n as sample size, S describesthe slope and K expresses the wedge. This test compared the statistics Jarque-Bera (JB) with a value from Table. If the value of Jarque-Bera (JB) ≤ Table then the residual value has normal distribution.
Multicollinearity is a condition which hasliniear relationship between independent variables. Multicollinearity can be seen from the value of tolerance and the opponent of Variance Inlation Factor (VIF). If the value of tolerance ≤ 0,10 or VIF ≥ 10, then there is a multicollinearity and otherwise (Ghozali, 2012).
Heterocedasticity test conducted to determine whether there is the same distribution of the residual variance. If the probability values in Obs*R-Squared >critical value (α), then H0is accepted, it means there is no heterocedasiticity and otherwise.
Statistic Test
Statistic test includes testing the coeficient of determination (R2), F test and
t test. The coeficient of determination (R2) describes how much percentage of the total
variation in the dependent variable could
be explained by the model, the greater the
R2 the greater inluence in explaining the dependent variable models. R2 values has range from 0 to 1, an R2 of 1 means there is a perfect match, while the value 0 indicates no
relationship between the dependent variable
with the variables explained. Therefore, the
value of R2which is close to 1, means the closer of its model’s ability to explain the
dependent variable, and otherwise.
F statistic test determine the effect
of simultaneous independent variable on dependent variable whether it is signiicant or not. The t-test is used to determine the
effect of independent variable partially
towards dependent variable.
RESULTS AND DISCUSSION
Adoption Level of Good Agriculture Practices (GAP)
it means the variables are reliable and consistent (reliable).
Respondents were grouped into three categories, they are low, moderate and high of adoption level based on total score in each scope. The number of items which were used to measure the level of adoption of GAP has 57 statement divided into 7 scope. Each statement is adjusted to the Regulation of the Minister of Agriculture Number 48/ Permentan/ OT.140/ 10/2006 about thegood guidelines for cultivation of food crops.
The Table 2 shows that the average score for input is 2.65 (88.53%) means that farmers are adopting about 88.53% of the overall input. The average score of land preparation is 2.46 (81.52%), planting is 2.08 (69.33%), fertilizing is 2.43 (80.91%), plant protection is 2.45 (81.61%), irrigation is 2.66 (88.66%), harvest and post harvest are 2.78 (92.66%). While the total adoption of GAP had an average score of 2.49 (83.07%) and classify as high category. Farmers distributiontowards the rate of GAP adoption can be seen in Table 3 below. Table 1.The Rate of GAP Adoption for Soybean in Kulon Progo Regency
No. Scope of Adoption Average Score Percentage (%)
1. Input 2.65 88.53
2. Land Preparation 2.46 81.52
3. Planting 2.08 69.33
4. Fertilization 2.43 80.91
5. Plant protection 2.45 81.61
6. Irrigation 2.66 88.66
7. Harvest and Post Harvest 2.78 92.66
Total 2.49 83.07
Source: Primary Data Analysis, 2017
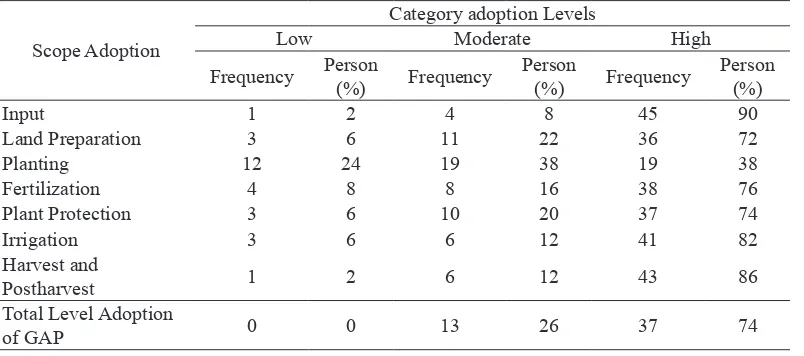
Table 2. Distribution of Soybean Farmers to Adopt GAP
Scope Adoption
Category adoption Levels
Low Moderate High
Frequency Person
(%) Frequency
Person
(%) Frequency
Person (%)
Input 1 2 4 8 45 90
Land Preparation 3 6 11 22 36 72
Planting 12 24 19 38 19 38
Fertilization 4 8 8 16 38 76
Plant Protection 3 6 10 20 37 74
Irrigation 3 6 6 12 41 82
Harvest and
Postharvest 1 2 6 12 43 86
Total Level Adoption
of GAP 0 0 13 26 37 74
The adoption rate is measured using the likert scale of 1 (low), 2 (medium) and 3 (high). Number of statements each is input 10, land preparation 11, planting 5, fertilization 11, plant protection 12, irrigation, harvest and post harvest 5 statement. Categorization is done by subtracting the highest score with the lowest score then divided into three representing each category. Farmers will be categorized according to the number of scores obtained in each scope.
Table 2 above show the total value of GAP for all its scope, most farmer respondents are at high category with 37 people or 74%. While others in moderate category have 13 people or 26% and no farmer who is in low category of GAP adoption.
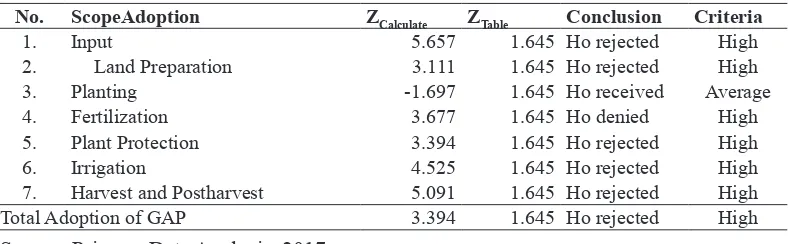
To analyze the hypothesis about GAP adoption level in Kulon Progo Regency, it should analyze the proportion parameter Z with a signiicance level of 0.05. The analysis result of GAP adoption rate for soybean in Kulon Progo Regency can be seen in Table 3.
Table 3 show that among 7 scope of GAP, the others 6 which are inputs, land preparation, fertilization, crop protection, irrigation, harvesting and post harvest have a high adoption rate. While the scope of the planting is in moderate category.
Input
Supply input was important in
soybean cultivation. The inputs in this
research are seed, labor, and equipment
used by the farmers. GAP adoption
achievement levels for the input component
are presented in Table 2. In Table 1 shows
that the percentage of soybean input usage
is 88.53% of all assessment aspect. In Table
2, most farmerswas included in the high
category (90%), moderate (8%) and low
(2%). This is compatible with the statistical
test using parameter proportion analysis stating that H0 is declined because of Z score (5.657)> Z table (1.645) which means that the rate of soybean GAP adoptionis
mostly in the high category.
The most seeds varieties are used
by farmers is 92% for Grobogan and 8% Table 3. Analysis Result of GAP Adoption Rate for Soybean
No. ScopeAdoption Z
Calculate ZTable Conclusion Criteria
1. Input 5.657 1.645 Ho rejected High
2. Land Preparation 3.111 1.645 Ho rejected High
3. Planting -1.697 1.645 Ho received Average
4. Fertilization 3.677 1.645 Ho denied High
5. Plant Protection 3.394 1.645 Ho rejected High
6. Irrigation 4.525 1.645 Ho rejected High
7. Harvest and Postharvest 5.091 1.645 Ho rejected High
Total Adoption of GAP 3.394 1.645 Ho rejected High
for Merapi. Seed pricefor Grobogan is
Rp. 6,000 – 15,000 and for Merapi is Rp.
14,000. Some farmers use seeds from
government and input store around their
residence. Farmers respondents use about
75.46 kg/ ha. The suggestion to use quality
seed with the power to grow> 85%, healthy and clean with the total seed requirement between 40-60 kg/ ha, depending on seed size, the greater of the seedsize, the more seeds were used (Direktorat Jenderal Tanaman Pangan, 2015).Labor value in soybean cultivation in Kulon Progo is 93.52
HOK/ Ha. The labor comes from their
own family and outside of the family. The
wages paid for labor is Rp. 30,000 - Rp.
70,000/ person/ day. This labor is used in
the process of land preparation, planting,
fertilization, plant protection, irrigation and
harvest and postharvest.
Agricultural tools is the input to facilitate the farmers in soybean cultivation. The tools are hoes, water spray, sickle, and thresher. Hoe is used in land preparation and cultivation process as a tool for weeding, sickle is to crop the stem of soybean in harvesting and water sprayto help fertilization and pesticide usage. The thresher is toseparate betweenshell and soybean seeds. Some farmers usethresher and some of them use manual method.
Land preparation
Land preparation is the part of
soybean cultivation. Land preparation is
the irst step in soybean cultivation process. The average of farmers’ land area is 0.23
hectares. Table 1 shows that the average of
GAP implementation for land preparation
section only at 81.52%. The adoption level of GAP for soybean classiied in the high category (72%), moderate (22%), and low
(6%). Test results hypothesis in Table 3
states that H0 rejected because of Z score (3.111)> Ztable (1.645) means that the rate of GAP adoption for soybenmostly is in the
high category.
In Kulon Progo, generally farmers
plant soybeans in land which is used to
plant a rice. According to the rules of the
local government, farmers are encouraged
to make a crop rotation with the pattern
of rice plant-rice plant-soybeans. Farmers usually plant soybean in the ield which is used to planted rice plants becauseit
is difficultfor the farmers to cultivate a new land considering the time and eficiency. However, the canal for drainage is still needed todispose excess water or to
equalize the amount of water. In addition,
land preparation is also done by using rice
straw as mulch replacement which over
laid evenly on the surface of the land. To
increase the soil fertility, farmers also add compost in rice ields which will be planted a soybean.
Planting
only apply approximately 69.33% of GAP’s component of cultivation. Generally, farmers are not doing processing. Farmer planta rice plant directlyin land that has been used for rice plant. Distribution of farmers on the adoption rate of GAP in the cultivation showed that 38% of farmers includein higher categories, the moderate category also having the same percentage, while for lower category has 24%. The statistical result based on calculation of parameter proportion in Table 5.9 shows that Ho is accepted because Z score (-1.697) < Ztable (1.645) means that the rate of GAP-SOP adoption for soybeans mostly include in the moderate category.
Farmers included in the low and moderate category because some farmers do not follow the recommended planting distance of 40x15 cm and 40x10 cm, they only follow the distance of rice planting without any land processing. In addition, some farmers use seeds from previous products instead of seeds that are certiied or labeled.
Soybean planting in Kulon Progo 2016 was conducted in May-June. The planting schedule is set up by local government in order not to disrupt the schedule of the next cropping season. Generally farmers plant for two days after harvesting. The farmers make a hole in the ground following the range which is used to madefor rice plant. Each hole was given two soybean seed. After that, the plant is
covered with rice straw to keep moisture and avoid the pests.
Fertilization
Table 1 shows that the average of farmer only adopt GAP for fertilization component of 80.91%. Farmers in the category is included of High (76%), Moderate (16%) and Low (8%) category. The statistical analysisuse proportional parameters test in Table 5.9, states that H0 is declined because Z score (3.677)> Z table (1.645) means that the rate of GAP adoption for soybean tegolong mostly in the high category.
average use of NPK fertilizer is 107.91 kg/ ha, compost is 2637.74 kg/ ha and Gandasil is 15.19 pack/ ha (100gr/ pack).
Plant Protection
Most of the farmers have been applying GAP for plants protection componentwhich is 81.61% (Table 1). Farmers distributiontowardsadoption rate of crop protection according to Table 2 is in high category 74%, while 20% is for moderate category and 6% is for low category. This is consistent with statistic test results in Table 4 which indicates that H0 is rejectedbecause Z score (3.394)> Ztable (1.645), it means that the adoption rate of GAP for soybeanis mostly in the high category.
Assessment indicators for fertilization include the use of inorganic fertilizers listed or recommended by the government, the use of organic fertilizers derived from plants or animals, the use of appropriate fertilizer quality, time, dose and mode of application, prioritizing the use of organic fertilizers rather than inorganic, spraying fertilizer done without leaving Residue and does not cause pollution and keep the fertilizer in a clean, safe and closed place. Farmers included in the moderate category means that farmers do not routinely carry out plant protection in accordance with assessment indicators.
Crop protection made by farmers is to control pest and disease. Spraying is done only when there are pests to avoid the risk of crop. Spraying usually only done once in
a season. To prevent the growth of weeds, farmers use rice straw to cover the seed in land preparation and planting process. Kind of pesticides which is used include Bassa, Darmabas, Fastac, Extragen, Lannate, and Marshal.
Irrigation
GAP for watering component have been adopted by 88.66% according to Table 1. Farmers distribution towards GAP adoptionis in high category (82%), moderate (12%) and low (6%). While the statistical test results in Table 3 concluded that H0 is rejectedbecause Z score (4.525)> Ztable (1.645) means that the rate of GAP adoption of soybean for irrigation part is included in high category.
Soybean is a plant which is tolerant of dry conditions. However, soybeans require water during the growth period. Four stages of phase on soybean plants that require water is in early growth phase, during lowering, pod formation and seed illing (Adisrwanto, 2008).
Harvest and Post-harvest
heteroskedasticity done to get a good model or qualify multiple linear regresi before analyze with analysis tools Eviews 9.0. Normality Test Results indicate that the Jarque-Bera value is 0.737 with probability 0.609> 0.05 (95% conidence level) which means that the residual distribute normally.
The analysis of multicolliniearityis used to determine whether an independent variable in the regression equation is not correlated with seeing the value of tolerance and the value of Variance Inlation Factor (VIF).
Table 4 shows that the all of the variables that inluence soybean yield has a value of VIF is less than 10, so it can be concluded that the regression model is good because there is no correlation between independent variables problem or Multicollinearity. Heteroskedasticity test is to determine whether there is the same distribution of the residual variance through the analysis of White Heteroscedastisticity.
parameter which concluded that H0 is rejected because Z score (5.091)> Z table (1.645). It means that the level of GAP adoptionfor harvest and post-harvest soybean crop largely classiied in the high category.
Soybean plants which are ready to be harvested is marked by falling leaves (the amount of leaves in the crops are about 5-10%) and 95% yellow pods are yellow. Generally, for Grobogan varieties are harvested in less than 80 days. Harvesting is done by cutting the stem using a sickle. To threshing, the farmer use the Power Treser (threshing machine) and some of them use manual method with a wooden bat. Afterwards, the beans are cleaned and drying for 2-3 days until the moisture content of 10-12% and packed in plastic bags that can last a long time and are not attacked by pests and diseases.
Factors that affect Soybean Productivity Classical Assumption Test
Classical assumption test such as normality test, multicolinearity and
Table 4. Test Results of Multicollinearity
No. Variable Value VIF
1. Land (X1) 4.048
2. Seeds (X2) 1.642
3. NPK Fertilizer (X3) 1.843
4. Manure (X4) 1.729
5. GandasilFertilizer (X5) 1.908
6. Pesticides (X6) 1.710
7. Labor (X7) 3.984
8. GAP Adoption rate (X8) 1.384
Table 5 show that the value of Prob. Chi-Squared at Obs*R Squared is 0.074, greater than 0.1, it means the regression model is homokedasticity or in other words there is no problem assuming non heterokedasticity so it can be concluded that the data for each independent variables in the model have a homogeneous variance.
The result of classic assumption test shows that the data was normally distributed, free of problems for multicollinearity and heteroscedasticity, so it can do a multiple
linear regression analysis to determine the factors that affect the soybean productivity in Kulon Progo
Statistical Test
Hypothesis testing for factors that affect the soybean productivity using multiple linear regression analysis to analyze the coeficient of determination (R2),T test and test F. Signiicance level used in this study is 95% and 90% (α = 5% , α = 10%).
Table 5. Test Results of Heterokedasticity
F-statistic 2.055 Prob. F 0.063
Obs * R-Squared 14.310 Prob. Chi-Square 0.074
Source: Primary Data Analysis, 2017
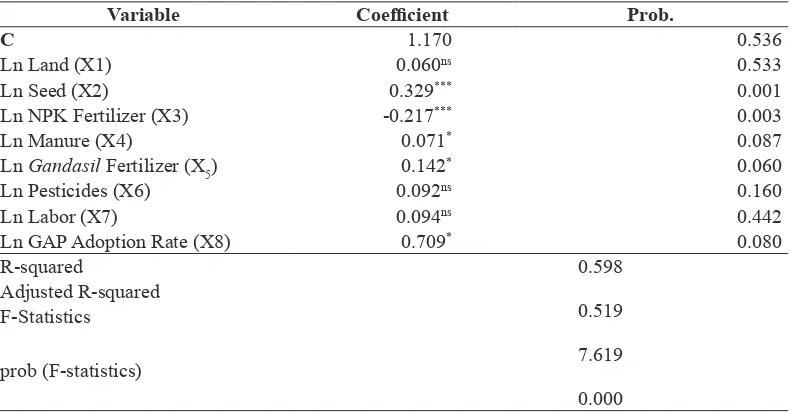
Table 6. Test Results t Factors Afecting Soybean Productivity
Variable Coeficient Prob.
C 1.170 0.536
Ln Land (X1) 0.060ns 0.533
Ln Seed (X2) 0.329*** 0.001
Ln NPK Fertilizer (X3) -0.217*** 0.003
Ln Manure (X4) 0.071* 0.087
Ln Gandasil Fertilizer (X5) 0.142* 0.060
Ln Pesticides (X6) 0.092ns 0.160
Ln Labor (X7) 0.094ns 0.442
Ln GAP Adoption Rate (X8) 0.709* 0.080
R-squared 0.598
0.519
7.619
0.000 Adjusted R-squared
F-Statistics
prob (F-statistics)
Source: Primary Data Analysis, 2017 Description:
Table 6. shows that the result ofAdjusted R-Square dis 0.519, which means 51.9% of the variation of soybean productivity can be explained by the eight independent variables, they are land, seeds, NPK Fertilizer, manure, Gandasil Fertilizer, pesticides, labor and GAP adoption rate. The remaining valueis 48.1% explained by variables outside the model. F test results in Table 6 indicate that the independent variable land, seeds, NPK Fertilizer, manure, Gandasil Fertilizer, pesticides, labor and GAP adoption rate influence towards soybean productivity jointlywith the F-statistic equal to 7.619, with a probability value <α = 1% is 0.000.
T-test is used to determine the effect of each independent variables towards dependent variable. The signiicance level which is used in this study is 99% and 90% (α = 1%, α = 10%). Mathematically, Table 6 shows the regressionmodel between soybean productivity with influential variable factors written in the following equation.
Ln Y = 1.170 + 0.06 lnx1 + 0.329 lnx2 –
0.217 lnx3 + 0.071 lnx4 + 0.142 lnx5 + 0.092 lnx6 + 0.094 lnx7 + 0.709 lnx8
Land (X1 )
Table 6 shows that the land areais not signiicantly at 99% conidence level and 90% because of p-value score of land
area is 0.533 larger than α (0,1) means that any increase in the number of Land is not signiicantly would reduce soybean productivity.
Seeds (X2 )
The result of T-test in Table 6 indicate that the seeds is significantly influence towards soybean yield at 99% signiicance level with p-value of 0.001 is smaller than α (0.01). Regression coeficient value is 0.329 has positive effect, it means that the increase of seeds number by 1 percent would increase soybean yield at 0.329 percent, assuming other factors remain (constant). Seed is one of the important production factor in soybean. Quality seeds is one of the factors that determine the soybean productivity. This is in line with research Isnowati (2014), Tahir (2011), Mahabirama (2013).
NPK Fertilizer (X3 )
for 0.217%, assuming other factors remain (constant).
The maximum dose of NPK is 200 kg/ha which is applied 2 times, 100 kg of basic fertilizer is given at the time of planting and 100 kg of fertilizer is given 20 days after planting. The average of NPK fertilizer used by farmer is 105.91 kg/ha. The addition of NPK fertilizer would reduce soybean productivityif it has reached maximum usage. This is according to research by Ernawanto (2012) which states that plant height affected by NPK fertilization/ Phonska at the age of 30 days or 60 days, but the addition of fertilizer above 100 kg/ ha had no signiicant to height. It is the same with NPK/ Phonska fertilizer that can increase soybean seeds production but the addition of fertilizer above 75kg/ ha will not show difference towards productivity. Fertilizer will increase of productivity if the fertilizer is already proper for its variety, dose, time, and the way of fertilization.
Manure (X4 )
Manure is one of organic fertilizer which is good for plants. The result of statistic test show that manure affect signiicantly towards soybean productivity for signiicance level 10% with its p-value is 0.08, smaller than α (0.1). The score ofregression coefficientis positive with its score 0.071, it shows that the addition of manure 1% will increase soybean
productivity 0.071%. The average usage of manur in research location is 2.6 ton/ ha. This is in line with research Rahayu (2010) and Sukma, et al (2013).
Gandasil Fertilizer (X5 )
Gandasil fertilizer is for foliar leaves shaped crystals which can support growth of the crop, so it can grow faster and help to form leaves. It is also help generative phase (lowering and fruiting). It can be seen from the content of Nitrogen (N) which is more dominant than elements and other components.
The result of T-statistic in Table 6 show that Gandasil fertilizer is affected signiicantly towards soybean productivity for signiicance level 90% with its p-value 0.06, smaller than α (0.1). The score of regression coeficient is positive with its score 0.142, it means that the addition of 1% Gandasil fertilizer can increase soybean productivity 0.142. According to Nugroho (2014), efforts to increase soybean plant productivity can be done through leaf. Fertilization through the leaves is done by spraying the fertilizer in liquid form on the plant directly. This method is more effective because it is easy to enter and absorbed into the stomata.
Pesticide (X6 )
6show that pesticide does not effect signiicantly towards soybean productivity for significance level 99% and 90% because of its p-value is 0.160, bigger α (0.1). Pesticide does not effect signiicantly towards increased soybean productivity but it can prevent or protect the cropsfrom pests and diseases. Factually, the usage of pesticide use to suppress the attack of pests in the ield.The right use of pesticide will increase soybean productivity.
Labor (X7 )
Table 6 show that labors do not effect signiicantly towards soybean productivity for signiicance level 99% and 90% because of its p-value 0.442, bigger than α (0.1).The Labor is not benchmark for commodity to has a good productivity.
GAP Adoption Rate (X8 )
Good Agriculture Practices (GAP) is a good guideline for cultivation. For soybean, GAP is arrangerd in Permentan No. 48/ Permentan/ OT.140/10/2006 about food cultivation. The result of T-statistic in Table 6 show that GAP adoption level affected significantly towards soybean productivity for significance level 90% because of its p-value 0.08, smaller α (0.1).The score of regression coeficient is positive with its score is 0.709, it shows that the addition of GAP adoption levelfor 10% will increase soybean productivity, assuming the other factors are constant.
The GAP adoption level in Kulon Progo Regency is included as a high category with its adoption level 83.07%. The average of soybeanproductivity in Kulon Progo is 1.2 ton/ ha. These numbers is low enough which the potential of superior varieties can achieve about 2.00 – 2.50 ton/ ha. It means that the opportunity to increase soybean productivity can be done by maximize a good cultivation process. This is in line with research Setiawan (2015) and Bayramoglu, et al(2010).
CONCLUSION AND SUGGESTION
GAP adoption level for soybean in Kulon Progo is in high category. The farmers adopt 83.07% for all components, they are inputs, land preparation, planting, fertilization, plant protection, irrigation, harvest, and post-harvest.
Soybean productivity is affected significantly by factors of seeds, NPK fertilizer, manure, Gandasil fertilizer, and GAP adoption rate. While the land are, pesticides, and labors are not affected signiicantly toward soybean productivity. The largest of regression coefficient of GAP adoption level affect soybean productivity with its score is 0.709 It shows that each addition of GAP adoption for 1% can increase soybean productivity 0.709%., assuming other factors are constant.
and proper crop cultivation (GAP) through counseling, training or regular meeting and thorough. In addition, the need for increased application of GAP primarily in the planting process because the early stages greatly affect the growth of soybeans. Planting should be done as recommended by a distance of 40x15 cm and 40x10 cm, not just following the former planting of rice and use seeds that are certified or labelled to increase productivity and
income of soybean farming.
REFERENCES
Bayramoglu Z, Gundogmus E, Tatlidil FF. 2010. The Impact of EurepGAP Requiement on Farm Income from Greenhouse Tomatoes in Turkey. African Journal of Agricultural ResearchVol. 5 (5), pp. 348-355, 4 March, 2010.
[BPS] Badan Pusat Statistik. 2016. Luas Panen dan Produksi Kedelai Menurut Provinsi (ton), 1993-2015. https:// www.bps.go.id/[Diakses 15 Januari 2017].
Ghozali, I. 2012. Aplikasi Analisis Multivariante Dengan Program SPSS. Semarang: Badan Penerbit Universitas Diponegoro.
I s n o w a t i , S . 2 0 1 4 . F a k t o r y a n g mempengaruhi produksi kedelai diDesa Kebonagung, Kecamatan
Tegowanu, Kabupaten Grobogan. SEPA, 10(2): 177-185.
M a h a b i r a m a , A . K . , K u s w a n t i , H . , Daryanto,S., dan Winandi, R. 2013. AnalisisEfisiensi dan Pendapatan UsahataniKedelai di Kabupaten Garut ProvinsiJawa Barat. Jurnal Aplikasi Manajemen XI(2): 197-206.
Nugroho, N, Bahrun, A. 2014. Pengaruh Sitem Tanam dan Waktu Aplikasi Pupuk Lewat Daun terhadap HAsil Tanaman Kedelai (Glycine max (L.) Merr.) Varietas Anjasmoro Tanpa Olah Tanah. Jurnal Agro UPY Vol. VI. No. 1 September 2014.
Rahayu, W. dan Riptanti, E.W. 2010. A n a l i s i s E f i s i e n s i E k o n o m i P e n g g u n a a n F a k t o r - F a k t o r ProduksiPada Usahatani Kedelai Di Kabupaten Sukoharjo. Caraka Tani XXV No. 1 Maret 2010.
Setiawan F, dkk. 2015. Implementasi GAP (Good Agriculture Practice) lada dan pengaruhnya terhadap produktivitas lada di Desa Petaling Banjar, Kecamatan Mendo Barat. Enviagro, Jurnal Pertanian dan Lingkungan. Vol.8 No. 2, hal 72-82. ISSN 1978-1644.
Village Tlogomulyo Sub District Temanggung. Agro Ekonomi Vol. 24/ No. 1, Juni 2013.
Sumarno & Adie, M.M. 2010. Strategi Pengembangan Produksi Menuju Swasembada Kedelai Berkelanjutan. Jurnal Iptek Tanaman Pangan Vol. 5 No. 1 – 2010.
Tahir, AG 2011. Analisis risiko produksi usahatani kedelai pada berbagai tipe
lahan di sulawesi selatan. Jurnal Sosial Ekonomi Pertanian VIII(1): 1-15.