R-peaks detection method for classifying
arrhythmia disorder
Anggit Ferdita Nugraha*, Brahmantya Aji Pramudita, Noor Akhmad Setiawan, Hanung Adi Nugroho
Department of Electrical Engineering and Information Technology, Faculty of Engineering, Universitas Gadjah Mada, Yogyakarta
DOI: http://dx.doi.org/10.19106/JMedSci004904201703
ABSTRACT
Electrocardiography (ECG) is a non-invasive technique that is used to diagnose heart abnormalities. ECG records all heart activities and represent them using bio electric signals. Arrhythmia is one of the cardiac disorder that can be detected using ECG. Arrhythmia need to be detected early because of an early symptom of heart disease as deadly as coronary heart disease and heart failure. Arrhythmia described using the difference between the R-peaks based on QRS complex. Therefore, R-peaks detection will be an important factor that can be used to classify arrhythmia disease. One of the widely used methods to detect R-peaks is Pan-Tompkins method. Pan-Tompkins method used a threshold value approach to get all location of R-peaks point from the ECG signals. This study proposed a development based on Pan-Tompkins method by change the threshold value using normalize technique and moving windows approach to get all location of R-peaks point from the ECG signals. This study uses MIT-BIH arrhythmia dataset. This method can show the R-peaks detection with 99.83% sensitivity and 0.40% total error rate detection. Hence, this method has potential to be used for classifying arrhythmia disorder based on the R-peaks point.
ABSTRAK
Elektrokardiograi (ECG) merupakan salah satu metode non-invasif yang digunakan untuk
membantu mendiagnosis berbagai kelainan jantung. ECG bekerja dengan merekam berbagai aktivitas jantung dan merepresentasikannya ke dalam bentuk isyarat listrik jantung. Aritmia merupakan salah satu kelaian jantung yang mampu di deteksi menggunakan ECG. Aritmia perlu dideteksi secara dini karena merupakan awal gejala terjadinya penyakit jantung yang mematikan seperti jantung koroner dan gagal jantung. Adanya aritmia pada isyarat ECG digambarkan dengan selisih jarak antar puncak R berdasarkan kompleks QRS. Sehingga titik puncak R menjadi salah satu factor penting yang dapat digunakan untuk
mengkalasiikasi adanya aritmia. Metode Pan-Tompkins menjadi metode yang paling
ini mempunyai potensi baik untuk mendeteksi adanya titik puncak pada isyarat ECG yang
mendukung klasiikasi aritmia.
Keywords: electrocardiography - R-peaks detection - QRS complex - arrhythmia disorder - Pan-Tompkins method
INTRODUCTION
Heart is the most important part of human circulatory system.1–3 Heart has two main
functionality, the irst one is to circulate oxygen and nutrients throughout the body, and the second one is to carry away the remains of the metabolism.4 Heart has also affect the
performance of the other parts, hence cardiac disorder will cause disruption of the entire performance of system in the human body.5
World Health Organization (WHO) states that heart disease is the leading cause of death in the worldwide. Around 17.3 million people
worldwide die from heart disease annually and it was predicted to grow to 23.6 million in 2030.1,3 Therefore, early detection become
solution to reduce the number of deaths cause of cardiac disease.6 Electrocardiography
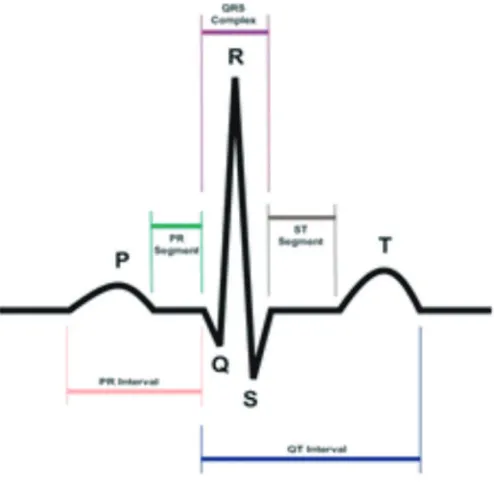
(ECG) can be used for early detection of cardiac disorder. ECG is a medical instrument that is used to monitor heart activities. ECG uses electrodes on the limb or chest to record all activities and represent it using bio electric signals.7 A normal rhythm on an ECG signal
consist P-QRS-T wave as shown in the FIGURE 1.6,8,9
QRS wave or QRS complex has an important role for ECG analysis.10–14beat
segments, or any other morphological parameters of electrocardiogram (ECG Characteristic of QRS complex based on the rhythmic of depolarization and repolarization of atria and ventricles.15 Therefore it provides
information about current state of the heart.16
Arrhythmia is one of the heart abnormalities that can be determined by the QRS complex waveform. Arrhythmia need to be detected early because of an early symptom of heart disease as deadly as coronary heart disease and heart failure. Arrhythmia described using the difference between the R-peaks based on QRS complex. Therefore, R-peaks detection will be an important factor that can be used to classify arrhythmia disease.
Many algorithm for ECG signal analysis especially for R-peaks detection has been proposed by many researches to increase the accuracy of the system. One of this algorithm is Pan-Tompkins method. Pan-Tompkins method emphasizes on a derivative-based
approach to get R-peaks on ECG signal.9 The
result of that method is 98% accuracy. In this study, we proposed a development method based on Pan-Tompkins algorithm. This method has the same process like iltering process, squaring and derivative-based approach from Pan-Tompkins method, but we adjusted the threshold for R-peaks detection with normalization technique and moving window approach. By adjusting the process, we expected the sensitivity for detecting R-peaks on ECG signal can be increased.
MATERIALS AND METHODS
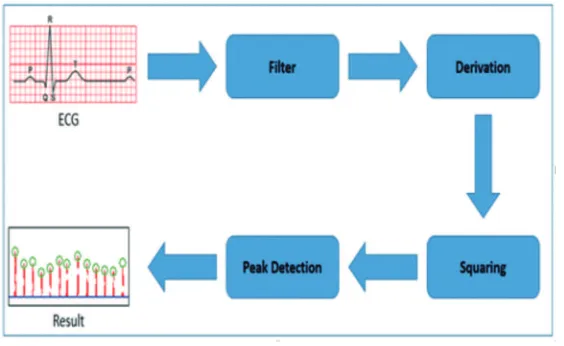
This study conduct in several steps as shown as in FIGURE 2. Data acquisition, ilter process, derivation process, squaring process, and peak detection were the step that must be done to get all location of the R-peaks points from the ECG signal. Explanation of each process would be explained further on each subsection.
Data acquisition
Data acquisition is the initial process, therefore this step must be done irst. Data acquisition is the process to gather many data that is used to analysis process.15 In this
study we used MIT-BIH arrhythmia dataset from Physionet.17 Thus dataset consisted of
48 record with 15 records contain arrhythmia clinical phenomena and the rest was contain record from normal volunteers. Duration for each record from this dataset was 30 minutes include modiied limb lead II (MLII) and the modiied lead V1, V2, V4, or V5.
Filtering process
Filter is a process that is used to remove some unwanted feature from a signal 15. In this
case, ilter would be used to remove baseline
wander, muscular activity, and interference signal from the other nearby device that existed in this dataset that we gathered from data acquisition.
We applied band pass ilter to attenuate noise and maximize the QRS energy. In many references, frequency that contain QRS energy is approximately 5-12 Hz.9,18 Band pass ilter
process for this study composed by cascade high-pass ilter and low-pass ilter based on Pan-Tompkins method.
Low-pass ilter that implemented in this study was 2nd order low-pass ilter with 11 Hz
cut-off frequency and the gain was 36. The transfer function for this low-pass ilter was:
This was the different equation for low-pass ilter after user transfer function:
High pass ilter designed for subtracting the output of low-pass ilter. This design used 5 Hz for low frequency and 32 for the ilter
This was the different function based on the high-pass transfer function:
gain. Therefore, the transfer function for that design was:
The result of the iltering process used for the next process.
Derivation process
Derivation or derivative ilter is the process after iltering signal to provide the
slope information of QRS complex.9
Pan-Tompkins method use ive-point derivative that shown good enough information of slope to get QRS complex.
After apply that transfer function, the different equation for derivative ilter was:
The result of this equation could be said as the ideal model to know the QRS information.
Squaring process
Squaring function applied for the output of derivative ilter. The equation for squaring function was:
This function made all data point’s positive and emphasizing the higher frequency because of derivative ilter. Hence, it would be easier to determine the R-Peaks.
R-peak detection
R-peaks could be known as the highest point from QRS complex. To determine many points as R-peaks, irst we implemented normalized pattern technique for manipulate all data points under the threshold as a zero points. The threshold obtained by twice of the average value of all data points. The threshold was used to separate every signal that contain QRS complex based on time domain.
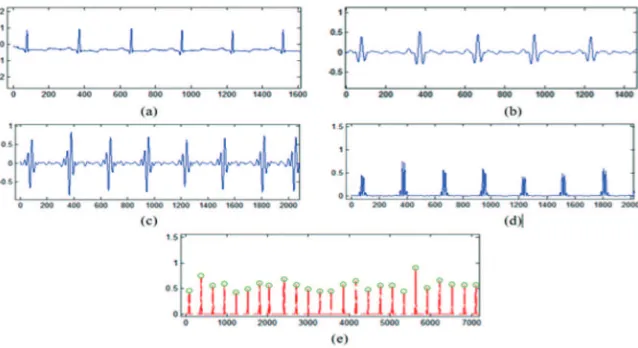
The result of derivation process is shown as FIGURE 3c, whereas FIGURE 3d shows the all positive data based on the output of derivation ilter. This function used to know the dominant feature to get R-peaks point. After implemented the normalization technique and moving windows approach, all R-peaks point would be detected as the result that shown in FIGURE 3e.
RESULTS
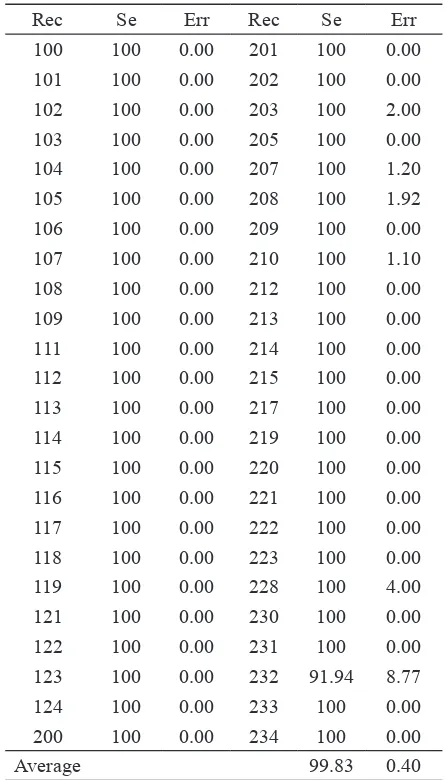
This study has been trained and tested with MIT-BIH Arrhythmia dataset. The performance of this proposed method was evaluated using sensitivity and total detection error. The sensitivity parameter used to evaluate how precise the result of the system compare with the value that detected as R-peaks. The other hand, total detection error used to evaluate how big a system error in detecting the R-peak in each record.
The Sensitivity (Se) of the proposed method was calculated using this function:
And the total error detection (Err) was deined as:
True Positive (TP), False Positive (FP), and False Positive (FN) were main criteria to determine the value of the accuracy and total error detection. TP was obtained from the number of R-peaks that detected from the system based on the ground truth. FP contained the number of points that detected by the system but in the ground truth that point was not the R-peaks. Last, FN was the number of points that was not detected by the system
Rec Se Err Rec Se Err
100 100 0.00 201 100 0.00
101 100 0.00 202 100 0.00
102 100 0.00 203 100 2.00
103 100 0.00 205 100 0.00
104 100 0.00 207 100 1.20
105 100 0.00 208 100 1.92
106 100 0.00 209 100 0.00
107 100 0.00 210 100 1.10
108 100 0.00 212 100 0.00
109 100 0.00 213 100 0.00
111 100 0.00 214 100 0.00
112 100 0.00 215 100 0.00
113 100 0.00 217 100 0.00
114 100 0.00 219 100 0.00
115 100 0.00 220 100 0.00
116 100 0.00 221 100 0.00
117 100 0.00 222 100 0.00
118 100 0.00 223 100 0.00
119 100 0.00 228 100 4.00
121 100 0.00 230 100 0.00
122 100 0.00 231 100 0.00
123 100 0.00 232 91.94 8.77
124 100 0.00 233 100 0.00
200 100 0.00 234 100 0.00
Average 99.83 0.40
TABLE 1. Performance result of R-peaks detection
dataset MIT-BIH arrhythmia
DISCUSSION
Several studies have suggested that QRS complex is an important feature that support various classiication process especially for ECG classiication. Sathyapriya et al.18
reported QRS detection using Pan-Tompkins method with band pass ilter to reduce the noise of raw data. The result showed that the classiication’s accuracy of normal and abnormal heart beat increased more than 90%. The other study using QRS complex to detect R-peaks point was reported by Bawa & Sabherwal.19 This study explained
R-peaks from the QRS complex that detected using modiied Pan-Tompkins method. Thresholding was applied as modiied method to reduce computation process for detecting all R-peaks location. The result showed that all detected R-point might support many process of arrhythmia classiication based on RR interval method.
Our study focused on how to develop the method that used to determine the location of R-peaks points based on the QRS complex. The R-peaks point will be an important feature to classify cardiac disease especially arrhythmia disease. As the method is getting more sensitive to get the feature, the more accurate arrhythmia disorder can be classiied from ECG signal
Based on the experiment, our method has been developed using several steps that explained at the materials and method section. This section explained the step by step how to proceed the data set until get the R-peaks point from each record. First process was to gather data from MIT-BIH arrhythmia data set. All record from this data set would be used for the next process to get the R-peaks point from the ECG signal. Every record had
some unwanted feature that affected result of the R-peaks detection. After iltering process, we used derivation ilter to make a normalize wave form that was used to provide the slope information of QRS complex. The output from the derivation process would be used for the squaring process. This process was used to transform the data into positive value, hence it would be easier to determine the location of R-peaks point.
Performance evaluation system from the experiments used sensitivity parameter and total error detection. Sensitivity parameter could be calculated using evaluation parameter such as true positive, false positive, and false negative. True negative was not used to this evaluation because the system focused on the R-peaks. Hence, the other points that not R-peaks would not save by the system. Based on the experiment’s result, this method has potential to detect all R-points as features for classifying cardiac disorder especially arrhythmia.
CONCLUSION
ACKNOWLEDGEMENTS
We would like to thank our colleagues from Department of Electrical Engineering and Information Technology, Faculty of Engineering, Universitas Gadjah Mada, Yogyakarta who have supported this study.
REFERENCES
1. Mozaffarian D, Benjamin EJ, Go AS, Arnett DK, Blaha MJ, Cushman M, et al. Executive Summary: Heart Disease and Stroke Statistics—2015 Update. A Report from the American Heart Association. AHA Statistical Update. January 26, 2015. https:// doi.org/10.1161/CIR.0000000000000157 2. Rai HM, Trivedi A, Shukla S, Dubey V. ECG
arrhythmia classiication using daubechies wavelet and radial basis function neural network. 3rd Nirma Univ Int Conf Eng NUiCONE 2012. 2012; 6–8. https://doi. org/10.1109/NUICONE.2012.6493281 3. Fitria D, Ma’sum MA, Imah EM, Gunawan
AA. Automatic arrhythmias detection using various types of artiicial. J Comput Sci Inf 2014; 90–100.
4. Park J, Lee K, Kang K. Arrhythmia detection from heartbeat using k-nearest neighbor classiier. Proc 2013 IEEE Int Conf Bioinforma Biomed. IEEE BIBM 2013; 15–22. https:// doi.org/10.1109/BIBM.2013.6732594
5. Pingale SL. Using Pan Tompkin ‘ S Method, ECG signal processing and dignose various diseases in Matlab. Proc IRF Int Conf; 57-61, Pune, India 2014.
6. Boonperm P, Supakasemwong D, Naiyanetr P. ECG analyzing program for arrhythmia detection. BMEiCON 2014 - 7th Biomed Eng
Int Conf 2015; 4–7.
7. Patel AM, Gakare PK, Cheeran AN. Real time ECG feature extraction and arrhythmia detection on a mobile platform. Int J Comput
8. Yazdani S & Vesin JM. Extraction of QRS iducial points from the ECG using adaptive mathematical morphology. Digit Signal Process A Rev J 2016; 56: 100–109.
9. Pan J & Tompkins WJ. A real-time QRS detection algorithm. IEEE Trans Bio-medical Eng Eng BME 1985; 32: 230–6. https://doi. org/10.1109/TBME.1985.325532
10. Sharma LD & Sunkaria RK. A robust
QRS detection using novel pre-processing techniques and kurtosis based enhanced eficiency. Meas J Int Meas Confed 2016; 37: 194–204. https://doi.org/10.1016/j. measurement.2016.03.015
11. Elgendi M, Eskoier B, Dokos S, Abbott D. Revisiting QRS detection methodologies for portable, wearable, battery-operated, and wireless ECG systems. PLoS One 2014; https://doi.org/10.1371/journal.pone.0084018 12. Zhang H. An improved QRS wave
group detection algorithm and Matlab implementation. Phys Procedia 2012; 25:1010–6. https://doi.org/10.1016/j.phpro. 2012.03.192
13. Álvarez RA, Penín AJM, Sobrino XAV. A comparison of three QRS detection algorithms over a public database. Procedia Technol 2013; 9:1159–65. https://doi.org/10.1016/ j.protcy.2013.12.129
14. Sadhukhan D & Mitra M. R-peak detection algorithm for ECG using double difference and RR interval processing. Procedia Technol 2012; 4: 873–7. https://doi.org/10.1016/ j.protcy.2012.05.143
15. Saini I, Singh D, Khosla, A. QRS detection using K-Nearest Neighbor algorithm (KNN) and evaluation on standard ECG databases. J Adv Res 2013; 4: 331–44. https://doi. org/10.1016/j.jare.2012.05.007
Programs Biomed 2012; 107: 490–6. https:// doi.org/10.1016/j.cmpb.2011.12.004
17. MIT-BIH Arrhythmia Database. www. physionet.org/physiobank/database /mitdb 18. Sathyapriya L, Murali L, Manigandan T.
Analysis and detection R-peak detection using Modiied Pan-Tompkins algorithm.
Proc 2014 IEEE Int Conf Adv Commun Control Comput Technol ICACCCT 2014 2015; 483–7.