THE SPLIT REGENCY, DEVELOPMENT INEQUALITY AND THE NUMBER OF POVERTY INTRA KABUPATEN-KOTA IN SOUTH SUMATERA PROVINCE
AZWARDI* SRI RAHAYU E.L**, ABUKOSIM* ABSTRACT
This research aims to analyze the split regency, inequality and poverty intra kabupaten-kota in South Sumatera. This research uses Williamson index and Klassen Typology based on PDRB data and number of poverty.
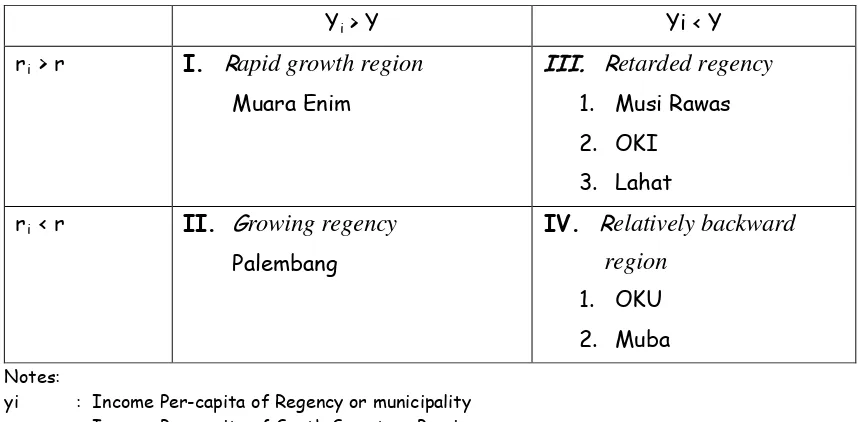
Based on Klassen typology, there is movement of position in the ranking kabupaten-kota. In 1996-2001 or before split regency, Muara Enim is rapid regency, Palembang is retarded regency, Musi Rawas, OKI and Lahat is growing regency and OKU and Muba is relatively backward regency. In this period most of regency, about 42.85 percent is in third quadrant, which is rapid growth regency, about 28.57 percent is in relatively backward regency and the rest regency is retarded regency.
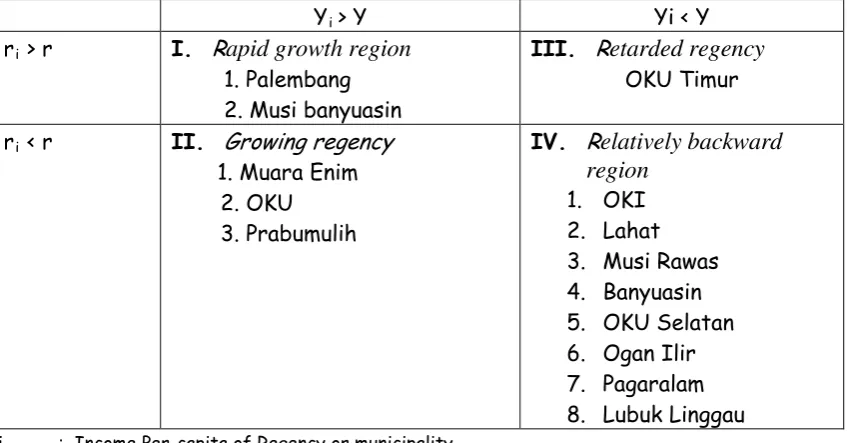
In 2002-2007 or after split regency, the rapid growth is Palembang and Muba, the retarded regency is OKU, Muara Enim and Prabumulih. As growing regency is OKU Timur and as relatively backward regency is OKI, Lahat, Musi Rawas, Banyuasin, OKU Selatan, Ogan Ilir, Pagar Alam and Lubuk Linggau. In this period about 57.14 percent is in the position relatively backward regency, where about 62.5 percent of this is the split regency.
During 1996-2001 based on PDRB oil-gas, the inequality intra regency by excluding Palembang (IW average = 0.514) tend to increase, if we compare the index by including Palembang (IW average = 0.381). Based on PDRB non oil-gas if we exclude Palembang (IW average = 0.300), then inequality tend to decrease compare to if we include Palembang (IW average = 0.338). Inequality intersection based on PDRB oil-gas, if we include all sector, the inequality is relatively low (IW average = 0.433) or IW under 0.5. However, without farming sector the inequality tend to increase (IW average = 0.639), but without industry sector the inequality tend to decrease (IW average = 0.350). Based on PDRB non oil-gas, by including all sectors, then the condition tend to equal (IW average = 0.342). But without farming sector the inequality tend to increase (IW average = 0.762) and tend to decrease if we exclude the industry sector (IW average = 0.327)
During 2002-2007 based on PDRB oil-gas, the inequality intra regency by excluding Palembang (IW average = 0.684) is not quite difference, if we index by including Palembang (IW average = 0.630). But on PDRB non oil-gas, if we exclude Palembang (IW average = 0.267), then inequality tend to decrease compare to if we include Palembang (IW average = 0.397). Inequality intersection based on PDRB oil-gas, if we include all sector, the inequality is relatively high (IW average = 0.63) because IW value is over 0.5. However, without farming sector or industry sector the inequality tend to increase (IW average = 0.639), but without industry sector the inequality tend to decrease (IW average = 0.791 and 0.706). Based on PDRB non oil-gas, by including all sectors, then the condition tend to low (IW average = 0.35), because IW value under 0.5. But without farming sector the inequality tend to increase (IW average = 0.619) and tend to decrease if we exclude the industry sector.
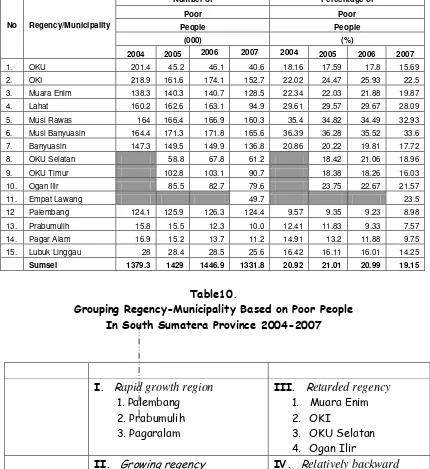
If Klassen Typology relates to the number of poverty, there is the adequate level for Palembang, which is in the second quadrant and the position ranking the number of poverty is fourteenth (The lowest). OKU in the second quadrant and the number of poverty is ninth. Muara Enim is third quadrant and the position is seventh. In Fourth quadrant that are OKI in fourth position, Lahat in second position, Musi Rawas in first position, Banyuasin in sixth position and Ogan Ilir in fifth position. An in the extreme quadrant that are Muba, Prabumulih, OKU Selatan, Pagar Alam dan Lubuk Linggau. Key words: Inequality, economic growth, income per-capita and the number of poverty * The Lecturer of economics faculty Sriwijaya University
1. Introduction
The opportunity to develop regency is more open since regency autonomous applied. South Sumatera Province consist 8 new regency/municipality, the result of split regency. In 2001 Pagar Alam municipality, Prabumulih municipality, and Lubuk Linggau municipality were split. Then in 2002 Banyuasin regency, Ogan Ilir regency, East OKU regency, and South OKU regency were also split. At last in 2003 Empat Lawang regency was split.
Authority implication in order to develop the larger regency or municipality caused different economic growth achievements, different income per-capita and poverty level of the regencys.
2. Conceptual Frame
Figure1. Conceptual Frame
Development inequality in South Sumatera Province
• Before Split
• After Split
Index Williamson
Typology Klassen
- Convergences - Divergence
Strategic Issues
Goal and Policy Program
and Policy Strategic
Regency
3. Result and Analysis
3.1. Economic Growth and Income Per-capita Before Split (1996-2001)
Economic growth and income per-capita of regency or municipality during 1996-2001 is used to show relative economic structure position of each regency or municipality before splits (see Table 1 and 2).
Table 1.
Result of Regency or Municipality Typology Klassen In South Sumatera Province 1996-2001 (Non-oil and gas)
Yi > Y Yi < Y
ri > r I. Rapid growth region
Muara Enim
III. Retarded regency
1. Musi Rawas
2. OKI 3. Lahat
ri < r II. Growing regency
Palembang
IV. Relatively backward region
1. OKU
2. Muba
Notes:
yi : Income Per-capita of Regency or municipality y : Income Per-capita of South Sumatera Province ri : Economic Growth of regency or municipality r : Economic Growth of South Sumatera Province
Table 2.
Economic Growth and Income per-capita of Regency or Municipality in South Sumatera Province 1996-2001
Regency/ Municipali
ty
1996 1997 1998 1999 2000 2001
R Y r y R Y r y R y r y
OKU 7,00 1.190 2,47 1.107 6,93 1.163 1,23 1.071 3,52 1.073 5,56 1.099
OKI 10,10 1.043 5,08 1.176 4,47 1.159 1,99 1.089 2,6 1.094 4,55 1.114
M.Enim 10,68 1.293 4,67 2.909 4,88 1.954 2,00 1.843 3,3 1.886 3,62 1.891
Lahat 7,27 800 7,50 1.293 5,75 1.313 0,28 1.212 2,58 1.182 3,79 1.189
MURA 8,95 647 5,17 1.102 3,14 1.175 2,25 1.111 4,31 1.105 4,29 1.145
MUBA 0,96 1.562 4,23 1.422 6,67 1.634 0,43 1.552 0,34 1.525 3,87 1.488
PLG 8,99 2,847 6,46 2.182 12,5 2.589 3,02 2.219 5,01 2.242 4,48 2.309
SUMSEL 8,79 1.888 6,27 1.663 5,31 1.675 2,06 1.554 0,71 1.555 4,22 1.537
Source: BPS Regency/Municipality in South Sumatera
Based on the table, shown that most regencys or municipality in South Sumatera during 1996-2001 (before split) gets into third Quadrant position which means retarded regency that reaches 42.85 percent. 28.57 percent for relatively relatively backward region and the others as growing regency and rapid growth region
3.2. Economic Growth and Income Per-capita After Split (2002-2007)
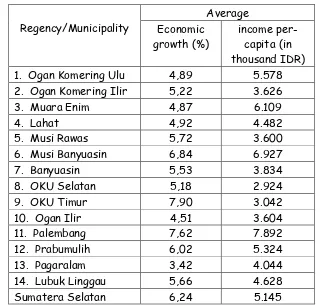
Regency or municipality split seems changes of relative position on economic model and structure of regency or municipality in South Sumatera. The changes show by typology analysis Klassen in South Sumatera by using economic growth and income per-capita data of regency or municipality in South Sumatera 2002-2007.
After Regency or municipality split, it is position of relative economic regency movement in South Sumatera which is about 57.14% of left behind regency. 62.5% of that left behind regency is the result of regency or municipality split, such as Banyuasin, South OKU, Ogan Ilir, Pagar Alam, and Lubuk Linggau (See Table 3 and 4).
Table 3.
Analysis result of Regency or municipality typology Klassen in South Sumatera Province 2002-2007 (Non-oil and gas)
Yi > Y Yi < Y
ri > r I. Rapid growth region
1. Palembang 2. Musi banyuasin
III. Retarded regency
OKU Timur
ri < r II. Growing regency
1. Muara Enim 2. OKU 3. Prabumulih
IV. Relatively backward region
1. OKI 2. Lahat 3. Musi Rawas 4. Banyuasin 5. OKU Selatan 6. Ogan Ilir 7. Pagaralam 8. Lubuk Linggau Yi : Income Per-capita of Regency or municipality
R : Economic Growth of South Sumatera Province Table 4.
Classification of Economic Growth and Income percapita Regency or municipality In South Sumatera Province 2002-2007
Regency/Municipality
Average Economic
growth (%)
income per-capita (in thousand IDR) 1. Ogan Komering Ulu 4,89 5.578 2. Ogan Komering Ilir 5,22 3.626
3. Muara Enim 4,87 6.109
4. Lahat 4,92 4.482
5. Musi Rawas 5,72 3.600
6. Musi Banyuasin 6,84 6.927
7. Banyuasin 5,53 3.834
8. OKU Selatan 5,18 2.924
9. OKU Timur 7,90 3.042
10. Ogan Ilir 4,51 3.604
11. Palembang 7,62 7.892
12. Prabumulih 6,02 5.324
13. Pagaralam 3,42 4.044
14. Lubuk Linggau 5,66 4.628
Sumatera Selatan 6,24 5.145
Source: BPS Regency/Municipality in South Sumatera
3.3. Development Inequality in South Sumatera Province
Table 5.
Index Level Williamson (Vw) in South Sumatera 1996–2001
PDRB Oil&Gas PDRB Non-Oil&Gas
Year Vw Year Vw
1996 0,376 1996 0,323
1997 0,354 1997 0,325
1998 0,382 1998 0,334
1999 0,377 1999 0,337
2000 0,399 2000 0,351
2001 0,400 2001 0,359
Average 0,381 Average 0,338
Std. Deviation 0,0171 Std. Deviation 0,014289
Table 6.
Index Level Williamson (Vw) in South Sumatera 2002–2007
PDRB Oil&Gas PDRB Non-Oil&Gas
Year Vw Year Vw
2002 0,663 2002 0,365
2003 0,658 2003 0,375
2004 0,637 2004 0,388
2005 0,623 2005 0,391
2006 0,606 2006 0,420
2007 0,591 2007 0,444
Average 0,630 Average 0,397
Std. Deviation 0,028521 Std. Deviation 0,029539
During the period 1996-2001 on PDRB oil & gas, Inequality occurred among Regency or Municipality “without” Palembang Municipality (IW average = 0.514) influenced increase compared “with” Palembang municipality (IW average = 0.381). Contrary to PDRB non-oil and gas “without” Palembang municipality (IW average = 0.300), so the inequality influenced decrease compared with “with” Palembang municipality (IW average = 0.338). It shows that the position of Palembang municipality significantly affects to development inequality in South Sumatera Province, that the development in Palembang municipality indeed inequality with other regencys or cities.
Table 7.
Inequality Index Matrix (lK) in South Sumatera Province 1996-2001
Classifica tion
Inequality among Regencys/Cities Inequality among Sectors All
Regencys/Cities
All Regencys or Cities *
Nine Sectors Eight Sectors**
*= “without Palembang Municipality **= “without” Farming Sector ***= “without” Industrial/manufacture Sector
During period 2002-2007 “with” PDRB oil-gas, inequality occurred among regencys/cities “without” Palembang municipality (IW average = 0.684) not quite different to “with” Palembang municipality (IW average = 0.630). But PDRB non-oil and gas “without” Palembang municipality (IW average = 0.267), so inequality influences decrease than “with” Palembang municipality (IW average = 0.397). It shows that Palembang municipality is still one of cities influencing inequality among regencys/cities in South Sumatera Province at after Autonomous regency era (regency split).
Table 8.
Inequality Index Matrix (lK) in South Sumatera Province 2002-2007
Classifica tion
Inequality Among Regencys/Cities Inequality Among Sectors All
Regencys/Cities
All
Regencys/Cities*
Nine Sectors Eight Sectors**
*= “Without” Palembang municipality **= “without” Farming Sector ***= “Without” industrial/manufacture sector
3.4. Poverty in South Sumatera Province
Alam municipality in quadrant IV has low number of poor people. In detail, it can be seen in Table 9.
Table 9. Poor People in Regency/Municipality
South Sumatera Province 2004-2007
No Regency/Municipality
Number of Percentage of
Poor Poor
Grouping Regency-Municipality Based on Poor People In South Sumatera Province 2004-2007
I. Rapid growth region
1. Palembang 2. Prabumulih 3. Pagaralam
III. Retarded regency
1. Muara Enim 2. OKI
3. OKU Selatan 4. Ogan Ilir
II. Growing regency
1. OKU 2. Banyuasin 3. OKU Timur 4. Lubuk Linggau
IV. Relatively backward region
2. Lahat 3. Musi Rawas 4. Muba
DAFTAR PUSTAKA
Aziz, Iwan Jaya. 1994. Ilmu Ekonomi Regencyal dan Aplikasinya di Indonesia. Penerbit FEUI.
Arsyad, Lincolin. 1999. Pengantar Perencanaan dan Pembangunan Ekonomi Daerah. BPFE. Yogyakarta.
Arsyad, Lincolin. 2005. Ekonomi Daerah: Pengantar Perencanaan Pembangunan. Edisi Kedua. BPFE. Yogyakarta
BPS Propinsi Sumsel. 2007. Pendapatan Regencyal Bruto Propinsi Sumatera Selatah Tahun 2000-2006. BPS Sumsel. Palembang.
Isard, Walter dkk. 1998. Methods of Interregencyal and Regencyal Analysis. Ashgate Publishing Company. England
Kamaluddin, Rustian. 1983. Beberapa Aspek Pembangunan Nasional dan Daerah. Penerbit Ghalia Indonesia. Jakarta
Lestari, Sri Rahayu Endang 2010. Analisis Ketimpangan Wilayah di Propinsi Sumatera Selatan . Thesis PPs Unsri(Tidak dipublikasikan)
Soegijoko, Budhy Tjahjati, S. 1999. Perencanaan Regencyal dan Pembangunan Kawasan Terpadu. Bunga Rampai Perencanaan Pembangunan di Indonesia. Grasindo. Jakarta.
Kuncoro, Mudrajad. 2001. Analisis Spasial dan Regencyal. UPP AMP YKPN. Yogyakarta.
Kuncoro, Mudrajad. 1997. “Ekonomi Pembangunan: Teori, Masalah dan Kebijakan”. UPP AMP YKPN. Yogyakarta.
Syafrijal. 2008. Ekonomi Regencyal: Teori dan aplikasi. Praninta Offset. Padang