!"#$%&'
35
! "#$ % &
Department of Chemistry, Faculty of Mathematics and Natural Sciences, Universitas Sriwijaya, Indralaya, Ogan Ilir, Sumatera Selatan 30862, Indonesia.
' ( We develop new approach to produce carbon nanostructures, by using biomass as precursor, hydrothermal pretreatment and microwave pyrolysis as preparative methods. The crystallography and surface functionalities of carbon sheets were analyzed based on x ray diffraction and FTIR data. The electrical conductivity was examined by using Kelvin methods. The electrochemical behavior tests were carried out upon binderies carbon pellet using cyclic voltammetry method of three electrodes system. FTIR analysis showed that the existence of C=C in aromatic of carbon vibration in 1100 – 1300 cm1, carboxyl – carboxylate bonding vibration in 1600 cm1, O C=O and O C=N bending vibration in 1600 – 2500 cm1 and hydroxyl carboxyl bond. XRD analysis showed that the hydrothermal treatment eliminated the character of the basal plane of carbon. The crystal structure of carbon was only detected for edge plane (002). The carbon has 0.039 Scm1 of electrical conductivity. The shapes of voltammograms were relatively rectangular which meant that carbon electrode underwent dominantly non faradaic or electrical double layer process. All voltammograms showed the existence of electrical double layer characteristic ranging from 10.3 to 23.2 mFg1. The highest electrical current can be obtained using base electrolyte (KOH).
)* (
Gelam wood bark (GWB) usually damped into trash after skinned off of the Gelam Wood (( ) *) ) ). GWB has overlapped skin to form a layered structure with less than 0.2 mm of individual layer thickness arranged in irregular flaky surface and contains organic material in the form of cellulose, hemicellulose, lignin, resins. Considering its structure, it would be very unique when it can be developed into carbon. By using the microwave method, which is known capable in handling micro and nanoscale structure of a material +), -. so that the nanostructure can be maintained. Nanostructure in carbons were known as main factor for the superiority of energy storage device, i.e. supercapacitor +/.* Supercapacitor using nanostructure carbon electrodes showed high rate capability of up to 500 mV s 1
+0.. Supercapacitor can be used in a wide array of energy needing things, like electric transportation technology (e.g., hybrid electric vehicles (HEVs) and plug in HEVs), electric utility industry (e.g., emergency backup power and grid system stability improvement), consumer electronics (e.g., laptops, cell phones, pagers, and video cameras), medical electronics (e.g., portable defibrillators, drug delivery units, and neurological stimulators), and military/defense devices (e.g., communication devices, unmanned aerial vehicles, spacecraft probes, and missile systems) +1..
The fact that GWB based nanostructure carbon is cheap as well as its availability, make the perfect substitute for polymer based or laser based carbon electrodes in supercapacitor +2, 3.. The novelty of
! 4530 6 4102
!"#$%&'
36
this research related with the producing of carbon nanosheets from GWB using hydrothermal assisted microwave pyrolysis technique. This approach reduced the cost and time compared to the other sources and techniques.
-* :
-*)* !
GWB was cleaned by soaking in water for 12 hours and then dried under the sunlight for one day. To get mashed powder, GWB was cut into small pieces using scissors and put into blender to make powder. Mixture of GWB powder 40 g and KOH 0.08 g in 100 mL water was stirred for 3 minutes, placed in the hydrothermal reactor and heated in the electric baking oven at 200 °C. Under this condition the pressure inside the reactor reached 20 – 30 bars. After 16 hours in the oven, the reactor was cooled to room temperature and atmospheric pressure. Hydrothermal treatment resulted torrefaction material +;.. Microwave pyrolysis was applied to the mixture of torrefaction material powder 20 g and graphite rod 4 g (as microwave absorber) in a crucible and microwave furnace. The mixture was put into microwave oven and heated for 20 minutes so that the temperature can reach 800 ⁰C. The result of microwave pyrolysis was carbon nanosheets (CNS) that used as electrodes material.
-*-* <
CNSs were characterized using SEM, XRD and FTIR techniques to study morphologies, crystallographies and functionalities, respectively. SEM micrographs were obtained on JEOL JED 2300. X ray diffraction (XRD) patterns of the carbons were obtained on a Shimadzu X ray diffractometer XRD 7000 operating at 40 kV and 30 mA, using Cu K α radiation. FTIR spectra were obtained on Shimadzu IR Prestige 21. The conductivity of electrode was calculated using mathematical relationship (1). CNS was put in the middle of PTFE test tube, covered with two stainless pistons in the both sides. Five tons load was applied to the test tube by using hydraulic jack.
(1)
Where K is electrical conductivity, I is electrical current, d is the thickness of electrode, A is cross section area, and V is voltage. I and V were measured by using four point method. A and d were measured by using digital caliper.
-*/* %
The electrodes were fabricated by mixing the CNR and graphite (70:30), bind together with 10% w/w of bronze filled epoxy resin (Dexton, USA). Circular electrodes were obtained from 0.5 g of mixture paste in 20 mm x 30 mm mold, and pressed under 5 tons load and were heated on hot plate at 50°C for an
!"#$%&'
37
/* =
SEM EDX instrumentation can be used to characterize surface morphology and composition of the carbon samples.
!"#$%&'
38
Typical SEM images of carbon that prepared using developed techniques are shown Figure (1) (A) and (B). The figures showed the existence of nano scale structure (<200nm), i.e. nanosheets. The name of the structure came up from the appearance of sheet like structures. Compare to the CNS that was produced from the mixture of graphite, concentrated sulfuric acid, potassium permanganate and hydrogen peroxide (Hemmet method) which had 20 65 nm in thickness +))., this method produced 1008200 nm. One of the main factors that affect the formation of the carbon nano or micro structure derived from biomass is its precursor +)-.* As well as the bark of a plant that has a flaky or exfoliated structure, highly controlled pyrolysis of bark will produce a sheet like structure +)/..
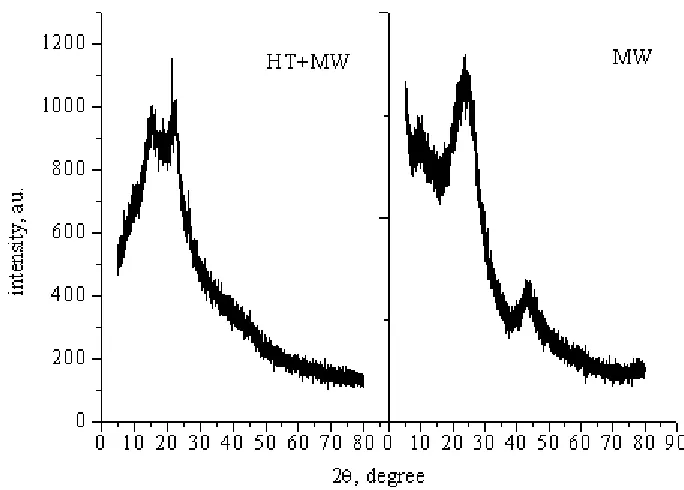
Figure (2) : Diffractogram of CNS from hydrothermal assisted microwave pyrolysis of GWB (HT+MW) and non assisted microwave pyrolysis (MW)
SEM instrumentation also gives EDX analysis that provide element analysis. EDX reading (Figure (1) (C)) showed the percentage of existing carbon in the CNS that having a high enough purity, i.e. 87.18% of carbon and 8.92% of oxygen. There are very small amount of potassium and chlorine, 1.08% and 2.81%, respectively. Potassium is possible elements present in the sample as plant physiological +)0.. Morphology analysis of SEM can be confirmed with XRD data. The analysis of x ray diffractogram (Figure (2)) provided good agreement of the existence of carbon crystalinity. It can be seen that atoms rearrangement in CNS was the same as the arrangement of graphite. Above 800 °C, acidic functionalities of carbon surface volatilized into water and CO2 molecules. In other words, CNS losses its functionalities as the temperature rose followed by fixation and magnification of hexagonal network structure of the carbon.
!"#$%&'
39
The functionalities of CNS can be evaluated by using FTIR methods. Figure (3) showed the existence of C=C in aromatic of carbon which was produced by hydrothermal assisted microwave pyrolysis (HT+MW) of bonding vibration in 1100 – 1300 cm1, carboxyl – carboxylate bonding vibration in 1600 cm1 and O C=O and O C=N bending vibration in 1600 – 2500 cm1. The treatment may also capable to maintain hydroxyl ( OH) and carboxyl ( COOH) bond in CNS. Those bonds were strong indicator for graphene like and graphene oxide structures of CNS.
Figure (3) : FTIR Spectra of hydrothermal assisted microwave CNR from GWB (HT+MW) and without hydrothermal treatment.
The change in crystallography and surface functionality would affect the electrical resistivity of the carbon. Because resistivity is proportional to the magnitude of electrical conductivity, therefore, conductivity can be explained by the results of resistivity measurement. Electrical conductivity values of carbon were influenced by the presence of sp2 carbon in the CNS. Their existences were affected influenced by the temperature applied to produce CNS. The temperature inside microwave furnace reached 800 °C for 20 minutes exposure and it gave CNS with 0.039 Scm1 of electrical conductivity. It can be inferred that the CNS was dominated by sp2 carbon.
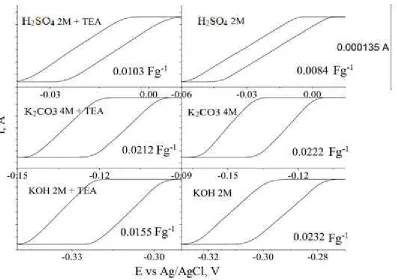
To give an idea about the relationship between capacitance and the profiles of voltammogram, a commercial supercapacitor (Tokin, Inc.) was used to give voltammogram reading of known capacitance value as written on the packaging label, respectively 0.001, 0.002 and 0.22 F (Figure (4)).
It can be shown from Figure (4) that the higher value of capacitance would give the more extensive of voltammogram curve. Therefore, the capacitance value of the capacitor can be calculated from the curve area, electric current value and potential across the capacitor. However, the highest current that can be read by this potentiostat is 100 uA, and the compensation for high current reading was by narrowing potential window in the maximum current reading. When the current value and the potential were calculated using formula (2), the fixed electric current and the narrower potential window will represent the larger capacitance value.
!"#$%&'
40
base electrolyte (KOH). The introducing of TEA into electrolyte caused the decreasing in capacitance for base and relatively the same for salt and increase for acid electrolyte.
Figure (4) : Voltammograms of three known value supercapacitors. Inset: magnification of voltammogram 0.22F supercapacitor.
!"#$%&'
41
Electrochemical activities, i.e. redox (faradaic) process and the formation of electrical double layer in electrode can be described by using reaction equations that express in (3) and (4). Both expressions are relatively the same, i.e. involving the formation of anion, − and proton, /+ that exist in the surface of electrode, ( =1, 2, 3).
Reduction oxidation and electrical double layer can be classified from charge transfer process (S1), the formation of new chemical process, the formation of electric double layer (S2), bond formation between the anion with electrodes or electrostatic interactions (S3) +)2.* Those activities was affected by the mobility of ions +)3, );.. This factor was then affected by porosity, ionic strength, surface tension and dielectric constant +)5..
0*
Hydrothermal assisted microwave pyrolysis of Gelam wood bark (GWB) produced highly crystallite graphitic material and nanostructure feature, i.e. carbon nanosheets (CNS) according to SEM images. This finding was confirmed by x ray diffractogram. The crystal structure of carbon only detected edge plane (002) due to lack of periodicity of wrinkle structure of basal plane. The CNS contained 87.18% of carbon and 8.92% of oxygen with aromatic, carboxyl – carboxylate and hydroxyl carboxyl bonding in the surface of the CNS. The temperature of microwave process reached 800 °C for 20 minutes of exposure and it gave the CNS with 0.039 Scm1 of electrical conductivity. The CNS electrodes have 10.3 to 23.2 mFg1 of capacitance.
&
The financial support for this research provided by Ministry of Education, Directorate General of Higher Education, Republic of Indonesia, is gratefully acknowledged for the ‘Riset Unggulan Perguruan Tinggi’ grant, contract number: 1107.a/UN9.4.2/LK ULP/2013.
[4] M. A. Azam, A. Fujiwara, and T. Shimoda, Int J Electrochem Sci 8 (2013) 3902. [5] J. R. Miller and P. Simon, Science 321 (2008) 651.
[6] J. Li, X. Cheng, A. Shashurin, and M. Keidar, Graphene 01 (2012) 1. [7] Z. Yu, L. Tetard, L. Zhai, and J. Thomas, Energy Env. Sci 8 (2015) 702. [8] H. S. Kambo and A. Dutta, Energy Convers. Manag. 105 (2015) 746.
[9] A. A. Rowe, A. J. Bonham, R. J. White, M. P. Zimmer, R. J. Yadgar, T. M. Hobza, J. W. Honea, I. Ben Yaacov, and K. W. Plaxco, PLoS ONE 6, e23783 (2011).
[10] C. S. Kuo, A. Bai, C. M. Huang, Y. Y. Li, C. C. Hu, and C. C. Chen, Carbon 43 (2005) 2760. [11] D. V. Kosynkin, A. L. Higginbotham, A. Sinitskii, J. R. Lomeda, A. Dimiev, B. K. Price, and J.
M. Tour, Nature 458 (2009) 872.
[12] S. Dutta, A. Bhaumik, and K. C. W. Wu, Energy Env. Sci 7 (2014) 3574.
!"#$%&'
42
[15] M. D. Fang, T. H. Ho, J. P. Yen, Y. R. Lin, J. L. Hong, S. H. Wu, and J. J. Jow, Materials 8 (2015) 3550.
[16] V. Z. Barsukov, V. G. Khomenko, S. V Chivikov, I. V Barsukov, and T. I. Motronyuk, Electrochimica Acta 46 (2001) 4083.
[17] S. J. Lee and S. I. Pyun, J. Korean Electrochem. Soc. 12 (2009) 1 (2009). [18] A. Persat, M. E. Suss, and J. G. Santiago, Lab Chip 9 (2009) 2454 (2009).
[19] K. Fic, G. Lota, M. Meller, and E. Frackowiak, Energy Environ. Sci. 5 (2012) 5842. *****