Analysis of Intellectual Capital Diclosure Practises:
Empirical Study on Services Companies Listed on
Indonesia Stock Exchange
Bambang Bemby Soebyakto, Mira Agustina and Mukhtaruddin
Abstract-Integrated Reporting provides a report that fully integrates financial and non-financial information company. One category of integrated reporting is intellectual capital. It is a voluntary disclosure contained in the company's annual report. The purpose of this study is to analyze the practice of Intellectual Capital Disclosure (ICD) in service companies listed in Indonesia Stock Exchange and empirically examine the effect of corporate governance is proxied by the concentration of ownership, firm size proxied by total assets, the level of profitability is proxied by Return on Assets, leverage, and company listing age on the Stock Exchange on ICD.
Samples companies in this study are a service company listed in Indonesia Stock Exchange period 2009-2013. The sampling technique is using purposive sampling method. Based on the established criteria, the company sampled 131 companies. This study uses panel data analysis.
The results of this study indicate that the level of ICD in Services Company listed on the Indonesia Stock Exchange is still low. The results of empirical testing in this study indicate that corporate governance, firm size, profitability, leverage, and a listing of companies on the Stock Exchange simultaneously have significant affect to ICD. Partially firm size, profitability, and company listing age on the Stock Exchange have significant effect on ICD, while good corporate governance and leverage levels have no significant effect on ICD.
Keywords-Corporate Governance, Firm Size, Integrated Reporting, Intellectual Capital Disclosure, Leverage, Listing Period and Profitability
I. INTRODUCTION
A. Background Research
Free trade phenomenon is producing of absence of artificial barriers (barriers applied by the company) in trade between individuals and companies who are in different countries, resulting in a change in strategy undertaken by firms to remain competitive in the economy. Various kinds of innovation and intense competition, resulting in the company should change the management pattern of labor-based management in a knowledge-labor-based management (knowledge based business). Knowledge-based business is characterized by the spread of information and data widely and faster (Rahadian, 2011). Development and technological innovation and business competition have forced companies to improve the strategy may even change the pattern and the way that previously had been used by the company to run the
business into the pattern and way more in keeping with the times.
The ability of the company to compete not only in the possession of intangible assets, but more on innovation, information systems, management organization and its resources. Therefore, companies are increasingly focusing on the importance of knowledge assets. One approach used in the assessment and measurement of knowledge assets is intellectual capital (IC) which has been the focus of attention in various fields, good management, information technology, sociology, and accounting (Petty and Guthrie, 2000).
IC is closely related to Integrated Reporting. Integrated Reporting provides a report that fully integrates financial information and non-financial companies (including environmental, social, governance, and intangibles) (Eccles et al, 2010). In Indonesia, in addition to the phenomenon of Integrated Reporting, ICD phenomenon also began to develop, especially after the emergence of IAS 19 (revised 2000) on intangible assets, though not stated explicitly as an IC, but less IC has received attention. The IC of the company can be regarded as a form of unaccounted capital in traditional accounting systems although some of them, such as goodwill, patents, copy rights, and trade marks are recognized as intangible assets.
The emergence of unaccounted capital is very tight due to the accounting criteria for the recognition and valuation of assets, namely idenfiabilitiy, control of resources, and the existence of future economic benefits (SFAS No. 19: 19.5). As a result, dissatisfaction with the traditional financial reporting is increased because of its inability to provide sufficient information to stakeholders about the company's ability to create value. In other words, the accounting information has lost its relevance in making investment and credit decisions. A sign that the accounting information has lost its relevance is the growing gap between the market value and the book value of equity companies in the financial markets (Canibano et al, 2000).
Since 2000, academics and practitioners have begun to focus on the issue of company ICD in the annual report (see for example: Guthrie et al., 1999; Guthrie and Petty, 2000; and Goh and Lim, 2004). Definition of ICD has been hotly debated among experts in the literature. Lev and Zarowin (1999) found a lot of research that shows that the current accounting model can not capture the key factors of the compasny's long-term value, the intangible resources. The
DOI: 10.5176/2010-4804_4.1.358
financial statements considered to have failed in drawing coverage of the value of intangible assets (Lev and Zarowin, 1999), led to the asymmetry of information between the company and the user (Barth et al., 2001), and creates inefficiencies in the allocation of resources in the capital market (Li et.al, 2008). Failure to recognize the full accounting on intangible (which includes human resources, customer relationship, and so on), confirms the claim that traditional financial statement has lost its relevance as an instrument of decision making (Oliveira et al., 2008). There are many factors that affect the practice of ICD. Artinah (2013) in his research found that the profitability of a company affects ICD; the results of this study differ from Purnomosidhi (2006) who found profitability by Return on Assets has not affect the ICD.
This study attempted to replicate the research conducted by White et.al (2007), about the factors that affect the disclosure of intellectual capital in the biotechnology company that has been listed in Australia in 2005, the result of concentration of ownership, leverage, independent board, firm age and firm size affects the voluntary of ICD and research Layla (2009) about the factors that influence the voluntary of ICD in non-financial companies listed on the Indonesia Stock Exchange, the result is just the size of the company that affect the ICD while the concentration of ownership, the level of leverage, an independent board, firm age has no effect.
The difference in this study to previous research is on research object. Research conducted by White, et. al, (2007) studied company is a biotechnology company, while Layla (2009) studied company is a non-financial firm. Object of this research is a service company listed on the Indonesia Stock Exchange by sampling using purposive sampling technique. This study uses a framework to assess ICD by using pattern classification made by Sveiby (1997). Sveiby (1997) classifies intangibles into three categories, namely internal structure, external structure, and employe competence. Internal Structure includes the organizational structure, legal parameters, manual systems, research and development, and software. External Structure includes trademarks and relationships between customers and suppliers. Employee Competence includes education and training for professional staff is major producer revenue.
Factors thought to affect ICD in this study, namely corporate governance, firm size, profitability, leverage, and company listing age on the Stock Exchange. This study uses a ownership as a proxy for corporate governance. Concentration of ownership is the number of shares of companies that are scattered and owned by several shareholders. Agency theory increases as a consequence of the ownership structure due to the possibility of increasing conflicts between owners. Jansen and Meckling (1976) stated that the company manager of the company's ownership rate is high, and then it is likely to make discretionary/expropriation of resources. The company will be reduced. Agency problem may worsen if the percentage of shares owned by the manager a little.
The size of the company by using the value of total assets presented in the balance sheet of the year. The key assumptions underlying the use of this variable in the model is that firms larger more activity, and usually have a wide variety of business units, each of which has critical success factors and long-term value creation potential of different (Hackstone and Milne, 1996). That is, the more information needs to be disclosed to give a complete picture of a company to the stakeholders.
In addition, the size is also an important variable in explaining the variation in disclosure because of the need to obtain funds with the lowest cost, pressure from shareholders and investment analysts to do a lot more disclosure, more stringent monitoring of the authorities (regulatory authorities), the complexity of the business structure, and greater demand for providing information to various user groups (Haniffa and Cooke, 2002).
Return on Assets is as a proxy of profitability. Companies that obtain a high level of financial performance will earn incentives that encourage them to look different compared with companies that are less profitable and will motivate management to provide more information as it will increase the trust of investors, which in turn, improve management compensation (Singhvi and Desai in Ahmed and Courtis, 1999). One incentive is obtained is the ability to lower the cost of capitalof the company. One mechanism to distinguish those companies that have a high level of profitability with companies that low profitability is by way of voluntary disclosure (Meek et al., 1995). Eng and Mak (2003), Haniffa and Cooke (2005), Freedman and Jaggi (2005), and Swartz and Firer (2005) are measuring of leverage by ratio of debt to total equity. Jensen and Meckling (1976) argued that there is a potential for the transfer of wealth from debtholders to shareholders and managers at companies that level of dependence on debt is very high, giving rise to agency costs high. To reduce the agency costs, the management company may reveal more information on a voluntary basis, including information related to intellectual capital. Thus, voluntary disclosure can be expected to increase along with the increasing levels of leverage. Barnes and Walker in Li et al. (2006) stated that young listed company seeks to obtain additional capital and disclose more information including ICD as compared to older companies listing on the stock exchange.
II. LITERATURE REVIEW AND HYPOTHESIS DEVELOPMENT
A. Resource Based Theory
assets (tangible assets and not intangibles). Belkaoui (2003) suggest a potential strategy to improve the performance of the company is to unify the tangible assets and intangible assets. A resource can be said to have a competitive advantage if it meets the some criterias: (1) these resources allow companies capture business opportunities and overcome the challenges, (2) these resources have unique and difficult to obtain in the market and only a few players are owned by business alone, (3) these resources can be used by companies to provide benefits for the company. Based on Resource-Based Theory approach can be concluded that the company's resources affect the performance of the company which in turn will increase the value of the company. One of the resources owned by the company of an intangible asset that is disclosed is ICl. Thus, the ICD is as a resource of company affects the performance of the company which will ultimately increase the value of the company.
B. Stakeholders Theory
According Deegan (2004: 268) based on the stakeholder theory; organizational management is expected to perform activities that are considered important by stakeholders and report back on these activities on stakeholders. This theory states that all stakeholders have the right to be provided with information about how the activity affects the organization's stakeholders (eg through sponsorship, security initiatives, etc.) even when stakeholders choose not to use the information and even when stakeholders can not directly play a role constructively in the survival of the organization. Furthermore Deegan (2004: 272) states that the stakeholder theory emphasizes the accountability of the organization far exceed the financial or economic performance is simple. This theory states that the organization will choose voluntarily disclose information about environmental performance, social and intellectual organization, over and above the obligatory request, to meet the real expectations or recognized by stakeholders. Ernst and Young (1999) stakeholder theory assumes that the company committed to report on its activities including intellectual capital disclosure to stakeholders, typically aim to maintain balance and sustainability of value creation for all stakeholders.
C. Legitimacy Theory
According Deegan (2004: 254), in the perspective of the theory of legitimacy, a company will voluntarily report their activities if management considers that this is the expected community. Legitimacy theory relies on the premise that there is a 'social contract' between the company and the communities in which they operate. The social contract is a way to explain the large number of people's expectations about how the organization should carry out its operations. Social expectations are not fixed, but change over time. This requires the company to be responsive to the environment in which the company operates. Lindblom (1994) in Ulum (2007) suggested that if an organization considers that its legitimacy is questioned, the organization can adopt a number of strategies that aggressive. First, organizations can find a way to educate and inform stakeholder’s changes in the performance and activities of the organization. Second, organizations can figure out a way to change the perception
of stakeholders, without changing the actual behavior of the organization. Third, organizations can mencaricara to manipulate the perception of stakeholders by directing back (rewind) attention on issues related to other issues and lead to interesting of emotional symbols. Legitimacy theory is closely related to intellectual capital disclosure and is also closely associated with the use of content analysis as a measure of the reporting. The company seems more likely to report IC company if the company has a special need to do so. This may occur when the company discovered that the company is not able to legitimize its status based on tangible assets is generally known as a symbol of the success of the company, (Ulum, 2007). Gutrie et al., (2004) suggested that disclosure can be used by companies to demonstrate management's attention to the values of society or divert the public's attention to the negative effects arise as a result of the company's operations. Thus, disclosure or provision of information on the IC in the financial statements can be used to demonstrate management's attention to the values of society which will further community responded by stock price of a company that has to disclose such information.
D. Intellectual Capital
According Brooking (1996) and Ulum (2008) stated that the IC is the term given to the intangible assets is a combination of market and intellectual property, human-centered and infrastructure that enable the company to function. Roos et al. (1997) and Ulum (2008) stated that the IC includes all processes and assets that are not normally shown on the balance sheet and all intangible assets (trademarks, patents and brands) are regarded as the modern accounting methods. While Bontis (1998) acknowledges that the IC is difficult to understand, but once discovered and exploited, it can give an organization a new resource base to compete and win. Organisation for Economic Cooperation and Development (OECD, 1999) in Ulum (2008) describes the IC as the economic values of the two categories of intangible assets are organizational (structural) capital and human capital. Organizational (structural) capital refers to things such as system software, network distribution, and supply chain. Human capital includes human resources within the organization that labor resources or employees and external resources related to the organization, such as customers and suppliers (Ulum, 2008). Another definition of IC is stated by Sawarjuwono and Kadir (2003) IC can be defined as the sum of what is produced by the three main elements of the organization (human capital, structural capital, customer capital) related to knowledge and technology that can provide more value for the company competitive advantanges. So it can be concluded that IC is a resource company based knowledge and the form of intangible assets that can be used as added value for the company by taking into account human capital, structural capital and customer capital of the company. IC is able to use the company to create innovative and competitive business competition.
E. Components of Intellectual Capital
the proposed scheme Sveiby (1997), Stewart (1997), and Edvinsson and Sullivan (1996). These elements have the same three elements, namely the IC that lies within man, IC inherent in the company, and IC associated with external parties. The third scheme can be seen in table 1 below.
Table 1 Intellectual Capital Component Scheme
Author Human IC Organization IC Network IC
Edvinson Human capital Organizational capital
Customer capital Stewart Human capital Structure Capital Customer
capital such as knowledge, skills, attitudes, and relationships. Demediuk (2002) states human capital is existed in the mind, body, and individual action, and will be lost if they leave the company. The second element which reflects the ability of the company is derived from the system, process, structure, culture, strategy, policy, and the ability to innovate. The third element is the ability gained from relationships with external parties in ways typical, such as connections, undersatanding, loyalty, and business activity. In this study used one framework is more popular understanding of IC, which is a pattern classification made Sveiby (1997). Sveiby (1997) classifies intangibles into three categories, namely internal structure, external structure, and employee competence. Internal structure includes the organistional structure, legal parameters, manual systems, research and development, and software. External structure includes trademarks and relationships between customers and suppliers. Employee competences include education and training for professional staff that are the principal revenue. Framework concept of IC that is used in this study is summarized in table 2 below.
Tabel 2 Framework Intellectual Capital Disclosure
Internal Structure External Structure Employees Competence
F. Intellectual Capital Disclosure (ICD)
The financial report is the final product of accounting and the major media delivery media management information to stakeholders. Financial statements used as a tool of accountability for its authority. The quality of the
financial information reflected in the wide extent of disclosure reports published by companies. Disclosures are grouped into two, namely the mandatory disclosure and voluntary disclosure. Mandatory disclosure is disclosure required by law, in this case the rules established by competent authorities. Voluntary disclosure is a disclosure excluded of the required. Disclosure in the annual report is a source of information for making investment decisions. Investment decision depends on the quality and extensive disclosures presented in the annual report. ICD is one part of the voluntary disclosure. Suwarjuwono (2003) states that the portion of the disclosure of any element of IC, where 30% of the indicators used to express human capital, organizational capital 30% (internal structure) and 40% of customer capital (external structure). Besides the things above, research Guthrie and Petty (2000) showed that (1) ICD more (95%) presented separately and nothing is presented in figures or quantitative. This supports the view that had been strong that intangible assets or IC is difficult to quantify, (2) Disclosure of external capital is mostly done by the company. There is no particular pattern in these reports. Things that many expressed spread among the three elements of IC, (3) Reporting and ICD still done in part and not comprehensive and (4) Overall the company emphasizes that IC is essential for success in the face of future competition. But it can not be translated into a solid and coherent message in the annual report.
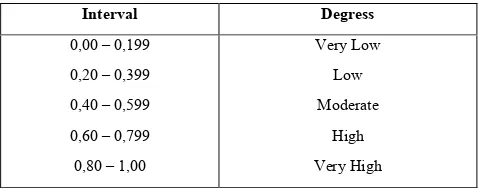
In this study, ICD is used as the dependent variable being the center of attention research. While the factors that affect the ICD are size of the company, the company's profitability, leverage, and a listing age on the Stock Exchange. To determine the high and low levels of ICD used interpretation numbers (Sugiono, 2005: 149), namely:
Tabel 3 Intellectual Capital Disclosure Degrees
of ownership as a proxy of GCG is used in this study. Jansen and Meckling (1976) stated that the company manager of the company's ownership rate is high, then it is likely to make discretionary/expropriation of the resources of the company will be reduced. According Herdinata (2008), the high ownership concentration can be assumed that the high concentration of ownership will be found in the condition in which property rights are not capable of being protected by the state. In the absence of protection from the state, then the company will acquire the controlling authority (power) through the voting right and isentif (through high cash flowright). Useful power affect negotiation and execution of contracts the company towards its stakeholders, including minority shareholders, managers, suppliers, workers, creditors, consumers, and government. On the other hand will have a negative impact because the state can not protect personal rights, where the high concentration of ownership of the company in particular is dominated by family business group will face obstacles such as weak legal system, law enforcement, and corruption.
Business group and control by the family is the means used to conduct transactions where the transaction costs between families or affiliated companies will reduce the level of disclosure of information which it would not have happened if the transactions carried out by parties outside the family relationship or affiliation. Darmawati (2006) mentions the growing concentration of ownership of the company, the majority shareholder will increasingly dominate the company and the more influence on decision making. Shleifer and Wolfenzon (2003) in Darmawati (2006) stated that the weakness of the legal system/protection of investors, the concentration of ownership become a more important tool for addressing the problems of agency. Research Mc Kinnon (in White et al, 2007) explains that there is a significant relationship between the ownership structures of the company's annual report disclosure in Australia. Research McKinnon could not be proved by the research of White et al. (2007) which states there is no influence of ICD practices with ownership concentration, indicating that shareholders may not require reporting accountability from both management and the board of commissioners. In this study the hypothesis related to the concentration of ownership is calculated based on the percentage ownership held by the largest shareholder of the highest.
H. Company Size
The larger company is higher demands for disclosure of information than smaller firms. By revealing more information, companies try to imply that the company has implemented the principles of GCG. Martson in Lordanita (2003) states increased disclosure reduces information asymmetry. Agency costs arise because of conflicting interests of the shareholders, managers and owners of the debt. Purnomosidhi (2005) states the size of the company are used as independent variables with the assumption that larger companies make the activity more and usually have a lot of business units and have the potential for long-term value creation. Large companies more often supervised by a group of stakeholders with an interest in how to manage IC
management owned, such as employees, customers and workers' organizations. Healy et al. (In Sulis, 2007) states a high level of disclosure will lead investors to revise their assessment of the company's stock price, and improve the liquidity of its shares. Healy and Palepu (1993; Skinner, 1994; Walker, 1995; Botosan, 1997) indicates that the higher IC disclosures will provide information that is credible or trustworthy, and will reduce the errors in the evaluation of the company's stock price, while increasing market capitalization. The end result gives a positive correlation between ICD and market capitalization. Robert (1997) suggests the market price multiplied by the number of outstanding shares it will get market value or market capitalization
.
I. Profitability
Haniffa and Cooke (2005) showed that the higher the level of profitability will be even more revealing voluntary information to the public. Because the greater the company's financial support will be more and more disclosure, including ICD. Profitability has a positive influence on corporate disclosure means that the higher profitability of the company the more the intellectual capital disclosure (Ullmann, 1985; Haniffa and Cooke, 2005). Some researchers found a positive effect between profitability and the breadth of disclosure, including ICD (Shingvi and Desai, 1997). The company's profitability is measured by the ratio between profits after tax to total assets of the company. Profitability is an important measure for assessing the company that affects investors to make decisions. One is a profitability ratio Return on Assets (ROA). ROA is one form of a profitability ratio that is intended can measure the overall ability of the company with funds invested in assets that are used to operating companies to make a profit.
J. Leverage
Leverage is a measure of the amount of assets financed with debt is debt used to finance assets from creditors, instead of shareholders or investors. According to Jensen and Meckling (1976) that there is a potential to transfer wealth from the debtholder to shareholders and managers at companies that have a very high level of debt dependency, giving rise to high agency costs. Companies have a high proportion of debt in their capital structure will bear the cost of the agency that is higher than the proportion of companies those small debts. To reduce the cost of the agency, the management company may reveal more information is expected to be increasingly meningkan along with the high level of leverage. Agency theory predicts that firms with higher leverage ratios will reveal more information, because the cost of agency companies with capital structure as it is higher (Jensen and Meckling, 1976) in Marwata (2001).
K. Period of Listing on the Stock Exchange
level of investor confidence. The young company has a greater desire to reduce skepticism and remind investor confidence (Haniffa and Cooke, 2002).
L. Hypothesis Development
I) Effect of Corporate Governance on ICD
In a study, concentration of ownership is used to proxy of GCG. Ownership is a company whose shares are owned by a few scattered and shareholders. Jansen and Meckling (1976) stated that the company manager of the company's ownership rate is high, then it is likely to make discretionary or expropriation of the resources of the company will be reduced. The first hypothesis in this study is corporate governance effect on ICD
II) Effect of Firm Size on ICD
Listing age is expected to have a positive relationship to the quality of corporate disclosure including ICD. The underlying reason is the company that was older have more experience in publishing financial statements. Companies that have more experience will be more aware of the need for company information. White et al. (2007), explains that there is a significant relationship between listing age on ICD. The second hypothesis in this study is company’s size affect on ICD
III) Effect of profitability on ICD
Haniffa and Cooke (2005) showed that the higher the level of profitability will be even more revealing voluntary information to the public. Because the greater the company's financial support will be more and more disclosure, including ICD. Profitability has a positive influence on corporate disclosure means that the higher profitability of the company the more the ICD (Ullmann, 1985; Haniffa and Cooke, 2005). Some researchers found a positive effect between profitability and the breadth of disclosure, including ICD (Shingvi and Desai, 1997). The third hypothesis in this study is profitability effect on ICD
IV) Effect of Leverage on ICD
Jensen and Meckling (1976) argued that there is a potential for the transfer of wealth from debtholders to shareholders and managers at companies that level of dependence on debt is very high, giving rise to agency costs high. To reduce the agency costs, the management company may reveal more information on a voluntary basis, including information related to IC. Voluntary disclosure can be expected to increase along with the increasing levels of leverage. This phenomenon is supported by some of the results of empirical research, for example Belkaoui and Karpik (1989), Roberts (1992), Meek et al. (1995), Cormier and Magnan (1999), and Williams (2001), which examines the effect of leverage on ICD. However, research results have not been conclusive because there are few studies (eg Chow and Wong-Boren, 1987; Raffounier, 1995; Kokubu et al., 2001; Eli-Jido-Ten, 2004; Khanna et al., 2004) which it can not prove the leverage effect on the level of disclosure. To maintain consistency with previous research, this study also includes a variable leverage to be re-examined its influence on the intellectual capital disclosure made public companies in
IDX. The fourth hypothesis is level of leverage effect on ICD.
V) Effect of listing age in the Stock Exchange on ICD
Companies that are able to manage their intellectual resources believed to be able to create added value and be able to create competitive advantage in innovation, research and development that will lead to increased efficiency of the company. This is similar to the concept of Resource-Based Theory. Meanwhile, from the standpoint of Stakeholder Theory stated that corporate managers will seek to obtain value added which would then be redistributed to all stakeholders. Therefore, stakeholders will act as a control in order to use and management of company resources including intellectual resources. The fifth hypothesis in this study is listing age effect on ICD.
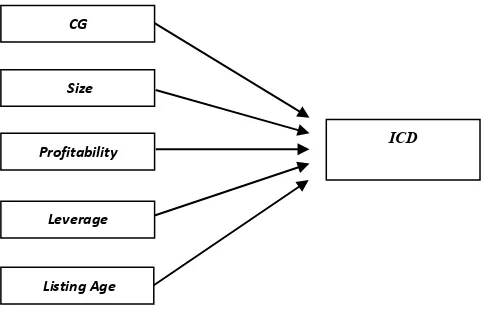
M. Theoritical Framework
In this study, researchers wanted to analyze how the practice of ICD in service companies listed in Indonesia Stock Exchange and the factors that affect of this disclosure. The framework in this study can be seen in Figure 1
Independent Variable Dependen Variable
Figure 1 Theoritical Framework
III. RESEARCH METHODOLOGY
A. Population and Sample
Population in this study is a services company listed on the Indonesia Stock Exchange. The number of service companies listed in Indonesia Stock Exchange as many as 179 companies. Sampling method in this study was conducted with a purposive sampling method in order to obtain samples representatives in accordance with the specified criteria. The criteria used to select of samples are (1) Company services listed in Indonesia Stock Exchange in a row from 2009 - 2013, and (2) publish annual reports (annual report) complete for 5 consecutive years from 2009 - 2013. The number of service companies listed in Indonesia Stock Exchange that meets the criteria of the sample in these study as many as 135 companies.
Profitability
Leverage
Listing Age Size
B. 3.2 Types and Sources of Data
Type of Data used in this research is secondary data published documentary, which is an annual financial report service companies listed in Indonesia Stock Exchange from 2009 - 2013. Secondary data is a source of research data obtained by researchers indirectly through an intermediary medium (obtained and recorded by others). Secondary data is generally in the form of evidence; records or historical reports that have been prepared in the archives (documentary data) published and unpublished (Indriantoro and Supomo, 2002: 147).
C. 3.3 Variable Measurement
The dependent variable in this study is the intellectual capital disclosure. White et. al. (2007) suggested that a key research on ICD is the opinion of the disclosure controls on intangible values such as software employee knowledge, customer relations, strategic vision and management of intellectual property. ICD is an important way to report on the nature of the intangible value that is owned by the company. Framework of ICD used in this research that the framework proposed by Sveiby (1997). There are 25 items in the framework of which 9 items concerning the internal structures, 10 items of external structures, and 6 items of employee competence. Each item is given a scoring index, for each company, value of 0 is used to indicate that there is no information about the attributes in the annual report. A value of 1 indicates that there is information about the attributes in the annual report.
ICD Index = (Σdi/M) x 100% Where as
ICD Index = Intellectual Capital Disclosure Index
di = 1 for disclosure item jika item in ICD framework, 0 for no discoluse
M= Total item in ICD framework (25 item).
The independent variable is the variable that was the cause of the dependent variable. Independent variables used in this study are the size of the company, the company's profitability, leverage, and a listing on the Stock Exchange.
Corporate governance is proxied by ownership (ownership) are measured using the percentage of shares owned by the three major shareholders and are known (ownership diffusion) which draws on research Oliveira et al. (2008).
Ownership = (number of 3 major shareholders / number of shares) x 100%
The size of the company described the company scale shown in the balance sheet value of the total assets in the end of the year. Total assets are used in measuring the size of the company to determine the potential effect of firm size on the amount of intellectual capital.
Profitability is an important measure for assessing the company that affects investors to make decisions. The ratio is the ratio of the company's profitability as measured by the ratio between profits after tax to total assets of the company. In this study the company's profitability is measured by one
of the profitability ratios of Return on Assets (ROA). ROA is one form of a profitability ratio that is intended can measure the overall ability of the company with funds invested in assets that are used to operating companies to make a profit. This ratio can be calculated by the formula:
ROA = Net Income / Total Assets x 100%
Leverage indicates the proportion of the use of debt to finance the company's investment. The higher the number the leverage, the higher the company's dependence on debt so that the greater the risks faced and investors will ask for higher profit level. In this study, leverage is measured by using a debt-to-equity ratio (DER). The formula to calculate DER is:
DER = (Total Debt)/Total Equity) x 100%
The listing period is calculated from the date of listing the company on the Stock Exchange listed company until the date of December 31, 2012, in a matter of years. The company must fully and consistently listed at least 4 consecutive years is listed on the Stock Exchange, use the index as measured by using a logarithmic time of listing the company on the Stock Exchange
.
D. 3.4 Data Analysis Methods
Regression modeling is used for the purpose of this study was to determine the relationship between the dependent variable and one or more independent variables (Brooks, 2005). Data processing techniques used in this research using panel data regression. The author will use panel data in this study, where there are only 5 study period is 2009 to 2013 with one dependent variable and 5 0f the independent variable.
The research model regression is OLS and GLS analysis with the help of software EViews 7. To analyze the data, the authors conducted a descriptive statistical analysis to determine the limits of the regression model, R2 testing and regression testing of hypotheses on the results of using the t-statistic and F-t-statistics.
I) Data Panel
using panel data we will generate a different intercept slope coefficient at each company and each period of time. Therefore, in estimating equation will depend on the assumptions made about the intercept, the slope coefficient and the disturbance variables. According Widarjono (2013) there are several possibilities that will arise (1) Assuming the intercept and the slope is fixed all the time and people (companies) and the intercept and slope difference is explained by the variable disturbance, (2) Assume the slope is fixed but different intercepts between individuals, (3) It is assumed fixed slope but different intercepts both over time and between individuals, (4) Assume the intercept and slope differ between individuals, and (5) Assume the intercept and slope differed between time and between individuals. There are several methods used to estimate the regression model with panel data. Three methods are commonly used to estimate panel data regression model, namely the Common Effect (Pooled Ordinary Least Square), Fixed Effects and Random Effects.
II) Common Effect Methods (Pooled Ordinary Least Square)
The modeling approach with the usual OLS method is the simplest method to estimate these methods assumes every company has the same slope and coefficient (there is no difference in the dimensions of the cross section). So it can be said that the constant alpha value and the same data for each cross section data means data panel regression results generated will apply to every company. In this approach does not pay attention to the individual dimension or time. It is assumed that the behavior of the same data between companies in different period of time.
III) Fixed Effect Methods
The fixed effect method, the intercept in the regression model can be distinguished among individuals because each individual cross section is assumed to have its own characteristics. In distinguish intercept dummy variables that can be used this method is also known as the Least Square Dummy Variable (lSDV) Model. However, the disadvantage of this method when the greater number of cross section data, it will make greater degress of freedom by introducing N dummies. There are several possibilities in this method, namely (1) All constant coefficients according to time and individual (2) The slope coefficient is fixed, but the intercept to vary between individuals (3) The slope coefficient is fixed but different intercepts between individuals over time (4) all coefficients (slope and intercept) differ between individuals (5) All coefficients (slope and intercept) differ between individuals over time intercepts between different individuals, it can be used a dummy variable differential.
IV) Methods of Random Effect
As an alternative to the fixed effect method, also known as the random effect method. The inclusion of dummy variables in the fixed effect aims to represent our ignorance about the actual model. However, this is also a consequence reduced degrees of freedom, which in turn reduces the
efficiency parameter. This problem can be overcome by using a variable disturbance (error term).
V) Selection of Model Estimation
Based on the above explanation it is known that there are three approaches to model the data panel. In choosing the model is valid, then it can be done three test phases that determine which method is most appropriate. Selection is intended that the approach chosen is suitable for purposes of research and is also suitable to the characteristics of the sample data that is used so that the estimation process provides more precise results. The three stages of the test are as follows:
VI) Selection theoretically
Common method of constant used simply to describe the phenomenon. It must be choose between the fixed effect methods with random effect method. The determination can be done theoretically by looking at the correlation i error component and X asbetween the individual cross section, regressors (Gujarati, 2004). i and X are uncorrelated, then the random effect method used. Assuming i and X correlates the most appropriate method is using fixed effect. Conversely, the excess on the fixed effect method does not need to assume that the error components are not correlated with the independent variables that may be difficult in the meet (Nachrowi and Usman, 2007).
VII)Selection of the sample on the basis of research data
If it turns out theoretically discovery model can not provide an answer precisely, the basis and then model selection based on the sample. If the sample data were taken on a random population it is more appropriate to use the method of random effects. When selecting a data sample has been determined based on the existing population, the election was fixed effect method appropriately used? In addition, the amount of cross section data with time series data can also determine which one is more appropriate modeling used. If the number of T (time series) is greater than the sum of N (cross section), then the fixed effect method is preferred. When the number N is greater than the sum of T, it used a random effect in the processing method (Gujarati, 2004).
VIII) Selection of the formal test statistics
Formal testing can be done. Fixed effect method with constant common method can be tested with the (incremental) F-Test or use LM-Test, while the random effect method with constant common method was tested by Lagrange Multiplier (LM) test (Breusch and Pagan, 1980 in Gujarati, 2004) with hypothesis:
H0: Methods common effect
H1: Method fixed effect
While The Hausman specification test (Hausman, 1978 in Gujarati, 2004) comparing the fixed effect method with random effect method with the hypothesis:
H1: Method fixed effect
Multiple linear regression models proposed in this study to predict the relationship between the independent variables and the dependent variable, namely:
ICD = β0 + β1GCGi + β2LogASSETi + β3ROAi + β4LEVi + β5LogLISTINGi + εi
In which:
ICD = Intellectual Capital Disclosure
GCG = Concentration of Ownership
LogASSET = Log of Total Assets
LogLISTING = Log Listing Age on the Stock Exchange
ROA = Profitability (Return on Assets)
LEV = Level Leverage εi = error term
β = coefficient
IX) The coefficient of determination (R2)
The coefficient of determination is an important measure in the regression because it can inform whether or not the regression model terestimasi. Coefficient of determination reflects how much variation of the dependent variable (Y) can be explained by the independent variable (X).
X) Hypothesis Testing
The process of analysis to be performed consists of testing explanatory variables, ie testing the significance of explanatory variables individually (t-statistic test) and testing explanatory variables together (testing the F-statistic). The first test was carried out with the t-statistic, statistical t-test performed to see the significance of the influence of the individual explanatory variables on the dependent variable. Statistics F-test shows whether all the independent variables included in the model have jointly influence on the dependent variable.
IV. RESULTS AND DISCUSSION
A. Sample Overview
Samples companies in this study are a service company listed on the Indonesia Stock Exchange. Samples services company consists of 15 sectors as many as 131 companies which consists of 26 companies engaged in the banking sector, 9 companies in the financial institutions sector, 8 companies in the sector securities firms, 9 companies in the insurance sector, 6 companies in the sector of investment funds/mutual funds, 22 companies in the property sector and real estate, 1 company in the energy sector, five companies in the telecommunications sector, 7 companies in the transport sector, three companies in the airport, highway seaports, one constructs in non-construction sector, 18 companies in the sector hotel, restaurant and tourism, 7 companies in the sector of printing, media and advertising, 6
companies in the investment sector, and 3 companies in the service sector computers and other devices.
B. Analysis of ICD Practices in Indonesia
ICD classify according to pattern classification by Sveiby (1997) in which the ICD classified into three categories, namely internal structure, external structure, and employee competence. Category of Internal Structure consists of 9 items disclosure, External Structure category consists of 10 items of disclosure, and Employees Competence category consists of 6 items disclosure. The results of this study indicate that each category of items disclosure by the sample companies have a level of disclosure that is different. Service companies in this study consisted of 131 companies, with a 5-year observation period from 2009 to 2013. The frequency ICD of 131 companies for services based on three categories of classification (25 items disclosure) by Sveiby (1997) in this study is in appendix 1.
Based on the analysis in the annual report of the company, IC items most widely disclosed by the company in this study is the management philosophy is an average 96% of the 131 companies and least disclosed is patent, only PT. Telekomunikasi Indonesia, tbk of 131 companies disclose of patent.
Percentage of ICD on Internal Structure category for each item that is as much as 0.23% of patents, copyrights as much as 0.46%, as much as 2.47% of trademarks, management philosophy as much as 28.77%, 17.66% as much as the corporate culture, information systems as much as 12.26%, 25.48% as management processes, networking systems as much as 11.76%, and research projects as much as 0.91%.
Percentage of ICD on Disclosure External Structure category for each item that is as much as 11.62% brands, customers as much as 13.55%, 10.29% as many customers loyalty, company names as much as 20.73%, distribution channels as much as 23.02 %, business collaboration as much as 2.96%, favorable contracts as much as 7.18%, as much as 4.00% of financial contracts, licensing agreements as much as 4.37%, and franchising agreements as much as 2.29%. Item distribution channel has the highest level of disclosure than other items in the category of Employees Competence.
Percentage of ICD on Competence Employees category for each item that is know-how as much as 21.67%, 21.32% as much education, vocational qualification as much as 15.58%, work-related knowledge as much as 18.76%, much work related competence 20.82%, entrepreneurial spirit as much as 1.84%. Item know how to have the highest level of disclosure than other items in the category of Employees Competence.
C. Panel Data Regression Analysis
common effect models with fixed effect models while to choose between the fixed effect models with random effects models can use the Hausman Test.
Chow Test (Common/Pool Effect Model versus Fixed Effect Model)
Testing Chow Test was used to compare between the common/pool effects models with fixed effect model as the most suitable model for panel data analysis. The decision rules in testing Chow Test is as follows:
H0: Common effects
H1: Fixed effect model
Based on the analysis results, the Chow test value is 22.773 with a probability of 0.0000 or less than α = 5%, so Ho is rejected and concludes fixed effect models as a more appropriate analysis technique. Chow Test results are presented in detail in table 5.
Table 4 Testing Results between Common/Pool Effect Models versus Fixed Effect Model via Chow Test
Sources: Research Result (Process, 2014)
Hausman Test (Fixed Effect Model versus Random Effect Model)
Selection of Fixed Effect Model Random Effect Model VS can use formal test using the Hausman Specification Test (Hausman, 1978 in Gujarati, 2004). According Widarjono (2013) Hausman test is based on the idea that both OLS and GLS consistent but inconsistent OLS and GLS. Therefore test the null hypothesis is not the result of two different estimations so Hausman test can be performed based on different estimates.
Statistics Hausman test statistic follows the Chi Square distribution with degree of freedom as much as k where k is the number of independent variables. If the value of the Hausman statistic is greater than the critical value, the exact model is the fixed effect model, while conversely if the value of the Hausman statistic is smaller than the critical value, the exact model is the random effect model.
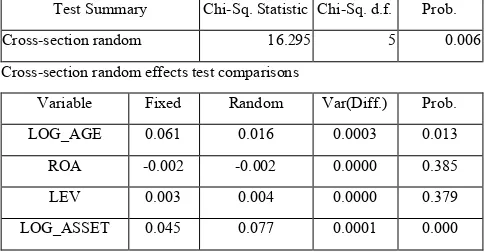
Tabel 5 Testing Result between Fixed Effect Model versus Random Effect Model via Hausman Test
Test Summary Chi-Sq. Statistic Chi-Sq. d.f. Prob.
Cross-section random 16.295 5 0.006
Cross-section random effects test comparisons
Variable Fixed Random Var(Diff.) Prob.
LOG_AGE 0.061 0.016 0.0003 0.013
ROA -0.002 -0.002 0.0000 0.385
LEV 0.003 0.004 0.0000 0.379
LOG_ASSET 0.045 0.077 0.0001 0.000
GCG -0.016 0.002 0.0001 0.136
Sources: Research Result (Process, 2014)
From table 5, it can be seen that the Chi Square value of 16.2949 with a probability value of 0.0061, while the critical value of Chi Square with degree of freedom at 5 at α = 5% at 11.07 so Chi Square value is greater than the critical value Chi Square or 16.2949> 11.07. So based on Hausman test the exact model used in this study is the Fixed Effect Model.
In addition to using the Chow Test and Hausman Test, based on the results of using a common effect regression models, the fixed effect model and random effect model, by comparing the results of the estimation of three different models, the views of the goodness of fitnya (R2, Adjusted R-squared), t statistics and F statistics reinforces the election fixed effect models. Comparison of the results with a common effect model, fixed effect, and random effect can be seen in appendix 2.
D. Overview of the End Selection Models
Selection of panel data regression model right has been done by Chow Test, Hausman Test, and by comparing the results of the estimation of three different models, seen from the goodness of fit (R2, Adjusted R-squared), t statistics and F statistics. In addition, through the classical assumption test results that have been done, it can be concluded that regression model used in this study feasible because the model does not happen multicollinearity, no autocorrelation, and not the heterocedastisity. Through the stages that have been made, the selection of late model used in this study is the fixed effect model with White Test which can be interpreted in appendix 3. Based on panel data regression output, the equation of this study can be formulated as follows
ICD = β0 + 0,061GCG + 0,045LnASSET + 0,002 ROA - 0,002LEV + 0,0612LnLIST + εi
E.
Coefficient of determination(R2)
The coefficient of determination (R2) reflects the influence of changes in the independent variables in explaining the change in the dependent variable variables) together, with the aim to measure the truth and the good of the relationship between variables in the model used. The magnitude of the coefficient of determination is between 0 and 1 (0 <R2 <1), where the coefficient close to 1, then the model is said to be good because of the close relationship between the independent variable and dependent variable. Test results the coefficient of determination (R2) and Adjusted R2 can be seen in the table 6 below:
Table 6 Coefficient of Determination (R2)
R-squared 0.895535
Adjusted R-squared 0.868362
Sources: Research Result (Process, 2014)
Model estimation results show the adjusted R-squared value of 0.868362, it is meaning that approximately 86.83% of the variation ICD is influenced by variations determinant Effects Test Statistic d.f. Prob.
Cross-section F 22.77 (130,519) 0.0000
variables in the model, namely corporate governance, firm size, profitability, leverage, and a listing of companies in Indonesia Stock Exchange, while the remaining 13.17% is explained by other variables not included in this model.
F. Results and Discussion Hypothesis Test F-Statistics
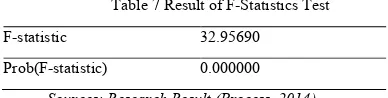
Testing F-statistic is used to test the significance of all the independent variables as a whole or to measure the influence of the independent variables simultaneously. Tests carried out using the F distribution in the table 7 below:
Table 7 Result of F-Statistics Test
F-statistic 32.95690
Prob(F-statistic) 0.000000
Sources: Research Result (Process, 2014)
Based on table 7, it can be seen independently of GCG, firm size, profitability, leverage, and a listing of companies on the Stock Exchange are simultaneously influencing ICD. It can be seen from the value of the F-count and the F-table. From above table can be shown that the value of F-test is 32.95690 while the F-table value is 2.22791 (sig. 0.05, DF1 = k-1 or 6-1 = 5, DF2 = nk or 655-6 = 649, k is the number of variables). So F-count> F-table or 32.95690> 2.22791 with a significance level of <0.05 (α = 5%) or Prob (F -statistics) 0.00000 then H0 is rejected and H1 is accepted. In conclusion, namely corporate governance, firm size, profitability, leverage, and company listing age on the Stock Exchange are simultaneously influencing of ICD.
Test T-Statistics
The first test was carried out with the t-statistic. Statistical t-test performed to see the significance of the influence of the individual explanatory variables on the dependent variable. Result of t-test in table 8 below:
Table 8 Result of t- satatistics Test
Variable Coefficient Std. Error t-Statistic Prob.
ICD -0.255 0.151 -1.683 0.093
LOG_AGE 0.061 0.015 4.033 0.000
ROA 0.003 0.002 1.621 0.106
LEV -0.002 0.001 -3.678 0.000
LOG_ASSET 0.045 0.014 3.344 0.001
GCG -0.016 0.025 -0.632 0.528
Sources: Research Result (Process, 2014)
Overall results of hypothesis testing using panel data regression analysis can be seen in the following table:
Table 9 Summary of Hypotehesis Testing
Code Hipotesis Result
H1 Effect of GCG on ICD Rejected
H2 Effect of Company Size on ICD Accepted
H3 Effect of Profitability on ICD Rejected
H4 Effect of Leverage on ICD Accepted
H5 Effect of Listing Age on ICD Accepted
Sources: Processing Data (2014) I) Result Discussion
Level of ICD practices based on empirical testing has been done on several hypotheses, suggesting that the level of practice is influenced by several factors (independent variables), but not all of the independent variables have significantly influence the level of ICD. Factors have significantly influence to ICD namely Company Size, Level Leverage, and Company Listing Age on the Stock Exchange.
II) Analysis of ICD Practice in Services Company in Indonesia Stock Exchange
Based on the annual report tracking services company that has been published through the IDX website, it can be concluded that the overall practice of ICD has been done by the service companies listed in Indonesia Stock Exchange, but the level of ICD practices are not exhaustive and is still relatively low at 35,20%. The results of the level of disclosure in each of the different disclosure items closely related to the industrial sector of the sample firm moves and lack of standardization in the ICD. Item disclosure is at most management philosophy. Management philosophy expressed much, because there is a necessity for companies to disclose management philosophy in the financial statements. Item disclosure least that patent. Patents at least disclosed because the service companies in the study sample was not all companies have the capital in the form of patents. Employee’s competence consists of 6 items. Items that are most widely expressed that know-how that is with an average of 97 companies from 131 companies. Item disclosure least in the category of competence employess that entrepreneurial spirit. On average companies that reveal the entrepreneurial spirit of employees in this study only 8 companies. External structure consists of 10 items of disclosure. Disclosure items are items most distribution channels are as many as 62 from 131 companies. Item disclosure least that franchising agreements are only 7 companies from 131 companies. Franchising agreements disclosed because at least in service companies in the study sample was not all companies have the capital in the form of franchising agreements
.
III)Simultaneously Testing
The independent variables consist of corporate governance; firm size, profitability, leverage, and a listing of companies on the Stock Exchange are simultaneously influencing variables ICD. Based on the results of the adjusted R-square of about 86.83% of the variation ICD variables are influenced by variations determinant variables in the model, namely GCG, firm size, profitability, leverage, and a listing of companies on the Stock Exchange, while the remaining 13.17% is explained by other variables not included in this model.
IV)Influence of Corporate Governance on ICD
ownership of the company, the majority shareholder will increasingly dominate the company and increasingly influential in decision making. Agency theory assumes that all individuals acting on their behalf. The agents are assumed to receive the satisfaction not only of financial compensation but also of the terms involved in the agency relationship as generosity amount of free time, attractive working conditions and working hours are flexible. Principal assumed to be interested only in the increased financial results of their investment in the company.
Results of linear regression analysis using panel data indicate that ownership concentration does not significantly affect the ICD. The greater the level of ownership of the shares held by the shareholders, the greater voting power held in decision making. The results of this study indicate that the hypothesis about the influence of the concentration of ownership of the ICD rejected. The results of this analysis support the research of White et al. (2007) and Layla (2009) which states that there is no significant effect concentration of ownership on ICD. White et al study. (2007) ICD analysis is using the framework Bukh et al. (2005) which consists of 78 items disclosure showed that there was no significant correlation between the concentrations of ownership of ICD. This is due to the low level of awareness of the company in voluntary ICD. Similarly, in a study Layla (2009) who analyzed the ICD on 90 non-financial companies listed on the Indonesia Stock Exchange in 2007 which showed that there was no significant effect of concentration of ownership of the voluntary ICD. Although different periods of observations made by this research that in 2009 to 2013, it indicates that up to the period of observation in 2013 shows that awareness of the company in the disclosure of ICD is still relatively low.
V) Influence of firm size on ICD
Results of analysis using multiple linear regression showed that the size of the company which is proxied by total assets has significantly affect the ICD. The greater the level of assets will be the greater the voluntary ICD. Consistent with previous research conducted by Guthrie et al. (2007) and Mangena et al. (2010) which showed the size of the company has significant positive effect on the breadth of ICD. The larger the company will be the higher the level of ICD in the annual report. So also with the results of this study which states that the size of the company has a significant effect on ICD. This is because the larger the company, the greater the attention or the attention of stakeholders to the ICD. Attention of these stakeholders will be higher the greater the company because of the impact the economic influence, social and other aspects of the larger. Therefore, more and more companies are required to report information including the ICD. Large companies are entities that much highlighted by the market as well as the general public. Disclose more information is part of the company's efforts to realize the public accountability. Other explanations are also often asked is because big companies have huge resources, so the company needs and is able to finance the provision of information for internal use. Such information as well as a material for purposes of disclosure of information to external parties, so there should be no
significant additional cost to be able to do a more complete disclosure. Companies with relatively small resources may not have the information ready as large companies, so there needs to be additional costs relatively large to be able to do a complete disclosure of the company great. Many smaller firms are in a situation of intense competition with other companies. Reveal too much about his identity to external parties can jeopardize its position in the competition so that small firms tend not to perform as complete disclosure of a large company.
VI)Influence the profitability on the ICD
The level of profitability of the company indicated by ROA, no significant effect on the level of ICD companies in the annual report. According to signaling theory states companies with high performance (good company) use financial information to send signals to the market (Spence, 1973). The average level of profitability in this study was 5.3%, which indicates the level of profitability (ROA) sample is greater than the minimum standards set by Bank Indonesia at 1.5%. In accordance with the signaling theory which states that companies with high performance using financial information to send positive signals to the holder. So through ROA levels have been reported in the company annual report does not require companies to report additional financial disclosure is voluntary non ICD. In this study, the level of profitability does not significantly influence the voluntary ICD. This is due to the high profitability performance in the company, so that companies tend not to make voluntary disclosures, because the financial information in the annual report has been able to give a positive signal to the shareholders.
VII) Influence the level of leverage on ICD
The results of this study proved the level of leverage significant influence with a positive coefficient. This indicates that firms with high leverage ratios have an obligation to meet the information needs of long-term creditors. Jensen and Meckling (1976) argued that there is a potential for the transfer of wealth from debtholders to shareholders and managers at companies that level of dependence on debt is very high, giving rise to agency costs is high. To reduce the agency costs, management companies can disclose more information voluntarily, including information related to intellectual capital. Moreover, according to the theory of legitimacy suggests that voluntary disclosure can be used by companies to demonstrate management's attention to the values of society (societal values) that can divert public attention to the negative impact arising from the company's operations such as high levels of leverage. Voluntary disclosure is expected to increase along with the increasing levels of leverage. This phenomenon is supported by some of the results of empirical research, for example Belkaoui and Karpik (1989), Roberts (1992), Meek et al. (1995), Cormier and Magnan (1999), and Williams (2001), which examines the effect of leverage on ICD.
VIII) Influence of Company Listing Age on ICD