EXTENSION AND EVALUATION OF THE AGAST FEATURE DETECTOR
Hongmou Zhang∗, J¨urgen Wohlfeil, Denis Grießbach
German Aerospace Center, Rutherfordstrae.2, 12489 Berlin - (Hongmou.Zhang, Juergen.Wohlfeil, Denis.Griessbach)@dlr.de
KEY WORDS:Feature detector, Vision-aided inertial navigation, AGAST, IPS, KLT
ABSTRACT:
Vision-aided inertial navigation is a navigation method which combines inertial navigation with computer vision techniques. It can provide a six degrees of freedom navigation solution from passive measurements without external referencing (e.g. GPS). Thus, it can operate in unknown environments without any prior knowledge. Such a system, called IPS (Integrated Positioning System) is developed by the German Aerospace Center (DLR).
For optical navigation applications, a reliable and efficient feature detector is a crucial component. With the publication of AGAST, a new feature detector has been presented, which is faster than other feature detectors. To apply AGAST to optical navigation applications, we propose several methods to improve its performance. Based on a new non-maximum suppression algorithm, automatic threshold adaption algorithm in combination with an image split method, the optimized AGAST provides higher reliability and efficiency than the original implementation using the Kanade Lucas Tomasi (KLT) feature detector. Finally, we compare the performance of the optimized AGAST with the KLT feature detector in the context of IPS. The presented approach is tested using real data from typical indoor scenes, evaluated on the accuracy of the navigation solution. The comparison demonstrates a significant performance improvement achieved by the optimized AGAST.
1. INTRODUCTION
IPS was developed for real-time vision-aided inertial navigation (Grießbach, 2014), especially under conditions where external referencing is not available, such as for indoor environments, un-derground, etc. It has been shown that IPS can output the trajec-tory accuracy of about2m/√h; that means, for our test database with 410 meters track (about 6.8 minutes), the 3D error is about 0.65 meter (Grießbach et al., 2014). In order to improve the ac-curacy and the real-time processing ability of IPS, we explore to replace old KLT feature detector working inside IPS with the new AGAST (Mair et al., 2010) feature detector. This paper describes our work and the experimental results.
A reliable and efficient feature detector is a crucial component for various computer vision applications, such as object tracking, image matching and registration, optical navigation and localiza-tion, etc. Therefore, a large number of feature detectors have been proposed (Harris and Stephens, 1988, Shi and Tomasi, 1994, Lowe, 2004, Bay et al., 2006). However, because of the demand for real-time processing based on poor computational resources, many feature detectors cannot meet the requirements needed for optical navigation.
2. FEATURE DETECTOR REVIEW
There exist many different methods to extract image features that are suitable for tracking them in an image sequence. The method ”good features to track”, proposed by Shi and Tomasi (Shi and Tomasi, 1994), usually called KLT feature detector is based on the early work of Lucas and Kanade (Lucas et al., 1981). KLT uti-lizes the Harris matrix to calculate the eigenvalues of each pixel. The pixel whose smaller eigenvalue is greater than a threshold is defined to be a well trackable image feature. This condition as-sures that KLT features lie on corners and blobs, which are locally
∗Corresponding author
distinctive points. Although KLT outputs high-quality features, calculating the Harris matrix is a computational expensive task. Based on our testing, the KLT feature detector needs about 15ms on one image with a resolution of 680×512 pixels. Due to its complexity KLT is not suitable for many applications requiring high frame rates.
Another feature detector is Features from Accelerated Segment Test (FAST) proposed by Rosten and Porter (Rosten and Drum-mond, 2005). FAST is based on a characteristic feature criterion accelerated segment test (AST). The method AST considers a cir-cle of 16 pixels constituting a discrete circir-cle around the center pixel. It compares each pixel’s intensity on a circle with the cen-ter pixelP. If there exist more thanSconnected pixels on the circle with intensities greater thanP’s intensity plus a threshold T, or all of them less thanP’s intensity minus a thresholdT, the center pixel is considered a feature. T is a user defined thresh-old. In (Rosten et al., 2010) shown whenSequal 9 has a high efficiency and reliability compare with else values. Based on this concept, FAST is an order of magnitude faster than other feature detectors such as SIFT (Lowe, 2004), SURF (Bay et al., 2006), etc.
FAST has obvious advantages from many points of view. How-ever, there is still an imperfection that limits FAST to be used in optical navigation applications. FAST is enhanced by a ma-chine learning algorithm ID3 (Quinlan, 1986), for the purpose of improving processing speed. ID3 is a method used to generate a decision tree from a training dataset. FAST needs to be trained on an image dataset from the environment where it works, and then get a decision tree to classify each center pixel to be a feature or not. However, this method cannot guarantee each combination of pixels to be found; this may produce incorrect results. Fur-thermore, the FAST feature detector has to be trained every time the working environment changes. This weakness restricts FAST to work on computer vision systems such as IPS (Grießbach et al., 2012), which shall work without any prior knowledge of the environment.
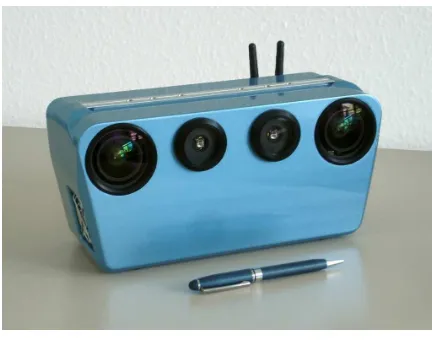
Figure 1: IPS prototype
Generic Corner Detection Based on the Accelerated Segment Test (AGAST) feature detector is proposed by Mair and Hager (Mair et al., 2010). AGAST is based on the same AST feature criterion as FAST, but uses a different decision tree. AGAST is trained based on a dataset that includes all possible combinations of 16 pixels on the circle. This ensures that the decision tree works in whatever environments. Moreover, AGAST introduces a dy-namic tree switching algorithm, which automatically changes the decision trees. One tree is trained under homogeneous areas, and the other is trained under heterogeneous areas. In this way, the performance of AGAST increases for random scenes. By com-bining these two improvements, AGAST works in any arbitrary environments without any training steps. This makes AGAST very promising for IPS and other real-time computer vision ap-plications.
3. IPS AND PREVIOUS WORK 3.1 Integrated Positioning System
IPS is a portable research device developed by the German Aero-space Center (DLR), which provides a real-time vision-aided in-ertial navigation solution. IPS is designed to work in indoor envi-ronments but it also works in outdoor envienvi-ronments. The output of IPS is a 6 DOF trajectory that includes the position and ori-entation. Furthermore a high-density 3D points cloud of the sur-rounding can be produced. IPS is capable to record sensor data (video sequences, inertial data, etc.) for a later off-line process-ing. This is very useful for testing and evaluation purposes.
IPS consists of multiple sensors including stereo cameras, a micro-electromechanical IMU (MEMS), an inclination sensor, and two NIR LEDs light source in case of bad light conditions. In addi-tion, IPS also takes the interface for other sensors, for example, GPS, barometer and so on, for the purpose of redundancy and more accuracy. However, IPS does not rely on external refer-ences, but can make use of them if available. Figure 1 shows the prototypic senor head used.
Figure 2 shows the software flow of the IPS system. The image data from the stereo cameras is handled by the feature detector and the stereo matcher. A data processing chain is set up, to fuse low-level sensor data by means of a Kalman filter to obtain ego-motion information.
This research focuses on the feature detector, where a KLT fea-ture detector was used until now. To improve the processing speed and the trajectory accuracy of IPS, the AGAST feature de-tector was used to replace the KLT feature dede-tector. We propose
several optimizations enabling AGAST to meet the requirements of IPS, and improve the performance and reliability of the origi-nal AGAST.
Figure 2: The data flow of IPS system
3.2 Optimization of AGAST
AGAST adopts the non-maximum suppression algorithm inher-ited from FAST, using a 3×3 square mask sliding over all fea-tures, and suppress low rating features in neighborhood area (Ros-ten and Drummond, 2006). However, even after the suppression more than 600 features per image remain with a threshold of 15. Although a higher threshold could decrease the number of fea-tures, this results in many features close together in structured areas of the image but no remaining features in the less struc-tured areas. This is suboptimal because the accuracy of the op-tical navigation strongly depends on a good distribution of fea-tures over the image (Grießbach et al., 2014). At the same time, the number of features shall be kept low because it unnecessarily increases the processing time needed to track them without a sig-nificant improvement of accuracy. In order to achieve real-time processing, the ideal feature numbers are around 100. On the other hand, during the whole navigation process, the scene con-stantly changes. Different scenes needs different feature detector threshold. Therefore, an algorithm that calculates thresholds for various sub-areas as well as for changing scenes is an essential part of feature detector for IPS. The algorithm is described be-low:
1. Divide the image into m×m sub-areas, m is a user defined value.
2. Start from top left sub-area.
3. Extract features from the sub-area based on the AGAST de-cision trees.
4. Calculate the feature’s scores. This method is the same with FAST or AGAST.
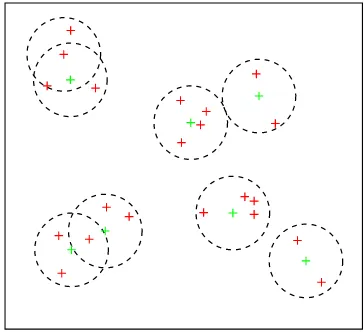
5. Compare the scores of the features within a circle area. The radius of the circle is the given minimum feature distance, the feature with the highest score in its circle is kept, others are suppressed, fig. 3 show this concept.
6. If the remaining feature number n is greater than N/(m×m), then use pseudo code in fig. 4 to decrease the number of out-put features, and increase the threshold for next frame, N is a user defended value, which is the desired feature number of the whole image. If N less than N/(m×m), decrease the threshold for the next frame. In any case the threshold is kept greater or equal to a user defended minimum threshold value., preventing the feature selection from being unrea-sonably sensitive and find features in actually homogeneous areas, structured only by the camera noise. (Possibly this could be also described below this list)
1: f tlt= 0 ⊲a list holding the output features
2: forf tinf lansdo ⊲flans is the features list after non-maximum suppression
3: iff tlt.size/maxN um≤f t.index/f ans.sizethen ⊲maxNum is a user defined maximum feature numbers 4: f tlt.push back(f t)
5: end if 6: end for 7: returnf tlt
Figure 4: Feature reduction algorithm
Figure 3: The green crosses are the features being kept; the red are suppressed. The radius of circle is the minimum feature dis-tance, the center point in the top left circle is suppressed, because it has not the highest score in its circle
(a) Original AGAST (b) Optimized AGAST
Figure 5: Comparison of the AGAST feature extractors
4. PERFORMANCE TEST
Figure 5 shows the comparison between the original AGAST and the feature detector which combines AGAST and the new non-maximum suppression algorithm, called optimized AGAST in the following. Both detectors use identical initial parame-ters, but the optimized AGAST dynamically adjusts the threshold. The difference between the two images is very evident, showing the advantage of the optimized AGAST. Although the optimized AGAST adjusts the threshold and tries to extract features from each sub-area, there are no features extracted from the floor area. This is caused by a minimum threshold limit, needed to avoid the selection of features on homogenous areas caused by the readout noise of the camera.
To check the performance of the optimized AGAST, we do rig-orous tests on it. The research purpose is to explore the feature detector which is working best for IPS, hence getting the most accurate optical navigation results. Therefore the tests are per-formed with realistic data including the entire processing chain. The performance is evaluated in terms of the accuracy of the re-sulting trajectory and the processing time. IPS works with a
con-figuration file, which include various concon-figuration information for each module, such as camera calibration data, feature detec-tor parameters, etc. During the testing of the optimized AGAST, a crucial task is to find the optimal configuration parameters for the optimized AGAST. The best value for each parameter is hard to know, fortunately we know the reasonable range for them. A brute force search method is therefore used to find out the best parameters combination. To compare the performance of the op-timized AGAST and the KLT detector, the same testing process is used for KLT as well. The testing sequence is described below.
First, a dataset is recorded by walking with IPS through a realistic scene, an office building and the surrounding outdoor areas with a length of about 410 meters. In order to evaluate the accuracy of the resulting trajectory the start and end position of the walk are exactly identical. One complete data sequence from a single walk is called Session. We recorded eight sessions in total. In an off-line processing step, the IPS application is used to calculate the trajectory for various configuration parameters using the different feature extraction algorithms. The accuracy of the resulting tra-jectory is rated by the difference between the start point and end point of the 3D trajectory.
For each, KLT and AGAST feature detector, 24 different config-urations were tested. Each configuration includes valid combi-nations of parameters like minimum feature detector threshold, minimum feature distance, the number of sub-images, etc. Be-cause a RANSAC algorithm is used for the optical navigation, for an identical video sequence and configuration, each run outputs a slightly different trajectory due to the random component. Hence, the evaluation of each configuration requires several runs of the trajectory calculation and a statistical evaluation of the resulting deviation of the start and end point. To get high accurate testing results, we run IPS application 50 times for each configuration and calculate the average 3D error. The minimum trajectory error means the best configuration parameters for the feature detector. During the test, the processing times of the feature detectors are recorded and evaluated. In total, we do 8×24×2×50=19200 test runs producing 107GB of output data. The best configuration for AGAST and KLT can be determined based on this data. Figure 6 present the whole testing sequence.
5. EXPERIMENTAL RESULTS
Figure 7 shows the processing times of KLT and optimized AGAST, which are independent of the configuration. The upper figure shows 4100 images testing results, and from the lower figure, the optimized AGAST is about 8.8 times faster than KLT, this is a great advance.
For each session, due to the RANSAC results, the testing outputs 50 trajectories per configuration file. The data processing steps are described below:
Start
Figure 6: The whole testing sequence
0 500 1000 1500 2000 2500 3000 3500 4000 4500 0
(a) Results for 4100 images, thexaxis is the image index
0
(b) Mean of 4100 testing results
Figure 7: Processing times comparison
2. Calculate the mean of 8 session results generated with the same configuration, after this step, get 24 3D errors correla-tion with 24 configuracorrela-tion.
3. Do same calculations for both AGAST and KLT. 4. Output 48 calculated results.
Figure 8 shows the 3D errors for each configuration. These re-sults gives an indication for the quality of the feature detectors. Because a configuration may be better for one session but worse for other sessions, it is necessary to review the mean of the 8
0 5 10 15 20 25
Index of configuration files
Figure 8: 3D-errors for 24 configuration
0
(a)x-axis errors
0
(b)y-axis errors
0
(c)z-axis errors
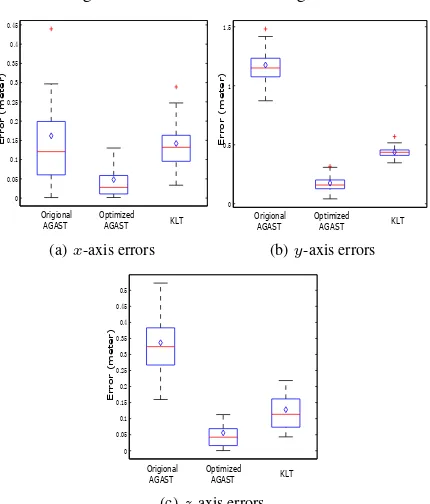
Figure 9: Box plots of 50 testing results. The upper and lower edges of the boxes are the 25th and 75th percentiles, the red crosses are the outliers, the diamonds are the RMS results.
session results to find out the best configuration. The result for the best parameters of the optimized AGAST is about 0.46 meter, the best for KLT is about 0.64 meter. According to these results AGAST is not only much faster that KLT, but also leads to better trajectories.
Finally, we compare the qualities between original AGAST, KLT, and optimized AGAST. Lacking of experiment time, we just test one representative session with the best configuration file for KLT and AGAST respectively. The original AGAST uses identical pa-rameters as the optimized AGAST. Figure 9 shows that the opti-mized AGAST is not only more accurate but also more robust than the others. These results have proved that the optimizations of AGAST lead to a clear improvement of the overall-system.
6. CONCLUSION AND OUTLOOK
decreases the 3D trajectory error of IPS system from 0.64 me-ter to 0.46 meme-ter for the given trajectory. Furthermore, the op-timized AGAST shows a large improvement of the accuracy of the resulting trajectory compared to the original AGAST. The processing time saved by the optimized AGAST could be used in post-processing steps, that enables IPS to do more complex calculations to improve the accuracy, as well as to improve the ability to real time processing.
Our future works will address the used feature matcher. IPS calculates the relative transformation between adjacent frames which is fused with the inertial data within a Kalman filter. In this process, the cumulative error could become high. The idea is to identify key-frames within the video sequence to decrease this error. The error can also be decreased by using refining the matching itself, e.g. by using subpixel matching approaches.
REFERENCES
Bay, H., Tuytelaars, T. and Van Gool, L., 2006. Surf: Speeded up robust features. In: Computer vision ECCV 2006, Springer, pp. 404–417.
Grießbach, D., 2014. Stereo-Vision-Aided Inertial Navigation. PhD thesis, Freie Universit¨at Berlin.
Grießbach, D., Baumbach, D. and Zuev, S., 2014. Stereo-Vision-Aided Inertial Navigation for Unknown Indoor and Outdoor En-vironments.
Grießbach, D., Baumbach, D., B¨orner, A., Buder, M., Ernst, I., Funk, E., Wohlfeil, J. and Zuev, S., 2012. IPSA System for Real-Time Navigation and 3d-Modeling. ISPRS-International Archives of the Photogrammetry, Remote Sensing and Spatial
In-formation Sciences39, pp. B5.
Harris, C. and Stephens, M., 1988. A combined corner and edge detector. In:Alvey vision conference, Vol. 15, Manchester, UK, p. 50.
Lowe, D. G., 2004. Distinctive image features from scale-invariant keypoints. International journal of computer vision
60(2), pp. 91–110.
Lucas, B. D., Kanade, T. and others, 1981. An iterative image registration technique with an application to stereo vision. In:
IJCAI, Vol. 81, pp. 674–679.
Mair, E., Hager, G. D., Burschka, D., Suppa, M. and Hirzinger, G., 2010. Adaptive and generic corner detection based on the accelerated segment test. In: Computer Vision ECCV 2010, Springer, pp. 183–196.
Quinlan, J. R., 1986. Induction of decision trees.Machine learn-ing1(1), pp. 81–106.
Rosten, E. and Drummond, T., 2005. Fusing points and lines for high performance tracking. In: Computer Vision, 2005. ICCV
Tenth IEEE International Conference, Vol. 2, IEEE, pp. 1508–
1515.
Rosten, E. and Drummond, T., 2006. Machine Learning for High-Speed Corner Detection. In:Computer Vision ECCV 2006, Lecture Notes in Computer Science, Springer Berlin Heidelberg, pp. 430–443.
Rosten, E., Porter, R. and Drummond, T., 2010. Faster and bet-ter: A machine learning approach to corner detection. Pattern
Analysis and Machine Intelligence, IEEE Transactions on32(1),
pp. 105–119.
Shi, J. and Tomasi, C., 1994. Good features to track. In: 1994 IEEE Computer Society Conference on Computer Vision and