www.elsevier.comrlocateratmos
Total NO column amount over Athens, Greece in
21996–97
H.D. Kambezidis
a,), A.D. Adamopoulos
a, C. Gueymard
ba
Atmospheric Research Team, Institute of EnÕironmental Research and Sustainable DeÕelopment,
National ObserÕatory of Athens, PO Box 20048, GR-11810 Athens, Greece
b
2959 Ragis Road, Edgewater, FL 32132, USA
Received 2 December 1999; accepted 10 June 2000
Abstract
Ž .
This paper reports the total NO column TNC measurements performed in Athens, Greece2 during the period 1996–97. The measurements used a solid-state spectrometer and were based on the spectral absorption of beam solar irradiance in the visible region. This study investigates the diurnal and seasonal variations of the total NO column in the atmosphere above Athens. It is2
Ž .
found to be in the range 1–160 matm-cm average values , with large daily and seasonal variations. The highly probable link between this variability and synoptic conditions over Athens is discussed.q2001 Elsevier Science B.V. All rights reserved.
1. Introduction
Ž .
Nitrogen dioxide NO2 is a variable atmospheric gas that plays a key role in urban Ž .
pollution and in the ozone O3 cycle within both the troposphere and stratosphere. Any increase in NO has sensible effects on each one of these processes. Above a certain2
tropospheric concentration, it results in the appearance of a typical yellow-brownish Ž
cloud that is visible in large polluted cities such as Los Angeles Husar and White,
. Ž .
1976 and Athens Mantis et al., 1992 . This cloud usually has harmful effects on public health. Also, this highly reactive cloud creates the necessary conditions for the formation of photochemical smog and tropospheric ozone, themselves detrimental to human health. Many studies on the tropospheric and stratospheric abundance of NO also deal with2
)Corresponding author. Tel.:q30-1-3490119; fax:q30-1-3490140.
Ž .
E-mail address: [email protected] H.D. Kambezidis .
0169-8095r01r$ - see front matterq2001 Elsevier Science B.V. All rights reserved.
Ž .
Ž important features concerning its latitudinal, seasonal and diurnal variations e.g., Brewer et al., 1973; Noxon, 1978, 1979; Wofsy, 1978; Coffey, 1988; Coffey et al., 1981; Solomon and Garcia, 1983; McKenzie and Johnston, 1982, 1983, 1984a,b; Mount et al., 1984; Johnston and McKenzie, 1984; Johnston et al., 1994; Elonkov and Gruzdev,
.
1994 . The present contribution focuses on the two latter aspects of the NO climatol-2 ogy.
Among the radiative transfer codes used for short-wave irradiance prediction, only a
Ž .
few e.g., MODTRAN, SMARTS2 specifically simulate the absorption of solar radia-tion by NO molecules. The total NO absorpradia-tion depends upon its integrated concen-2 2 tration over the entire depth of the atmosphere. This integrated concentration is generally
Ž .
expressed as Atotal column amountB in atm-cm . Since there are many atmospheric processes affecting this amount, it turns out to be highly variable with time and location.
Ž .
Estimation of the total NO column TNC is required if the above mentioned radiative2
transfer codes are to be used. The precise vertical distribution of NO is not investigated2
in this study.
Here, the TNCs are estimated from ground-based visible irradiance data obtained
Ž .
from an apparatus described in Kambezidis et al. 1996 . This device includes a spectrometer system that measures solar radiation after its passage through the Earth’s atmosphere and its absorption and scattering by the various atmospheric constituents Žgases and aerosols . In previous studies, this apparatus has been successfully employed.
Ž .
for the estimation of: i the spectral total atmospheric transmission and total optical Ž .
thickness; ii the individual spectral atmospheric transmissions due to different
atmo-Ž . Ž . Ž .
spheric constituents; iii the estimation of the total O3 column TOC ; and iv the influence of aerosols on climate changes and other properties of the atmosphere, e.g.,
Ž
albedo, visibility, validation of Wien’s displacement law Kambezidis et al., 1996, .
1997a,b, 1998a,b; Adamopoulos et al., 1998a,b,c,d .
2. Instrumentation for NO retrieval2
2.1. Spectrometer
The TNC is retrieved from beam solar irradiance measurements obtained with a
Ž .
passive pyrheliometric scanner hereafter PPS . A regular pyrheliometer is a radiometer used to record the direct component of solar radiation. The term ApassiveB used here indicates that no energy emitted from the PPS is required for recording solar radiation. The term AscannerB implies that the PPS performs spectral measurements. A detailed description of this instrument, which records solar radiation in the range 200–1000 nm
Ž .
with a resolution of about 0.5 nm, is given in Kambezidis et al. 1996 . Solar radiation enters through two concentric lenses and is guided by two optical fibers to two different
Ž
diffraction gratings one in the UV and VIS spectral regions and another in the VIS and .
NIR regions . A CCD sensor is then used to imprint the two spectral regions one at a
Ž .
time; the individual spectral values in mV are then converted from analogue to digital Ž y2.
accuracy in the measurements, the diffraction gratings unit is kept inside a constant
Ž .
temperature environment Kambezidis et al., 1996 , and the PPS is regularly calibrated against a halogen spectral lamp.
2.2. NO retrieÕal
2
The absorption of beam solar irradiance due to NO2 in the atmosphere obeys the Bouguer law according to which the NO transmission may be expressed as:2
T sexp
Ž
ym t.
Ž .
1n n n
and
t sk l ,
Ž .
2n n n
where t is the NO optical thickness, m its optical mass, l the NO column in
n 2 n n 2
atm-cm, and k its spectral absorption coefficient.n
The NO2 column is determined from PPS irradiance measurements for two close optical wavelengths, l and l , at which NO absorbs strongly and weakly,
respec-1 2 2
tively. This is the well known differential absorption technique widely used in various
Ž .
applications, including LIDAR techniques Kambezidis et al., 1998c . The selected pairs of wavelengths here are l s393.84rl s394.88 nm and l s407.76rl s409.82
1 2 1 2
Ž .
nm. TNC is obtained in atm-cm from:
l s t
Ž
l.
ytŽ
l.
rm kŽ
T ,l.
ykŽ
T ,l.
,Ž .
3n c 1 c 2 n n 1 n 2
Ž . Ž .
wheret l , t l stand for the optical thickness at the above wavelengths,
respec-c 1 c 2
tively, after correction for molecular scattering, aerosol scattering and absorption, and Ž .
gaseous absorption due to O , H O and mixed gases. Eq. 3 is solved for each of the3 2
two wavelength pairs, yielding two independent determinations of t. Their arithmetic
n
mean is retained to provide the instantaneoust estimates discussed in what follows.
n
Ž .
The analytical expressions for the optical thickness are presented in Gueymard 1995
Ž .
and Kambezidis et al. 1997a . The extraterrestrial spectrum as well as the absorption coefficients of the different constituents and the functional dependence of m on then
Ž .
sun’s zenith angle are from the SMARTS2 code Gueymard, 1995 .
3. Results and discussion
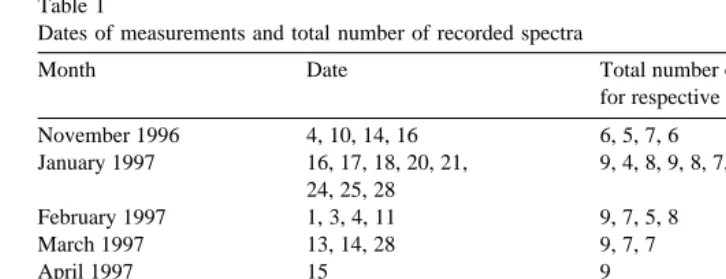
A total 303 beam solar irradiance spectra were recorded during 42 cloudless days ŽTable 1 throughout an 11-month period 11. Ž r1996–9r1997 . The measurements were. performed on the roof of the Electrical Engineering Building of the National Technical University of Athens situated in the city center of Athens, i.e., in a highly polluted part of the city. In addition, simultaneous observations of air temperature were carried out at the measuring site so that a temperature correction of the absorption coefficients could
Ž .
Table 1
Dates of measurements and total number of recorded spectra
Month Date Total number of recorded spectra
for respective dates
Kambezidis et al. 1997a . Thus, the total NO columnar amounts were calculated at the2
various times of measurements. Finally, the results were sorted into three different categories of averaged values, one for each day; category A for Aearly morningB, category B forAmiddayB and category C forAlate afternoonBvalues. Categories A and C contain mean TNC values over the first hour after sunrise and the last hour before sunset, respectively. Category B includes averages for the time period 11:00–13:30 LST. All present results show the high variability of TNC over time with strong seasonal
Ž
and diurnal variations, as was also obtained by other authors McKenzie and Johnston, .
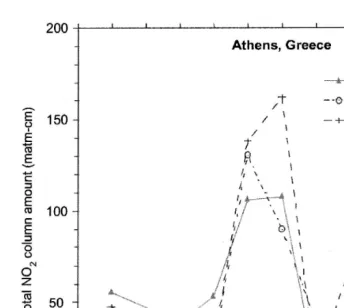
1984b; Elansky et al., 1984, 1994 . Fig. 1 presents the calculated mean monthly values
Ž . Ž . Ž .
of TNC for categories A triangles , B circles , and C crosses . It should be noticed that there are no data for 2 months of the year, October and December, due to technical difficulties. Nearly all the retrieved instantaneous TNC values lie in the range 1–100
Ž .
matm-cm as an order of magnitude , indicating an important concentration and strong variability of tropospheric NO2 in the polluted atmosphere of Athens, as anticipated. The present values are roughly an order of magnitude larger than those reported for an
Ž .
industrial city in Canada, i.e., 0.04–13 matm-cm Schroeder and Davies, 1987 . Our results are also orders of magnitude higher than the background stratospheric levels Žnormally of the order of 0.1 matm-cm , so that these large values can be attributed to. local anthropogenic sources, which are mostly concentrated in the lower layers of the troposphere above the city.
The diurnal variation of TNC also globally illustrated in Fig. 1 indicates that, from March to September, late-afternoon values almost always exceed the midday and morning estimates. In the cold-period months, however, the NO column content turns2 out to be larger in the morning. The midday values for the same period are the lowest of
Ž the day. Table 2 provides more specific results for the daily variation of TNC average
. Ž .
and standard deviation for a transitional month March 1997 when the midday values were about three times less than either the early morning or late afternoon values. Moreover, the lowest values of the year are observed before noon in May, June, August
Ž .
Ž . Ž .
Fig. 1. Variations of mean monthly TNC values ofAearly morningB solid line ,AmiddayB dash-dotted line ,
Ž .
andAlate afternoonB dashed line .
Žearly morning was calculated for the different seasons: 1.81 autumn , 0.89 winter ,. Ž . Ž .
Ž . Ž .
1.37 spring , and 3.35 summer . This ratio is important since it includes information about the atmospheric NO chemistry as explained later on. The season limits defined in2
Table 2
Ž .
Example of daily variation of the Total NO Column TNC for March 19972
Time interval Average TNC values Standard deviation of
ŽLST. Žmatm-cm. TNC matm-cmŽ .
0800–0930 116 58
1000–1130 63 60
1200–1330 42 44
1400–1530 118 88
this work have the conventional meaning. The ratio averaged over the year is 1.85, i.e., a
Ž .
little larger than the value of 1.32 reported by Elansky et al. 1984, 1994 for Caucasus, Ž
and the values ranging from 1.49–1.67 but for stratospheric NO only Noxon, 1979;2
.
Syed and Harrison, 1980; McKenzie and Johnston, 1982; Coffey et al., 1981 .
Amana-Ž .
tidis et al. 1989a,b found this ratio to be 1.58 for Thessaloniki, Greece and additionally report values in the range 1.5–1.7 from experiments conducted elsewhere, in very close agreement with our results. Moreover, our calculated ratios for autumn and spring are
Ž .
comparable to those found in the literature e.g., Elansky et al., 1994 . In contrast, a high and a low value are observed for summer and winter, respectively. This is attributed to the transition of a significant part of NO into N O during the long nighttime periods2 2 5
of winter, and the photodissociation of N O during the long daytime periods of summer2 5
ŽElansky et al., 1994 . McKenzie and Johnston 1982 showed that the decay of NO. Ž . 2 has a time constant of about 1 day in summer and that this decay tended to be slower in winter. However, the NO column amount and the evening2 rmorning ratios are depen-dent on a number of factors such as temperature, ozone amount, and aerosol loading ŽJohnston et al., 1994 ..
As far as the seasonal variation of TNC is concerned, a value of 1.9 is found here for
Ž . Ž .
the ratio NO summer2 rNO winter . This value is in accordance with values quoted2
Ž .
by other authors, e.g., 1.9 for Caucaus Elansky et al., 1994 , or 2.0 for Toronto, Canada ŽKerr, 1989 and New Zealand McKenzie and Johnston, 1982 . Amanatidis et al.. Ž . Ž1989a,b report a ratio for the warm period. rcold period of about 1.7. In addition, larger values of TNC are observed in March, April and July as seen in Fig. 1. The springtime peak is probably due to the lowering of the wind speeds and the subsequent
develop-Ž .
ment of early sea-breeze cells in the area. Amanatidis et al. 1989a have come to similar conclusions. These authors have observed high springtime TNC values for the city of Thessaloniki, Greece. Those authors invoke that TNC is highly influenced by local pollution sources discharging in the mixing layer. Another proposed explanation was that the circulation of sea-breeze cells in the Thessaloniki area could contribute to the increase of pollution levels. These observations are also valid in the case of Athens, which has similar climatological conditions to those of Thessaloniki. It is also observed that the mean NO summertime values exceed those for spring by 6% in this study. In2
addition, for evening values only, the summer average is greater than the spring average by 37%. In global terms, the seasonal NO column content is greatest in summer and2
lowest in winter. Futhermore, the springtime TNC exceeds that of autumn, as expected ŽElanksy et al., 1994 ..
The results of this study are based on a limited number of data. Therefore, further investigation is required for a longer time period.
References
Adamopoulos, A.D., Kambezidis, H.D., Zevgolis, D., 1998a. Validation of Wien’s displacement law under cloudy sky. Fresenius Environ. Bull. 7, 515–522.
Adamopoulos, A.D., Kambezidis, H.D., Zevgolis, D., Topalis, F.B., Djepa, V., 1998c. Aerosol optical
Ž .
thicknesses through modified Langley-plots over Athens, Greece. In: Goetzberger, A., Krainer, A. Eds. , Proc. EuroSun98 2nd ISES Europe Solar Congress., 14–17 September, Portoroz, Slovenia. The Franklin Company Consultants, Birmingham, UK, pp. I.1.1. 1–7.
Adamopoulos, A.D., Kambezidis, H.D., Zevgolis, D., Topalis, F.B., Djepa, V., 1998d. Variability of total
Ž .
optical thickness over Athens, Greece. In: Goetzberger, A., Krainer, A. Eds. , Proc. EuroSun98 2nd ISES Europe Solar Congress., 14–17 September, Portoroz, Slovenia. The Franklin Compony Consultants, Birmingham, UK, pp. I.1.2. 1–7.
Amanatidis, G.T., Bais, A.F., Kelessis, A.G., Zerefos, C.S., Ziomas, I.C., 1989a. Stratospheric and total NO2 column measurements with a modified Canterbury filter photometer. J. Atmos. Chem. 8, 435–446. Amanatidis, G.T., Zerefos, C.S., Bias, A.F., Ziomas, I.C., Kelessis, A.G., 1989b. Two years of regular
stratospheric NO2 measurements at Thessaloniki, Greece, using twilight photometry. In: Bojkov, R.D.,
Ž .
Fabian, P.A. Eds. , Proc. Ozone in the Atmosphere. Deepak Publ. Hampton, Virginia, USA, pp. 336–339. Brewer, A.W., McElroy, C.T., Kerr, J.B., 1973. Nitrogen Dioxide Concentrations in the Atmosphere. Nature
246, 129–133.
Coffey, M.T., 1988. On the temporal change of stratospheric NO . Geophys. Res. Lett. 15, 331–334.2 Coffey, M.T., Mankin, W.G., Goldman, A., 1981. Simultaneous Spectroscopic Determination of the
Latitudi-nal, SeasoLatitudi-nal, and Diurnal Variability of Stratospheric N O, NO, NO , and HNO . J. Geophys. Res. 862 2 3
ŽC8 , 7331–7341..
Elansky, N.F., Arabov, A.Y., Elonkov, A.S., Savastyuk, V.V., Senik, I.A., 1984. Spatial and temporal
Ž .
variability of the NO total content based on annual observation data. In: Zerefos, C.S., Ghazi, A. Eds. ,2 Proc. Quadriennal Ozone Symp., Halkidiki, Greece. D. Reidel Publ., pp. 157–162.
Elansky, N.F., Arabov, A.Y., Makarov, O.V., Savastyuk, V.V., Senik, I.A., 1994. Measurements of the total
Ž .
column amount of NO2 at Kislovodsk observatory in 1979–1990. In: Hudson, R.D. Ed. , Proc. Conf. Ozone in the Troposphere and Stratosphere, Charlottesville, VA, vol. 2, pp. 675–678, NASA Conf. Publ. 3266.
Elonkov, A.S., Gruzdev, A.N., 1994. Total ozone and total NO latitudinal distribution from measurements in2
Ž .
the Atlantic Ocean in May 1988. In: Hudson, R.D. Ed. , Proc. Conf. Ozone in the Troposphere and Stratosphere, Charlottesville, VA, vol. 2, pp. 695–698, NASA Conf. Publ. 3266.
Ž .
Gueymard, C., 1995. Simple Model of the Atmospheric Radiative Transfer of Sunshine SMARTS2 : w algorithms and performance assessment. FSEC-PF-270-95, Florida Solar Energy Center, Florida.
Availa-x ble online from ftp:rralpha.fsec.ucf.edurpublicrsmarts2r.
Husar, R.B., White, W.H., 1976. On the color of the Los Angeles smog. Atmos. Environ. 10, 199–204. Johnston, P.V., McKenzie, R.L., 1984. Long-path absorption measurements of tropospheric NO in rural New2
Ž .
Zealand. Geophys. Res. Lett. 11 1 , 69–72.
Johnston, A.S., Keys, J.G., McKenzie, R.L., 1994. NO column changes induced by volcanic eruptions. In:2
Ž .
Hudson, R.D. Ed. , Proc. Conf. Ozone in the Troposphere and Stratosphere, Charlottesville, VA, vol. 2, pp. 615–618, NASA Conf. Publ. 3266.
Kambezidis, H.D., Sakellariou, N.K., Topalis, F.B., Kanellias, A.A., Petrova, V.D., 1996. Air pollution monitoring with a passive pyrheliometric scanner. Fresenius Environ. Bull. 5, 631–636.
Kambezidis, H.D., Petrova, V.D., Adamopoulos, A.D., 1997a. Radiative transfer: I. Atmopheric transmission monitoring with modeling and ground-based multispectral measurements. Appl. Opt. 36, 6976–6982. Kambezidis, H.D., Petrova, V.D., Adamopoulos, A.D., 1997b. Radiative transfer: II. Impact of meteorological
variables and surface albedo on atmospheric optical properties retrieved from ground-based multispectral measurements. Appl. Opt. 36, 6983–6988.
Kambezidis, H.D., Adamopoulos, A.D., Djepa, V., Zevgolis, D., Topalis, F.B., 1998a. A radiative model based on multispectral solar direct radiation measurements. In: Pepper, D.W., Brebbia, C.A., Zannetti, P.
ŽEds. , Proc. Envirosoft98 7th International Conf. on Development and Application of Computer Tech-.
niques to Environmental Studies, 10–12 November, Las Vegas, NV, USA. WITPRESS, Boston, Southampton, pp. 89–98.
Kambezidis, H.D., Adamopoulos, A.D., Sakellariou, N., Topalis, F.B., Kanellias, A.A., Petrova, V.D., Zevgolis, D., 1998b. Atmospheric chemistry and climate changes monitoring by a simple passive system. Fresenius Environ. Bull. 7, 20–26.
Adamopoulos, A.D., Doukas, A., Gogou, P.M., Karaboulas, D., Katsenos, J., 1998c. Advanced-technol-ogy-laser-aided air pollution monitoring in Athens: the Greek differential absorption LIDAR. In:
Cara-Ž .
belas, A., Di Lazzaro, P., Torre, A., Baldacchini, G. Eds. , Proc. 2nd GR-I Intern. Conf. on New Laser Technologies and Applications. SPIE Proc., vol. 3423, pp. 262–265.
Kerr, J.B., 1989. Ground based measurements of nitrogen dioxide using the Brewer spectrophotometer. In:
Ž .
Bojkov, R.D., Fabian, P. Eds. , Proc. Ozone in the Atmosphere. A. Deepak Publ., Hampton, VA, pp. 340–343.
Mantis, H.T., Repapis, C.C., Zerefos, C.S., Ziomas, J.C., 1992. Assessment of the potential for photochemical air pollution in Athens: a comparison of emissions and air-pollutant levels in Athens with those in Los Angeles. J. Appl. Meteorol. 31, 1467–1476.
McKenzie, R.L., Johnston, P.V., 1982. Seasonal variations in stratospheric NO at 452 8S. Geophys. Res. Lett.
9, 1255–1259.
McKenzie, R.L., Johnston, P.V., 1983. Stratospheric ozone observations simultaneous with NO2 at 458S.
Geophys. Res. Lett. 10, 337–340.
McKenzie, R.L., Johnston, P.V., 1984a. Springtime stratospheric NO in Antarctica. Geophys. Res. Lett. 11,2 73–75.
McKenzie, R.L., Johnston, P.V., 1984b. Southern hemisphere nitrogen dioxide. In: Zerefos, C.S., Ghazi, A.
ŽEds. , Atmospheric Ozone, Proc. Quadriennal Ozone Symp., Halkidiki, Greece. D. Reidel Publ., pp..
163–167.
Mount, G.H., Rusch, D.W., Noxon, J.F., Zawodny, J.M., Barth, C.A., 1984. Measurements of stratospheric
Ž .
NO from the solar mesosphere explorer satellite: 1. An overview of the results. J. Geophys. Res. 89 D1 ,2 1327–1340.
Ž .
Noxon, J.F., 1978. Tropospheric NO . J. Geophys. Res. 83 C6 , 3051–3057.2
Ž .
Noxon, J.F., 1979. Stratospheric NO : 2. Global behavior. J. Geophys. Res. 84 C8 , 5067–5076.2
Schroeder, R., Davies, J.A., 1987. Significance of nitrogen dioxide in estimating aerosol optical depth and size distributions. Atmos. Ocean 25, 107–114.
Solomon, S., Garcia, R.R., 1983. On the distribution of nitrogen dioxide in the high-latitude stratosphere. J.
Ž .
Geophys. Res. 88 C9 , 5229–5239.
Syed, M.Q., Harrison, A.W., 1980. Ground-based observations of stratospheric nitrogen dioxide. Can. J. Phys. 58, 788–801.
Wofsy, S.C., 1978. Temporal and latitudinal variations of stratospheric trace gases: a critical comparison
Ž .