Depression: Serial Changes and Relationship to
Clinical Response
Helen S. Mayberg, Steven K. Brannan, Janet L. Tekell, J. Arturo Silva,
Roderick K. Mahurin, Scott McGinnis, and Paul A. Jerabek
Background: Treatment of major depression with
antide-pressants is generally associated with a delay in onset of
clinical response. Functional brain correlates of this
phenomenon have not been previously characterized.
Methods: Time course of changes in brain glucose
me-tabolism were measured using positron emission
tomog-raphy in hospitalized unipolar depressed patients treated
with fluoxetine. Time-specific and response-specific effects
were examined at 1 and 6 weeks of treatment.
Results: Changes were seen over time, and characterized
by three distinct patterns: 1) common changes at 1 and 6
weeks, 2) reversal of the 1-week pattern at 6 weeks, and 3)
unique changes seen only after chronic treatment.
Fluox-etine responders and nonresponders, similar at 1 week,
were differentiated by their 6-week pattern. Clinical
im-provement was uniquely associated with limbic and
stri-atal decreases (subgenual cingulate, hippocampus, insula,
and pallidum) and brain stem and dorsal cortical
in-creases (prefrontal, parietal, anterior, and posterior
cin-gulate). Failed response was associated with a persistent
1-week pattern and absence of either subgenual cingulate
or prefrontal changes.
Conclusions: Chronic treatment and clinical response to
fluoxetine was associated with a reciprocal pattern of
subcortical and limbic decreases and cortical increases.
Reversal in the week-1 pattern at 6 weeks suggests a
process of adaptation in specific brain regions over time
in response to sustained serotonin reuptake inhibition. The
inverse patterns in responders and nonresponders also
suggests that failure to induce these adaptive changes may
underlie treatment nonresponse. Biol Psychiatry 2000;
48:830 – 843 © 2000 Society of Biological Psychiatry
Key Words: Depression, glucose metabolism, positron
emission tomography, fluoxetine, cingulate, prefrontal
cortex, hippocampus, striatum.
Introduction
I
t is well recognized that all of the major classes of
antidepressant medications are associated with a
sever-al-week minimum delay in onset of clinical effectiveness
(Hickie et al 1999; Nurenberg et al 1999). Converging
preclinical evidence suggests that mechanisms underlying
this response timeline involve a variety of adaptive
neu-rochemical changes including aminergic reuptake
inhibi-tion and associated presynaptic autoregulatory
desensiti-zation, up- and downregulation of multiple postsynaptic
receptor sites, and receptor-mediated second messengers
and neurotrophic effects (Blier and de Montigny 1999;
Duman et al 1999; Hyman and Nestler 1996). Requisite
brain regions mediating these events remain generally
uncharacterized, although putative sites of action in the
dorsal raphe and locus coeruleus as well as in the
hip-pocampus, hypothalamus, and frontal cortex are suggested
from maps of normal human chemoarchitecture;
postmor-tem receptor studies in depressed suicide victims; animal
models of reward, stress, and learned helplessness; and in
vivo and ex vivo pharmacologic studies (Arango et al
1995, 1999; Azmitia and Gannon 1986; Blier and de
Montigny 1985; Duman et al 1999; Fraser and Hensler
1990; Haddjeri et al 1998; Mann et al 2000; Petty et al
1997). Supporting evidence of critical target sites in the
brain mediating antidepressant effects is further provided
by functional imaging studies of depressed patients
stud-ied before and after various forms of antidepressant
treatment. However, there is considerable variability in
both site and direction of changes across studies (Baxter et
al 1989; Bench et al 1995; Brody et al 1999; Buchsbaum
et al 1997; Goodwin et al 1993; Malizia 1997; Martinot et
al 1990; Mayberg et al 1999; Nobler et al 1994; Passero et
al 1995; Smith et al 1999; Teneback et al 1999; Wu et al
1992), and reported findings are not necessarily in regions
targeted by preclinical or autopsy studies. The time course
of regional changes has not been characterized.
This study examines the time course of changes in
regional brain glucose metabolism associated with 6
From the Research Imaging Center (HSM, SKB, RKM, SM, PAJ) and theDepartments of Psychiatry (HSM, SKB, JLT, JAS, RKM), Radiology (HSM, PAJ), and Medicine (Neurology) (HSM), The University of Texas Health Science Center at San Antonio.
Address reprint requests to Helen S. Mayberg, M.D., Rotman Research Institute, Baycrest Centre, 3560 Bathurst Street, Toronto Ontario M6A 2E1, Canada. Received May 2, 2000; revised August 25, 2000; accepted August 25, 2000.
© 2000 Society of Biological Psychiatry 0006-3223/00/$20.00
weeks of fluoxetine treatment in unipolar depressed
pa-tients. Three hypotheses are tested: 1) distinctive patterns
of change in specific cortical, subcortical, and limbic
regions will be seen at 1 week and 6 weeks of fluoxetine
treatment, as indexed by 18 fluorodeoxyglucose positron
emission tomography (FDG PET) measurements of
re-gional glucose metabolism; 2) the time course of
meta-bolic changes will reflect the temporal delay in clinical
response; and 3) variability in the 6-week metabolic
change pattern will differentiate treatment responders
from nonresponders.
Methods and Materials
Patient Selection
Unmedicated depressed men with symptoms requiring hospital-ization and treatment were recruited from the inpatient psychia-try unit at the Audie L. Murphy Memorial Veterans Administra-tion Hospital (San Antonio). The clinical diagnosis of a major depressive episode, unipolar type, was confirmed by two inde-pendent psychiatrists using DSM-IV criteria and a structured psychiatric interview (Spitzer et al 1988). Patients with cerebro-vascular risk factors or a previous stroke, documented head trauma or neurodegenerative disorders, other axis I psychiatric diagnoses, or evidence of global cognitive impairment were excluded, as were patients with psychotic symptoms, current or past history of substance abuse, daily use of alcohol in the previous 3 months, antidepressant treatment within the preceding month, previous nonresponse to fluoxetine, or previous electro-convulsive therapy (ECT). Seventeen depressed men meeting these criteria were identified (mean age54969 years; current episode duration 5186 2 weeks; number of previous major depressive episodes 5 2 6 1; Hamilton depression score, 17 item 5226 5, Mini-Mental State Exam score5296 1.5). None of the enrolled subjects were considered treatment refrac-tory by hisrefrac-tory. Smoking was not restricted, but was kept at a minimum while research subjects were in the hospital. Written informed consent was obtained from all subjects, and the study was conducted as approved by the University of Texas Health Science Center’s Institutional Review Board.
Treatment Protocol
Following a pretreatment baseline PET scan and behavioral testing session, antidepressant treatment was initiated in all patients. Treatment was randomized, using a double-blind de-sign, to either fluoxetine (20 mg/day fixed dose) or a placebo. All patients additionally received the therapeutic benefits of the standard ward milieu. A second PET scan was acquired at the end of the first week of treatment, and a third scan at the conclusion of the 6-week inpatient treatment course.
Response Assessment
Overall clinical improvement was assessed at the 1- and 6-week PET sessions using the Hamilton Rating Scale for
Depression (HRSD; Hamilton 1960) and a computerized battery of standardized behavioral tests targeting mood, motor performance, and cognition, with special emphasis on motor performance, information processing speed, and executive functioning (Mahurin 1995). Tests included simple and choice reaction time, versions of the Stroop and Trails tests, tests of verbal fluency, and fine and gross motor coordination. Treat-ment Responders were defined as having a minimum 50% drop in HRSD score relative to baseline; nonresponders were defined as having less than a 20% change (Stassen et al 1993). Partial responders (20 –50% change) were not included in the nonresponder group to avoid potential dilution of a unique nonresponder pattern (Stassen et al 1993).
Imaging Studies
Regional cerebral glucose metabolism was measured using standard methods (Phelps et al 1979) in all patients using F-18-fluorodeoxyglucose and PET at three time points: before drug treatment and after 1 week and 6 weeks of drug treatment. For each of the three scans, a 5-mCi dose of FDG was injected intravenously, with image acquisition beginning after 40 min (scan duration 20 min; GE/Scanditronix [Uppsala, Sweden] 4096 camera; 15 parallel slices; 6.5-mm center-to-center interslice distance; attenuation correction with 68/Ge/68/Ga transmission scans; reconstructed with a Hann filter; final resolution in-plane of 7.0 mm, full width half maximum [FWHM]). The absolute glucose utilization rate was not calculated. All scans were acquired with patients supine, awake, and in the resting state with eyes closed and ears uncovered. Patients were checked every 10 min to ensure they were not asleep. Subjects were not explicitly instructed to monitor internal mood state or to perform any specific cognitive task. This approach aimed to examine regional effects associated with illness remission without the potential interpretive confounds introduced by explicit manipulation of affective or cognitive state (Mayberg et al 1997, 1999; Mayberg 1994). A debriefing session following the uptake period docu-mented compliance with the instructions in all subjects. Patients did not smoke within the 60 min before FDG injection. An anatomic magnetic resonance imaging scan was also acquired in each subject for the purposes of spatial transformation of the PET data, region of interest analysis, and parametric image display (Elscint [Haifa, Israel] Gyrex 2T-DLX; three-dimensional GRASS sequence: TR533 msec; TE512 msec; flip angle5
60°; 25632563127 volume, spatial resolution of 1 mm3
).
Data Analysis
PLANNED CONTRASTS. Imaging data were analyzed in two stages. The first set of contrasts examined the time course of fluoxetine effects on regional glucose metabolism, independent of clinical response: 1) 1-week drug effects (scan 2 vs. baseline) and 2) chronic, 6-week drug effects (scan 3 vs. baseline). A second set of comparisons was then performed to evaluate response-specific effects at each time point, computed separately for treatment responders and nonresponders, as defined by the final 6-week clinical assessment: 1) 1-week response effects (scan 2 vs. baseline) and 2) 6-week response effects (scan 3 vs. Serial Metabolic Changes with Fluoxetine in MDD BIOL PSYCHIATRY 831
baseline). Analyses were performed only on data from patients receiving active fluoxetine treatment. Results of the placebo arm of the study are the subject of a separate report.
IMAGE ANALYSES. All analyses were performed using in-house software and validated methods (Fox and Mintun 1989; Lancaster et al 1995; Mintun et al 1989). Following spatial transformation of PET and magnetic resonance images into proportional bicommissural coordinate space relative to the stereotaxic atlas of Talairach and Tournoux (1988), voxelwise tissue activity of FDG was first value normalized to mean whole brain activity, and then scaled to an arbitrary mean of 1000. Value- and spatially normalized images were then trilinearly interpolated, resampled (60 slices, 8-mm3
voxels), and Gaussian filtered to a final resolution of 9.9 mm (FWHM), before statistical analysis.
Change distribution analysis was used to quantify state-related changes in metabolism (Fox and Mintun 1989). First, a voxel-by-voxel subtraction of the targeted condition pairs was per-formed in each individual. Within-subject differences were then averaged across subjects, creating a grand-mean difference image for each contrast (1 week vs. baseline; and 6 weeks vs. baseline). Ab2 statistic measuring kurtosis of the histogram of the difference image (change distribution curve) was used as an omnibus test to assess overall significance (D’Agostino et al 1990). The b2 test was implemented in the MIPS software (Research Imaging Center, San Antonio) in a manner similar to the use of the g2 statistic (Fox and Mintun 1989). The b2 improves on theg2 by using a better estimate of the degrees of freedom (i.e., “number of results” in the PET images; Worsley et al 1992). The omnibus test was followed by a maxima and minima search to identify local extrema within a search volume measuring 125 mm3
(Mintun et al 1989).
To facilitate reporting and visualization of these maxima and minima, group-mean subtraction images were converted posthoc to statistical parametric images of Z scores based on the variance of all local changes within the subtraction images (Figures 1 and 2). Locations of focal maxima and minima exceeding a Z score magnitude of 2.6 (p#.01, two tailed) are listed in Tables 1 and 3, with the peak voxel of each area described in x, y, and z coordinates in millimeters relative to the anterior commissure (Talairach and Tournoux 1988). Anatomic concordance (or discordance) of focal maxima and minima across contrasts (drug effects, 1-week vs. 6-week changes; 6-week response effects, changes in responders vs. nonresponders) was defined as a common (or different) Brodmann area (BA) identifier for the coordinate locations (Lancaster et al 1997), as well as evidence of anatomic overlap in the extent of significant activations or deactivations seen with the use of a logical contrast of two Z score maps (Figure 3; Mayberg et al 1999).
Results
Fifteen of the 17 enrolled patients completed all three
scans. Mechanical problems with the PET scanner
precluded the timely scanning of two subjects, both of
whom remained clinically symptomatic at 6 weeks, and
later proved to have been treated with a placebo.
Breaking the blind also revealed that 10 of the
remain-ing 15 patients had received active fluoxetine; the other
five, a placebo. Only scan data from the 10 active
fluoxetine-treated patients were used to assess the
1-and 6-week fluoxetine effects 1-and subsequent responder–
nonresponder differences.
1-Week Fluoxetine Effects
There was a significant effect of 1 week of fluoxetine
treatment on brain glucose metabolism [scan 2 vs.
base-line,
b
2(1972)
5
3.69, p
,
.0002]. Both increases and
decreases were identified, involving subcortical and
lim-bic–paralimbic regions and, to a lesser extent, the
neocor-tex (Figure 1, top). Areas of significant increase were seen
in the rostral brain stem, globus pallidus, hippocampus,
and medial temporal (BA 37), premotor (BA 6), and
parietal (BA 40) cortices. Decreases were localized to the
caudate, thalamus, insula, parahippocampus, and posterior
cingulate (BA 31; Table 1).
6-Week Fluoxetine Effects
Significant metabolic changes were also seen at 6 weeks
[scan 3 vs. baseline,
b
2(1972)
5
3.00, p
,
.001].
Comparable changes were seen between 1 and 6 weeks
(scan 3 vs. scan 2,
b
2
5
3.85, p
,
.0002; data not
shown). In general, chronic treatment resulted in a
recip-rocal pattern of cortical increases and limbic–paralimbic
decreases (Figure 1, bottom). Relative to the 1-week
effects, specific regional changes at 6 weeks followed one
of three distinct patterns: 1) sustained changes, similar in
magnitude and direction to those seen at 1 week (increases
in pons and premotor [BA 6], and inferior parietal [BA 40]
cortices; decreases in the caudate, thalamus, insula,
para-hippocampus, and cerebellum); 2) a reversal of the 1-week
pattern (initial 1-week increases in the hippocampus,
medial temporal [BA 37] cortex, and putamen were now
decreases relative to both the 1-week and baseline scans;
initial decreases in the posterior cingulate [BAs 31/23]
cortex were not increases relative to baseline); and 3) new
changes unique to 6 weeks of treatment (increases in the
anterior cingulate [BA 24b], dorsolateral prefrontal [BAs
9/46], and ventral frontal [BAs 10/47] cortices; decreases
in the subgenual cingulate [BA 25] cortex; Table 1). No
region demonstrated a significant change at 1 week and no
change at 6 weeks.
Behavioral Effects
analysis of variance, F(2,28)
5
16.07, p
5
.0001].
Since changes in HDRS scores across individuals were
variable, response-specific changes were explicitly
ex-amined using the predefined response criteria. Four
patients were classified as fluoxetine responders
(min-imum 50% drop in HDRS), four as nonresponders (less
than a 20% drop in HDRS), and two as partial response
(greater than 20 but less than 50% change in HDRS).
Baseline clinical severity and patient demographic
char-acteristics were statistically similar for responders and
nonresponders as were baseline performance scores on
motor and cognitive testing (Table 2). There were also
no significant changes in clinical scores with 1 week of
treatment in either group.
Table 1. Concordant and Reciprocal Changes from Baseline with 1 and 6 Weeks of Fluoxetine Therapy (n5 10)
Da Region BA Side
1-week fluoxetine (scan 2 vs. scan 1)
Zc
6-week fluoxetine (scan 3 vs. scan 1)
Zc x, y, z
coordinatesb
Extent (mm3)
x, y, z coordinatesb
Extent (mm3)
Sustained changes
11 Pons–rostral brainstem R 4,234,220 216 2.9 2,230,218 40 2.5
11 Premotor 6 L 240, 2, 36 384 3.3 246,2 2, 26 432 3.3 6 L 228, 0, 20 592 4.0
6 R 44,212, 26 344 3.1
11 Inferior parietal 40 L 248,220, 22 584 3.7 248,212, 24 528 3.4 40 L 254,250, 24 152 2.8 248,250, 26 160 2.8
40 L 238,244, 34 336 3.0
40 R 38,230, 30 456 3.2
22 Caudate L 218, 16, 0 536 23.7 216, 16, 2 608 23.3
R 18, 16, 0 864 25.2
22 Medial thalamus R 24, 26, 4 184 4, 26, 8 16 22.4
22 Anterior insula L 246, 22, 0 376 23.4 222, 22, 6 344 23.1
R 36, 14, 8 232 23.0
22 Midinsula R 36, 24, 24 144 23.2
22 Posterior insula R 40,220, 14 144 23.0 40,218, 14 752 24.4
22 Parahippocampus L 218,246,212 40 22.4 214, 44, 2 720 24.0 R 12,248,212 216 22.9 14,248, 22 200 22.9
22 Cerebellum L 218,236,216 224 22.8
R 18,242,214 296 22.9 14,254,216 8 22.3
Reverse changes
12 Hippocampus L 228,222,218 48 2.6 218,216,214 176 22.9 R 24,222,216 72 2.7 22,216,218 0 22.1
12 Medial temporal 37 L 236,262, 28 816 4.4 250,254,212 0 22.0 R 36,246,214 496 4.1 34,254,210 40 22.5
12 Putamen–pallidum L 224,218, 12 208 2.8 226, 24, 8 24 22.4 R 24, 4, 10 232 2.9 28, 24, 8 216 23.1
21 Posterior cingulate 23 L 28,232, 26 328 3.0 R 0,230, 26 720 24.4 8,226, 24 432 3.6 31 R 12,234, 30 656 24.0 10,274, 14 200 3.1
Late changes only
–1 Anterior cingulate 24b R 12, 8, 26 224 3.1 –1 Ventral prefrontal 47/45 L 238, 32, 6 352 3.3
R 40, 22, 28 112 2.7
–1 Dorsal prefrontal 46 L 234, 28, 20 120 2.7
46 R 43, 28, 18 72 2.7
9 L 238, 22, 26 96 2.6
9 R 44, 22, 26 120 2.7
9 L 236, 6, 36 576 3.9
9 R 36, 2, 34 520 3.6
–2 Subgenual cingulate 25 R 4, 2, 24 136 22.6
25 R 2, 26, 28 32 22.5
BA, Brodmann area (Talairach and Tournoux 1988); R, right; L, left.
a1, increases;2, decreases (the first arrow in a pair, refers to 1 week; the second, 6 weeks).
bCoordinates, mm relative to anterior commissure; x, right (1)/left (2); y, ant (1)/post (2); z, sup (1)/inf (2). cZ scores:?Z? .2.6, p,.01;?Z? .3.09, p,.001;?Z? .4.0, p,.0000 (two tailed).
Serial Metabolic Changes with Fluoxetine in MDD BIOL PSYCHIATRY 833
Drug Responders versus Nonresponders
The pattern of metabolic changes was similar in drug
responders and nonresponders at the 1-week time point
(data not shown). In contrast, at 6 weeks distinct patterns
of change were seen in responders [scan 3 vs. baseline,
b
2
(1972)
5
3.44, p
,
.0006] and nonresponders (
b
2
5
3.54, p
,
.0004). Regional changes in the two groups
paralleled clinical response in a pattern consistent with the
overall 1-week and 6-week effects (Figure 2).
Improve-ment in clinical symptoms (responder group) was uniquely
associated with a reciprocal pattern of limbic–paralimbic
decreases (subgenual cingulate [BA 25] cortex,
hippocam-pus, insula) and brain stem and dorsal cortical increases
(prefrontal [BAs 46/9], anterior cingulate [BA 24b],
infe-rior parietal [BA 40], and posteinfe-rior cingulate [BAs 31/23]
cortices; Table 3). Caudate, thalamic, and
parahippocam-pal decreases and premotor (BA 6) increases were seen
with fluoxetine treatment, independent of response.
Qual-Figure 1. Time course of fluox-etine effects. Changes in regional glucose metabolism at 1 week and 6 weeks of fluoxetine treatment. Sagittal (left), axial (middle), and coronal (right) views. One week of fluoxetine treatment, relative to baseline, is associated with a pat-tern of subcortical decreases (shown in green) and brain stem, limbic–paralimbic, and focal cor-tical increases (red). In contrast, 6 weeks of fluoxetine is associated with a pattern of subcortical and paralimbic decreases and wide-spread cortical increases. A switch from 1 to 6 weeks is seen in the hippocampus and posterior cingu-late. Delayed changes are seen in the subgenual cingulate (decreas-es) and the anterior cingulate and prefrontal cortex (increases). Slice location is in mm relative to the anterior commissure. Numbers are Brodmann designations. pCg, pos-terior cingulate; cd, caudate; p, pons; hc, hippocampus; ph, para-hippocampus; F9/46, prefrontal; Cg25, subgenual cingulate; ins, anterior insula.
Table 2. Clinical Ratings and Neuropsychologic Scores
Drug responders (n 54) Drug nonresponders (n5 4)
Baseline 1 week 6 weeks Baseline 1 week 6 weeks
Hamilton Depression Rating Scale (17 item)a
2265 1863 1164 1866 2065 1863
Spielberger State Anxiety scale 57611 52621 45615 55618 56610 56614 Simple reaction time (sec) 284611 3926218 306650 315697 305660 376614 Choice reaction time (sec) 412660 440646 425675 5106142 475640 5686107 Trails A time (sec)b 4362 41617 3569 50613 3662 3365 Trails B time (sec) 80621 6268 57611 82638 72632 74629 Stroop word– color (sec) 78627 83648 63612 73612 7768 85621 Verbal fluency (FAS) 1268 1662 2165 2165 2469 2367 Motor speed—Minnesota rate
of manipulation (sec)
55610 5168 4766 50610 4464 5063
aTwo-way analysis of variance (time3response): F(2,33)55.7, p5.0007.
Responders (baseline vs. 6 weeks) p5.0001; 6 weeks (responders vs. nonresponders), p5.003.
Figure 2. Changes in regional glu-cose metabolism in treatment re-sponders (Resp) and nonrere-sponders (Non-Resp) following 6 weeks of fluoxetine. Sagittal (left), axial
(middle), and coronal (right)
views. Improvement in clinical symptoms is uniquely associated with specific regional limbic–para-limbic decreases (shown in green) and cortical increases (red). Nonre-sponse at 6 weeks is associated with a pattern identical to that seen in all patients at 1 week of treatment— specifically, increases in the hip-pocampus and decreases in the pos-terior cingulate and prefrontal cortex. Slice location in mm relative to anterior commissure. Numbers are Brodmann designations. pCg31, posterior cingulate; Cg25, sub-genual cingulate; hc, hippocampus; F9, prefrontal; ins, anterior insula. Table 3. Concordant and Reciprocal Changes in Fluoxetine Responders (n5 4) and Nonresponders (n 5 4)
Da Region BA Side
Responders (6 weeks vs. baseline)
Zc
Nonresponders (6 weeks vs. baseline)
Zc x, y, z
coordinatesb
Extent (mm3)
x, y, z coordinatesb
Extent (mm3)
Same
22 Caudate R 18, 16, 0 232 23.2 16, 16, 0 176 23.0 L 216, 14, 8 336 22.7
22 Medial thalamus R 6, 4, 6 64 22.4 18,224, 2 400 23.3
L 210,226, 6 368 23.3
22 Parahippocampus L 224,240, 22 296 23.0 214,242, 22 408 23.4 R 30,230,210 112 22.7 13,250, 2 88 22.7
11 Premotor 6 L 242,222, 34 96 2.7 248,210, 34 216 2.9 6 R 46,220, 34 280 3.1
6 L 232, 8, 30 520 3.3 6 R 42, 0, 32 656 4.2
Opposite
21 Hippocampus L 220,220,214 392 23.0 224,228,216 232 2.8 R 22,218,218 296 23.5 24,222,214 128 2.9
21 Medial temporal 37 R 42,244,210 384 22.8 38,244,214 144 2.7
21 Posterior insula R 40,218, 18 704 23.7 38,220, 28 880 3.7
21 Putamen–pallidum R 28, 24, 8 456 23.2 25, 4, 12 8 2.0 L 226, 22, 8 160 22.8
12 Dorsal prefrontal 46 R 34, 22, 24 776 3.3 32, 20, 24 40 22.5 46 R 42, 28, 18 408 3.1 36, 30, 24 16 22.3
12 Posterior cingulate 31 L 28,232, 30 328 3.3 24,242, 34 536 23.3 23 R 6,228, 22 400 3.6 2,238, 26 712 23.8
Responders only
1– Rostral brain stem R 4,226,214 56 2.6
1– Dorsal anterior cingulate 24b R 12, 8, 26 136 2.7
1– Dorsal prefrontal 9 R 26, 12, 38 752 3.9
1– Inferior parietal 40 L 238,244, 34 104 2.6 40 R 42,234, 34 312 2.8
2– Anterior insula L 227, 20, 2 72 22.6 R 40, 18, 2 432 23.5 R 38, 4, 10 264 23.0
2– Midinsula R 36, 24, 24 152 23.0
2– Subgenual cingulate 25 R 10, 22,214 488 23.2
BA, Brodmann area (Talairach and Tournoux 1988); R, right; L, left.
itatively, these changes resulted in a correction of
pretreat-ment cortical abnormalities (prefrontal, parietal
hypome-tabolism) as well as suppression of activity in previously
uninvolved limbic–paralimbic regions (subgenual
cingu-late and hippocampus; data not shown). Failed response
(nonresponder group) was associated with a persistent
1-week pattern at 6 weeks—specifically, increases in the
hippocampus and putamen– globus pallidus and decreases
in the 6 posterior cingulate—the exact inverse of that seen
in the responder group (Figure 3). Nonresponders also
showed a loss of the initial brain stem and parietal
increases and anterior insula decreases as well as a total
absence of late-onset increases in the prefrontal cortex
(BAs 9/46) and decreases in the subgenual cingulate (BA
25).
Discussion
There are three principle findings from this study. The first
is that fluoxetine effects on regional brain glucose
metab-olism are not static over time. The second is that
late-occurring changes mirror clinical response, with failure to
modify early-occurring changes characterizing treatment
nonresponse. The third is that the metabolic change pattern
seen in responders is not merely the correction of
pretreat-ment abnormalities, but rather a more complex
combina-tion of effects involving both normalizacombina-tion of cortical
hypometabolism and new adaptive changes in certain
specific subcortical and paralimbic regions without
previ-ous metabolic anomalies.
Localization of Time-Sensitive Effects
Overall, the time course of regional glucose metabolic
changes appears to identify a cortical–limbic network that
responds in a systematic manner to acute and chronic
treatment with fluoxetine. Early metabolic changes were
most prominent in subcortical and paralimbic regions, with
relatively less involvement of the neocortex. This localization
is consistent with an extensive animal literature
demonstrat-ing short-term fluoxetine effects on neuronal firdemonstrat-ing rates and
regional transmitter and metabolite levels in the raphe,
hippocampus, and hypothalamus (Blier and Bouchard 1994;
Blier and de Montigny 1985; Chaput et al 1991; Fraser and
Hensler 1990). Direct neurochemical mechanisms for the
metabolic changes seen in other regions are more
circum-stantial (Crino et al 1993; Dray 1981; Grabiel 1990). These
changes are, however, concordant with effects of direct
rostral raphe stimulation and activation of ascending
seroto-nergic neurons demonstrated in the conscious rat using 2-DG
autoradiography (Cudennec et al 1988). Similar to the
1-week PET findings, metabolic increases in the
extrapyra-midal motor system (globus palladus and somatosensory
cortices) and in certain limbic regions (hippocampus,
hypo-thalamus) were seen with acute raphe stimulation, and these
increases were associated with local changes in serotonin and
serotonin–metabolite levels. No change or modest
nonsignif-icant decreases were seen in the caudate–putamen, cingulate,
and prefrontal cortex of the rat, despite measurable increases
in local serotonin markers. As was postulated for the animal
studies, the pattern of enhanced or attenuated glucose
utili-zation seen with PET following 1 week of fluoxetine
treat-ment is likely not a reflection of serotonergic nerve terminal
or receptor distribution, but rather the initiation of activity in
polysynaptic neural circuits provoked by the release of
serotonin (McCulloch 1982; Sokoloff 1983). The absence at
1 week of more widespread changes in these known circuits
would be consistent with attenuation in the net effect on 5-HT
neurotransmission by fluoxetine due to activation of 5-HT
1Asomatodendritic autoreceptors (Blier and de Montigny 1999).
In contrast to the 1-week effects, 6-week changes were
more widespread, with a distinct segregation of increases
and decreases across cytoarchitectural and functionally
defined neural systems. Increases were seen primarily in
the cortex and, for the most part, only with chronic
treatment. Net metabolic decreases, on the other hand,
were localized exclusively to subcortical and paralimbic
regions. A reversal of the 1-week pattern was seen at 6
weeks in the hippocampus and posterior cingulate,
paral-leling preclinical biochemical and molecular findings
described with chronic selective serotonin reuptake
inhib-itor (SSRI), tricyclic, and monamine oxidase inhibinhib-itor
(MAOI) treatment (for reviews, see Blier and de Montigny
1999; Hyman and Nestler 1996). Desensitization of
pre-synaptic 5-HT
1Aautoreceptors provides one potential
mechanism for these effects (Blier et al 1997; Blier and de
Montigny 1985, 1999; Chaput et al 1991; Fraser and
Hensler 1990; Mongeau et al 1997). Postsynaptic receptor
downregulation, as well as changes in second messenger
and molecular markers, may additionally explain the
late-onset increases in cortical regions, although the
rela-tionship between the direction of metabolic changes and
increases or decreases in postsynaptic receptor density,
messenger RNA, cFOS, G proteins, or brain-derived
neurotrophic factor are unknown (Chaput et al 1991; de
Montigny and Aghajanian 1978; Duman et al 1999;
Duncan et al 1996; El Mansari et al 1995; Mann et al
1995; Nibuya et al 1996; Takahashi et al 1999; Vaidya et
al 1997). Delayed, widespread cortical changes, as well as
sustained increases in brain stem metabolism, may
addi-tionally reflect the successful desensitization of the
5-HT
1Aautoreceptors and a net increase in serotonin
neurotransmission affecting targets throughout the
neuro-axis (Blier and de Montigny 1999). Given the clinical
evidence that pindolol hastens response to fluoxetine,
presumably via this mechanism (Artigas et al 1994; Blier
and Bergeron 1997), it is postulated that this could be
indexed with PET by the accelerated switch in posterior
cingulate and hippocampal metabolism and associated
cortical and subgenual changes.
Convergent Findings with Published Studies
Although the time course of metabolic changes has not
been previously characterized, pre–posttreatment changes
have been reported using a variety of interventions
includ-ing medication, sleep deprivation, ECT, transcranial
mag-netic stimulation, and ablative surgery (Baxter et al 1985;
Bench et al 1995; Brody et al 1999; Buchsbaum et al 1997;
Goodwin et al 1993; Malizia 1997; Martinot et al 1990;
Mayberg et al 1999; Nobler et al 1994; Passero et al 1995;
Smith et al 1999; Teneback et al 1999; Wu et al 1992).
Normalization of frontal hypometabolism is the
best-replicated finding, seen mainly with antidepressant drugs
including tricyclics, MAOIs, and various SSRIs (Baxter et
al 1989; Bench et al 1995; Buchsbaum et al 1997;
Goodwin et al 1993; Martinot et al 1990; Mayberg et al
1999; Passero et al 1995; S.H. Kennedy et al, unpublished
data). Decreases in limbic and paralimbic regions are quite
variable with drug treatment (Brody et al 1999; Drevets et
al 1992; Mayberg et al 1999; Smith et al 1999; S.H.
Kennedy et al, unpublished data) but common in studies of
ECT, sleep deprivation, and surgery (Henry et al, in press;
Malizia 1997; Nobler et al 1994, 1999; Smith et al 1999;
Wu et al 1992). Electroconvulsive therapy decreases,
however, are not restricted to paralimbic areas. Although
few studies demonstrate both increases and decreases with
treatment, certain change patterns do appear more often
than others (prefrontal and anterior cingulate increases;
ventral medial–subgenual frontal, hippocampus, and
ante-rior insula decreases), particularly in those studies using
serotonin reuptake inhibitors (Brody et al 1999;
Buchs-baum et al 1997; Mayberg et al 1999; S.H. Kennedy et al,
unpublished data). Variations in change pattern may
re-flect the relative pharmacologic specificity of the different
medications. No studies have directly compared changes
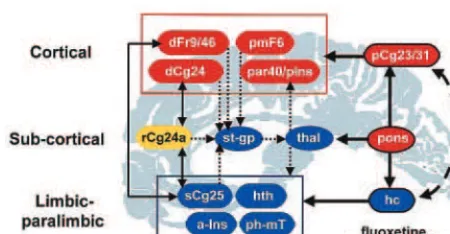
Figure 4. Response-specific effects. Schematic model illustrat-ing relationships among regions mediatillustrat-ing treatment response. Regions with known anatomic and functional connections that also show significant metabolic changes following 6 weeks of fluoxetine treatment are grouped into three compartments— cortical, subcortical, and limbic–paralimbic. Blue regions signify areas with a net metabolic decrease with treatment; red areas are those with a net increase. Yellow signifies an area that is hypermetabolic pretreatment and unchanged by treatment. Solid black arrows identify known reciprocal cortico–limbic, limbic– paralimbic, and cingulate– cingulate connections. Dotted small black arrows indicate known cortical–striatal–thalamic path-ways. The model proposes that illness remission occurs when there is inhibition of paralimbic and subcortical regions and activation of previously hypofunctioning dorsal areas, an effect facilitated by fluoxetine action in the dorsal raphe, hippocampus, and posterior cingulate. Normal or abnormal functioning of the rostral cingulate (Cg24) with its bidirectional connections to both the anterior cingulate (Cg24) and the subgenual cingulate (Cg25) is postulated to facilitate interactions between dorsal cortical and more ventral paralimbic systems and strategically influence pharmacologically mediated changes in serotonergic neurotrans-mission across the network. Numbers are Brodmann designa-tions. dFr9/46, dorsolateral prefrontal; dCg24, dorsal anterior cingulate; par40/pIns, inferior parietal–posterior insula; pCg23/ 31, posterior cingulate; rCg24a, rostral anterior cingulate; st-gp, caudate–putamen– globus pallidus; thal, thalamus; Cg25, sub-genual cingulate; hth, hypothalamus; a-Ins, anterior insula; ph-mT, parahippocampus–medial temporal; Hc, hippocampus.
Serial Metabolic Changes with Fluoxetine in MDD BIOL PSYCHIATRY 837
common to antidepressants with different modes of action,
although there is a small literature on regional differences
associated with response to different medications (Ketter
et al 1999; Little et al 1996). There is, however, some
regional overlap (caudate and orbital frontal decreases)
with paroxetine treatment for obsessive– compulsive
dis-order (Saxena et al 1999), suggesting drug-specific effects
that are independent of the specific illness being treated.
Divergent effects seen in responders and nonresponders
additionally suggest that there may be differences in the
adaptation of target regions to chronic serotonergic
mod-ulation in different patient subgroups. Studies using dose
escalation strategies and different medications are needed
to validate this hypothesis and to distinguish nonresponse
from treatment resistance. Additionally, explicit
evalua-tions of gender-specific effects are needed. In this regard,
recent blood flow studies of fully recovered, previously
depressed women on maintenance SSRI treatment
demon-strate comparable cortical and paralimbic changes relative
to sex-matched, age-comparable healthy control subjects,
suggesting some generalizability of the current findings in
male veterans to other groups of unipolar depressed
patients (Mayberg et al 1998).
Additional support for the critical role of specific
limbic–paralimbic regions both in the pathophysiology of
depression and as a primary target of antidepressant
treatment is provided by postmortem studies of depressed
patients that identify decreased serotonin transporter
bind-ing in the brain stem and subgenual and rostral cbind-ingulate in
sites anatomically comparable to metabolic changes seen
in this and other studies (Arango et al 1995, 1999; Drevets
et al 1992; Mann et al 2000; Mayberg et al 1997).
Macroscopic and microscopic changes in the subgenual
cortex have also been reported (Drevets et al 1997; Ongur
et al 1998). Single photon emission computed tomography
imaging of serotonin transporter binding has identified
brain stem abnormalities (Malison et al 1998), but
differ-ences in the cingulate, frontal, and hippocampal regions
seen in postmortem studies have not been replicated.
Serotonin 1A receptor decreases have also been reported,
with described selective changes in the hippocampus
(Drevets et al 1999; Sargent et al 2000), perhaps related to
reported volume loss in this region with chronic
depres-sion (Sheline et al 1996). Treatment studies using SSRIs or
tricyclic antidepressants additionally report
downregula-tion of 5-HT
2Areceptors consistent with pharmacologic
studies in animals (Massou et al 1997; Meyer et al 2000;
Yatham et al 1999). Although the reported changes are
generally global rather than focal, areas with the greatest
magnitude change with desipramine were in medial frontal
regions— overlapping sites of the most robust metabolic
decreases seen in this fluoxetine study (Yatham et al
1999). Baseline 5-HT
2Aabnormalities have been less
consistent (Mayberg et al 1988; Meltzer et al 1999; Meyer
et al 1999).
Functional Neurocircuitry
The overall pattern of cortical, subcortical, and limbic
changes suggests the involvement of several
well-charac-terized pathways, schematically organized as an
interac-tive network (Figure 4). Strategic modulation by treatment
of specific subcortical (brain stem, hypothalamus),
lim-bic–paralimbic (hippocampus, posterior cingulate), and
striatal (caudate, globus pallidus) nodes is seen as the
primary mechanism for the observed widespread,
recipro-cal effects. The site and direction of regional changes
additionally suggest plausible mechanisms for changes in
mood, motor, cognitive, and somatic symptoms of
depres-sion (Mayberg 1997).
The early and sustained decreases seen in the caudate,
thalamus, and cerebellum in combination with increases in
globus pallidus and premotor cortex constitute a major
component of the cortico–striatal–thalamic circuits
postu-lated to mediate psychomotor functions, including motor
and executive planning, and aspects of motivation and
reward (Alexander et al 1990; Fibiger 1984;
Goldman-Rakic and Selemon 1984; Grabiel 1990; Kimura and
Grabiel 1995; Lemke et al 1999; Nauta 1986). Increases in
the posterior cingulate, inferior parietal, and premotor
cortices in combination with decreases in the
parahip-pocampus and posterior insula are consistent with findings
and emerging theories regarding regulation of somatic and
negative emotional arousal (Critchley et al 2000; Damasio
1996; Heilman and Watson 1989; Heller et al 1997;
MacLean 1949; Meadows and Kaplan 1994; Lang 1994),
recognition of emotional faces and expressions (Adolphs
et al 2000), and encoding of aversive emotional stimuli
(Maddock 1999). Cortical increases in the prefrontal,
anterior cingulate, and inferior parietal cortices overlap
known networks active in working memory, attentional
processing, and executive functions (Baker et al 1997;
Corbetta et al 1993; Dias et al 1996; Liotti and Tucker
1992; Mesulam 1993; Morecraft et al 1993; Pardo et al
1990, 1991)— behaviors commonly affected during a
major depressive episode and that are generally responsive
to antidepressant treatment (Bench et al 1993; Dolan et al
1993, 1994; Elliott 1998).
been demonstrated (Freedman et al 2000; George et al
1999; Kunishio and Haber 1994; Rolls 1996; Vogt and
Pandya 1987). It is therefore postulated that these regions
remain effectively “off-line,” until specific adaptive
changes occur in areas providing primary afferent inputs,
such as the hippocampus or posterior cingulate. Persistent
subgenual cingulate hypometabolism in fully recovered,
previously depressed patients on long-term maintenance
SSRI treatment provides additional evidence that these
may be the requisite metabolic changes needed for
sus-tained clinical remission (Mayberg et al 1998). The critical
role of these two regions in the modulation of mood state
is further supported by the reverse reciprocal pattern (area
25 increases, area 9 decreases) with induction of transient
sadness in healthy volunteers (Mayberg et al 1999). The
recent demonstration of dense projections from area 25 to
the dorsal raphe raises the tantalizing possibility that the
subgenual cortex plays some role in regulating overall
serotonergic activity—perhaps as it relates to ongoing
fluctuations in mood state—a function that may be
im-paired in patients with depression (Freedman et al 2000).
The rostral cingulate is considered separately from
cortical or paralimbic regions because of its
cytoarchitec-tural characteristics and reciprocal connections to both the
dorsal anterior and the subgenual cingulate (Carmichael
and Price, 1996; Kunishio and Haber 1994; Vogt et al
1995; Vogt and Pandya 1987). Contributing to this
posi-tion is the added finding that metabolism in this region
uniquely differentiated the responders and nonresponders
before treatment but, itself, did not change with treatment,
consistent with previous reports (Brannan et al 2000;
Mayberg et al 1997; Wu et al 1999). These anatomic and
imaging observations would suggest that the rostral
ante-rior cingulate is well positioned to facilitate interactions
between dorsal cortical and more ventral paralimbic
sys-tems (Crino et al 1993; Livingston and Escobar 1973;
MacLean 1949). As such, dysfunction in this area could
have a significant influence on pharmacologically
medi-ated changes in serotonergic neurotransmission as well as
potential effects on the normal regulation and interaction
of mood, cognitive, and somatic functions (Baker et al
1997; Damasio 1996; Dias et al 1996; Lane et al 1997;
Lang 1994; Liotti et al 2000; MacLean 1949; Whalen et al
1998).
Clinical Implications
Antidepressants of all available pharmacologic classes are
about equal in their efficacy to treat depressive symptoms
in patients with mild to moderate depression. Empirically,
it is well recognized that patients with a poor response to
an antidepressant in one class often respond well to one in
a different class. Others will respond to treatment
augmen-tation or combination strategies using drugs with
comple-mentary pharmacologic actions, combined drug and
inter-personal psychotherapy or cognitive behavioral therapy,
or, in medication-resistant patients, ECT (Thase and Rush
1995). At present, there are no definitive mechanisms or
clinical markers to explain why a given patient will
respond to one drug and not another, or why one SSRI is
effective when another is not.
Although the sample size of this study was small, the
time points limited, and the population restricted to male
veterans, the results provide new support for the
hypoth-esis that specific limbic– cortical metabolic changes are
critical for depression remission, and that failure to induce
the requisite adaptive pattern results in persistent clinical
symptoms. These data are an important step in delineating
pathway and systems-level brain changes mediating
de-pression remission across available antidepressant
treat-ments. Characterization of a “final common pathway” will
potentially provide needed brain-based, in vivo markers
for future evaluation of novel antidepressant medications.
They will further impact studies of disease
neuropsycho-pathology by defining critical anatomic targets for future
in vivo and in vitro studies of regional neurochemistry
(Arango et al 1995, 1999; Mann et al 2000). Reliable
imaging markers of clinical response may eventually assist
in treatment decisions regarding dose escalation, change in
medication type, and whether to continue to discontinue
treatment. Consistent patterns of symptom-specific
re-sponse effects may additionally provide strategies to
eventually tailor treatment to specific patterns of brain
dysfunction and symptom profiles in individual patients.
This research was supported by National Institute of Mental Health Grant No. MH49553, an Independent Investigator Award from the National Alliance for Research in Schizophrenia and Depression, and a physician-initiated grant from Eli Lilly and Company.
The authors thank Betty Heyl, Ralph Evans, and Sergio Leal for their expert technical assistance.
Aspects of this work were presented at the 1999 annual meeting of the Society of Biological Psychiatry in Washington, District of Columbia and at the conference “Depression in the Twenty-First Century: New Insights into Drug Development and Neurobiology,” February 21–22, 2000, Dana Point, California. The conference was sponsored by the Society of Biological Psychiatry through an unrestricted educational grant provided jointly by Pharmacia & Upjohn and Janssen Pharmaceutica.
References
Adolphs R, Damasio H, Tranel D, Cooper TG, Damasio AR (2000): A role for somatosensory cortices in the visual recognition of emotion as revealed by three-dimensional lesion mapping. J Neurosci 20:2683–2690.
Alexander GE, Crutcher MD, De Long MR (1990): Basal ganglia-thalamocortical circuits: Parallel substrates for motor, Serial Metabolic Changes with Fluoxetine in MDD BIOL PSYCHIATRY 839
oculomotor, “prefrontal” and “limbic” functions. Prog Brain
Res 85:119 –146.
Arango V, Underwood MD, Bakalian MJ, Kassir SA, Oppen-heim S, Kelly T, et al (1999): Reduction in serotonin transporter sites in prefrontal cortex is localized in suicide and widespread in major depression. Soc Neurosci Abstr 25:1798. Arango V, Underwood MD, Gubbi AV, Mann JJ (1995): Localized alterations in pre- and postsynaptic serotonin bind-ing sites in the ventrolateral prefrontal cortex of suicide victims. Brain Res 688:121–133.
Artigas F, Perez V, Alvarez E (1994): Pindolol induces a rapid improvement of depressed patients with serotonin reuptake inhibitors. Arch Gen Psychiatry 51:248 –251.
Azmitia EC, Gannon PJ (1986). Primate serotonergic system: A review of human and animal studies and a report on Macaca fascicularis. In: Fahn S, editor. Advances in Neurology. Vol
43, Myoclonus. New York: Raven, 407– 468.
Baker SC, Frith CD, Dolan RJ (1997): The interaction between mood and cognitive function studied with PET. Psychol Med 27:565–578.
Baxter LR Jr, Schwartz JM, Phelps ME, Mazziotta JC, Guze BH, Selin CE, et al (1989): Reduction of prefrontal cortex glucose metabolism common to three types of depression. Arch Gen
Psychiatry 46:243–250.
Bench CJ, Frackowiak RSJ, Dolan RJ (1995): Changes in regional cerebral blood flow on recovery from depression.
Psychol Med 25:247–251.
Bench CJ, Friston KJ, Brown RG, Frackowiak RS, Dolan RJ (1993): Regional cerebral blood flow in depression measured by positron emission tomography: The relationship with clinical dimensions. Psychol Med 23:579 –590.
Blier P, Bergeron R (1997): Early onset of therapeutic action in depression and greater efficacy of antidepressant treatments: Are they related? Int Clin Psychopharmacol 12:21–28. Blier P, Bergeron R, de Montigny C (1997): Selective activation
of post-synaptic 5HT1A receptors produces a rapid antide-pressant response. Neuropsychopharmacology 16:333–338. Blier P, Bouchard C (1994): Modulation of 5-HT release in the
guinea-pig brain following long-term administration of anti-depressant drugs. Br J Pharmacol 113:485– 495.
Blier P, de Montigny C (1985): Serotonergic but not noradren-ergic neurons in rat CNS adapt to long-term treatment with MAOIs. Neuroscience 16:949 –955.
Blier P, de Montigny C (1999): Serotonin and drug-induced therapeutic responses in major depression, obsessive compul-sive and panic disorders. Neuropsychopharmacology 21: 170 –178.
Brannan SK, Mayberg HS, McGinnis S, Silva JA, Mahurin RK, Jerabek PA, Fox PT (2000): Cingulate metabolism predicts treatment response: A replication. Biol Psychiatry 47(8S): 107.
Brody AL, Saxena S, Silverman DH, Alborzian S, Fairbanks LA, Phelps ME, et al (1999): Brain metabolic changes in major depressive disorder from pre to post-treatment with parox-etine. Psychiatry Res 99;127–139.
Buchsbaum MS, Wu J, Siegel BV, Hackett E, Trenary M, Abel L, Reynolds C (1997): Effect of sertraline on regional metabolic rate in patients with affective disorder. Biol
Psy-chiatry 41:15–22.
Carmichael ST, Price JL (1996): Connectional networks within the orbital and medial prefrontal cortex of macaque monkeys.
J Comp Neurol 371:179 –207.
Chaput Y, de Montigny C, Blier P (1991): Presynaptic and postsynaptic modifications of the serotonin system by long-term administration of antidepressant treatments: An in vitro electrophysiologic study in the rat.
Neuropsychopharmacol-ogy 5:219 –229.
Corbetta M, Miezin FM, Shulman GL, Petersen SE (1993): A PET study of visuospatial attention. J Neurosci 13:1202– 1226.
Crino PB, Morrison JH, Hof PR (1993): Monoamine innervation of cingulate cortex. In: Vogt BA, Gabriel M, editors. The
Neurobiology of Cingulate Cortex and Limbic Thalamus: A Comprehensive Handbook. Boston: Birkhauser, 285–310.
Critchley HD, Elliott R, Mathias CJ, Dolan RJ (2000): Neural activity relating to generation and representation of galvanic skin conductance responses: A functional magnetic resonance imaging study. J Neurosci 20:3033–3040.
Cudennec A, Duverger D, Serrano A, Scattfon B, MacKenzie ET (1988): Influence of ascending serotonergic pathways on glucose use in the conscious rat brain. II. Effects of electrical stimulation of the rostral raphe´ nuclei. Brain Res 444:227– 246.
D’Agostino RB, Belanger A, D’Agostino RB Jr (1990): A suggestion for using powerful and informative tests of nor-mality. Am Statistician 44:316 –321.
Damasio AR (1996): The somatic marker hypothesis and the possible functions of the prefrontal cortex. Philos Trans R Soc
Lond B Biol Sci 351(1346):1413–1420.
de Montigny C, Aghajanian GK (1978): Tricyclic antidepres-sants: Long term treatment increases responsivity of rat forebrain neurons to serotonin. Science 202:1303–1306. Dias R, Robbins TW, Roberts AC (1996): Dissociation in
prefrontal cortex of affective and attentional shifts. Nature 380:69 –72.
Dolan RJ, Bench CJ, Brown RG, Scott LC, Frackowiak RS (1994): Neuropsychological dysfunction in depression: The relationship to regional cerebral blood flow. Psychol Med 24:849 – 857.
Dolan RJ, Bench CJ, Liddle PF, Friston KJ, Frith CD, Grasby PM, Frackowiak RS (1993): Dorsolateral prefrontal cortex dysfunction in the major psychoses: Symptom or disease specificity? J Neurol Neurosurg Psychiatry 56:1290 –1294. Dray A (1981): Serotonin in the basal ganglia: Functions and
interactions with other neuronal pathways. J Physiol Paris 77:393– 403.
Drevets WC, Frank E, Price JC, Kupfer DJ, Holt D, Greer PJ, et al (1999): PET imaging of serotonin 1A receptor binding in depression. Biol Psychiatry 46:1375–1387.
Drevets WC, Price JL, Simpson JR Jr, Todd RD, Reich T, Vannier M, Raichle ME (1997): Subgenual prefrontal cortex abnormalities in mood disorders. Nature 386:824 – 827. Drevets WC, Videen TO, Price JL, Preskorn SH, Carmichael ST,
Raichle ME (1992): A functional anatomical study of unipo-lar depression. J Neurosci 12:3628 –3641.
Duncan GE, Knapp DJ, Johnson KB, Breese GR (1996): Func-tional classification of antidepressants based on antagonism of swim stress-induced fos-like immunoreactivity. J
Pharma-col Exp Ther 277:1076 –1089.
Elliott R (1998): The neuropsychological profile in unipolar depression. Trends Cogn Sci 2:447– 454.
El Mansari M, Bouchard C, Blier P (1995): Alterations of serotonin release in the guinea pig orbitofrontal cortex: Relevance to the treatment of obsessive compulsive disorder.
Neuropsychopharmacology 13:117–127.
Fibiger HC (1984): The neurobiological substrates of depression in Parkinson’s disease: A hypothesis. Can J Neurol Sci 11:105–107.
Fox PT, Mintun MA (1989): Noninvasive functional brain mapping by change-distribution analysis of averaged PET images of H2150 tissue activity. J Nucl Med 30:141–149. Fraser A, Hensler JG (1990): 5HT1a receptors and
5HT1a-mediated responses: Effect on treatments that modify seroto-nergic neurotransmission. Ann N Y Acad Sci 600:460 – 475. Freedman LJ, Insel TR, Smith Y (2000): Subcortical projections
of area 25 (subgenual cortex) of the macaque monkey.
J Comp Neurol 421:172–188.
George MS, Stallings LE, Speer AM, Spicer KM, Cheng KT, Molloy M, et al (1999): Prefrontal rTMS reduces relative perfusion locally and trans-synaptically. Hum
Psychophar-macol Clin Exp 14:161–170.
Goldman-Rakic PS, Selemon LD (1984): Topography of corti-costriatal projections in nonhuman primates and implications for functional parcellation of the neostriatum. In: Jones EG, Peters A, editors. Cerebral Cortex New York: Plenum Press, 447– 466.
Goodwin GM, Austin MP, Dougall N, Ross M, Murray C, O’Carroll RE, et al (1993): State changes in brain activity shown by the uptake of 99mTc-exametazime with single photon emission tomography in major depression before and after treatment. J Affect Disord 29:243–253.
Grabiel AM (1990): Neurotransmitter and neuromodulators in the basal ganglia. Trends Neurosci 15:244 –254.
Haddjeri N, Blier P, de Montigny C (1998): Long-term antide-pressant treatments result in a tonic activation of forebrain 5HT1Areceptors. J Neurosci 18:10150 –10156.
Hamilton M (1960): A rating scale for depression. J Neurol
Neurosurg Psychiatry 23:56 – 62.
Heilman KM, Watson RT (1989): Arousal and emotions. In: Boller F, Grafman J, editors. Handbook of Neuropsychology,
Vol. 3. Amsterdam: Elsevier, 403– 417.
Heller W, Nitschke JB, Etienne MA, Miller GA (1997): Patterns of regional brain activity differentiate types of anxiety. J
Abnorm Psychol 106:376 –385.
Henry ME, Schmidt ME, Matochik JA, Stoddard EP, Potter WZ (in press): The effects of ECT on brain glucose metabolism: A pilot FDG PET study. J ECT.
Hickie IB, Scott EM, Davenport TA (1999): Are antidepressants all the same? Surveying the opinions of Australian psychia-trists. Aust N Z J Psychiatry 33:642– 649.
Hyman SE, Nestler EJ (1996): Initiation and adaptation: A paradigm for understanding psychotrophic drug action. Am J
Psychiatry 153:151–162.
Ketter TA, Kimbrell TA, George MS, Willis MW, Benson BE,
Danielson A, et al (1999): Baseline cerebral hypermetabolism associated with carbamezepine response, and hypometabo-lism with nimodipine response in mood disorders. Biol
Psychiatry 46:1364 –1374.
Kimura M, Grabiel AM (1995): Functions of the Cortico-Basal
Ganglia Loop. Tokyo: Springer.
Kunishio K, Haber SN (1994): Primate cingulostriatal projection: Limbic striatal versus sensorimotor striatal input. J Comp
Neurol 350:337–356.
Lancaster JL, Glass TH, Lankipalli BR, Downs H, Mayberg HS, Fox PT (1995): A modality-independent approach to spatial normalization of tomographic images of human brain. Hum
Brain MAPP 3:209 –223.
Lancaster JL, Rainey LH, Summerlin JL, Freitas CS, Fox PT, Evans AC, et al (1997): Automated labeling of the human brain: A preliminary report on the development and evalua-tion of a forward-transform method. Hum Brain Mapp 5:238 –242.
Lane RD, Fink GR, Chau PM, Dolan RJ (1997): Neural activation during selective attention to subjective emotional responses. Neuroreport 22:3969 –3972.
Lang PJ (1994): The varieties of emotional experience: A meditation on James-Lange theory. Psychol Rev 101:211–221. Lemke MR, Puhl P, Koethe N, Winkler T (1999): Psychomotor
retardation and anhedonia in depression. Acta Psychiatry
Scand 99:252–256.
Liotti M, Mayberg HS, Jones VM, Agan LC, Cook CI, Woldorff MG, et al (2000): Interactive effects in the anterior cingulate of sadness and selective attention: A PET study. Biol
Psychi-atry 47(8S):125–126.
Liotti M, Tucker DM (1992): Right hemisphere sensitivity to arousal and depression. Brain Cogn 18:138 –151.
Little JT, Ketter TA, Kimbrell TA, Danielson A, Benson B, Willis MW, Post RM (1996): Venlafaxine or buproprion responders but not non-responders show baseline prefrontal and paralimbic hypometabolism compared with controls.
Psychopharmacol Bull 32:629 – 635.
Livingston E, Escobar A (1973): Tentative limbic system models for certain patterns of psychiatric disorders. In: Laitinen V, Livingstone KE, editors. Surgical Approaches in Psychiatry. Lancaster, UK: Medical and Technical Publishing, 245–252. MacLean PD (1949): Psychosomatic disease and the visceral brain. Recent developments bearing on the Papex theory of emotion. Psychosom Med 194:338 –353.
Maddock RJ (1999): The retrosplenial cortex and emotion: New insights from functional neuroimaging of the human brain.
Trends Neurosci 22:310 –316.
Mahurin RK (1995): Neurocog: Administration Manual. Seattle: Neurocog Assessment Systems.
Malison RT, Price L, Berman RM, van Dyck CH, Pelton GH, Carpenter L, et al (1998): Reduced midbrain serotonin trans-porter binding in depressed vs healthy subjects as measured by 123b-CIT SPECT. Biol Psychiatry 44:1090 –1098. Malizia A (1997): Frontal lobes & neurosurgery for psychiatric
disorders. J Psychopharmacol 11:179 –187.
Mann CD, Bich Vu T, Hrdina PD (1995): Protein kinase C in rat brain cortex and hippocampus: Effect of repeated administra-tion of fluoxetine and desipramine. J Pharmacol 115:595– 600.
Serial Metabolic Changes with Fluoxetine in MDD BIOL PSYCHIATRY 841
Mann JJ, Huang Y, Underwood MD, Kassir SA, Oppenheim S, Kelly TM, et al (2000): A serotonin transporter gene promoter polymorphism (5-HTTLPR) and prefrontal cortical binding in major depression and suicide. Arch Gen Psychiatry 57:729 – 738.
Martinot JL, Hardy P, Feline A, Huret JD, Mazoyer B, Attar-Levy D, et al (1990): Left prefrontal glucose hypometabolism in the depressed state: A confirmation. Am J Psychiatry 147:1313–1317.
Massou JM, Trichard C, Attar-Levy D, Feline A, Corruble E, Beaufils B, Martinot JL (1997): Frontal 5-HT2A receptors studied in depressive patients during chronic treatment by selective serotonin reuptake inhibitors. Psychopharmacology 133:99 –101.
Mayberg H, Brannan S, Mahurin R, Jerabek P, Brickman J, Tekell J, et al (1997): Cingulate function in depression: A potential predictor of treatment response. Neuroreport 8:1057–1061.
Mayberg H, Liotti M, Brannan S, McGinnis S, Mahurin R, Jerabek P, et al (1999): Reciprocal limbic-cortical function and negative mood: Converging PET findings in depression and normal sadness. Am J Psychiatry 156:675– 682. Mayberg HS (1994): Frontal lobe dysfunction in secondary
depression. J Neuropsychiatry Clin Neurosci 6;428 – 442. Mayberg HS (1997): Limbic-cortical dysregulation: A proposed
model of depression. J Neuropsychiatry Clin Neurosci 9:471– 481.
Mayberg HS, Liotti M, Brannan SK, McGinnis S, Jerabek P, Martin CC, Fox PT (1998): Disease and state-specific effects of mood challenge on rCBF. Neuroimage 7(4):S901. Mayberg HS, Robinson RG, Wong DF, Parikh R, Bolduc P,
Price T, et al (1988): PET imaging of cortical S2-serotonin receptors following stroke: Lateralized changes and relation-ship to depression. Am J Psychiatry 145:937–943.
McCulloch J (1982): Mapping functional alterations in the CNS with C14-deoxyglucose. In: Iversen LL, Iversen SD, Snyder SH, editors. Handbook of Psychopharmacology. Vol 15. New York: Plenum Press, 321– 410.
Meadows ME, Kaplan RF (1994): Dissociation of autonomic and subjective responses to emotional slides in right hemisphere damaged patients. Neuropsychologia 32:847– 856.
Meltzer CC, Price J, Mathis CA, Greer PJ, Houck PR, Lopresti B, et al (1999): [F-18]-Altanserin binding to serotonin (5HT-2A) receptors in late-life depression and Alzheimer’s disease.
Biol Psychiatry 45(8S):61S.
Mesulam MM (1993): Architecture of connectivity within a cingul-fronto-parietal neurocognitive network for directed attention. Arch Neurol 50:279 –284.
Meyer J, Kapur S, Eisfeld B, Brown G, Houle S, Mayberg H, Kennedy S (2000): 5-HT2A receptors in depression pre/post paroxetine. Biol Psychiatry 47(8S):87S.
Meyer J, Kapur S, Houle S, DaSilva J, Owczarek B, Brown G, et al (1999): Prefrontal cortex 5-HT2 receptors in depression: A [18F] setoperone PET imaging study. Am J Psychiatry 156:1029 –1034.
Mintun MA, Fox PT, Raichle ME (1989): A highly accurate method of localizing regions of neuronal activation in the human brain with positron emission tomography. J Cereb
Blood Flow Metab 9:96 –103.
Mongeau R, Blier P, de Montigny C (1997): The serotonergic and noradrenergic systems of the hippocampus: Interactions and effects of antidepressant treatments. Brain Res Rev 23:145–195.
Morecraft RJ, Geula C, Mesulam MM (1993): Architecture of connectivity within a cingulo-fronto-parietal neurocognitive network for directed attention. Arch Neurol 50:279 –284. Nauta WJH (1986): Circuitous connections linking cerebral
cortex, limbic system, and corpus striatum. In: Doane BK, Livingston KE, editors. The Limbic System: Functional
Or-ganization and Clinical Disorders. New York: Raven, 43–54.
Nibuya M, Nestler EJ, Duman RS (1996): Chronic antidepres-sant administration increases the expression of cAMP re-sponse element binding protein (CREB) in rat hippocampus.
J Neurosci 16:2365–2372.
Nobler MS, Ouendo M, Kegeles LS, Malone K, Campbell C, Sackeim JA, Mann JJ (1999): Effects of ECT on regional cerebral metabolic rate: A PET study. Presented at the 38th Annual Meeting of the ACNP, Acapulco.
Nobler MS, Sackeim HA, Prohovnik I, Moeller JR, Mukherjee S, Schnur DB, et al (1994): Regional cerebral blood flow in mood disorders, III. Treatment and clinical response. Arch
Gen Psychiatry 51:884 – 897.
Nurenberg HG, Thompson PM, Hensley PL (1999): Antidepres-sant medication change in a clinical treatment setting: A comparison of the effectiveness of SSRI. J Clin Psychiatry 60:574 –579.
Ongur D, Drevet WC, Price JL (1998): Glial reduction in the subgenual prefrontal cortex in mood disorders. Proc Natl
Acad Sci U S A 95:13290 –13295.
Pandya DN, Yeterian EH (1996): Comparison of prefrontal architecture and connections. Philos Trans R Soc Lond B Biol
Sci 351:1423–1432.
Pardo JV, Pardo PJ, Janer KW, Raichle ME (1990): The anterior cingulate cortex mediates processing selection in the Stroop attentional conflict paradigm. Proc Natl Acad Sci U S A 87:256 –259.
Pardo JV, Reichle ME, Fox PT (1991): Localization of a human system for sustained attention by positron emission tomogra-phy. Nature 349:61– 63.
Passero S, Nardini M, Battistini N (1995): Regional cerebral blood flow changes following chronic administration of antidepressant drugs. Prog Neuropsychopharmacol Biol
Psy-chiatry 19:627– 636.
Petty F, Kramer GL, Wu J, Davis LL (1997): Posttraumatic stress and depression. A neurochemical anatomy of the learned helplessness animal model. Ann N Y Acad Sci 821:529 –532. Phelps ME, Huang SC, Hoffman EH, Selin C, Sokoloff L, Kuhl DE (1979): Tomographic measurement of local cerebral glucose metabolic rate in humans with (F18)2-fluoro-2-deoxydglucose: Validation of method. Ann Neurol 6:371– 388.
Rolls ET (1996): The orbitofrontal cortex. Phil Trans R Soc Lond
B Biol Sci 351:1433–1444.
Sargent PA, Kjaer KH, Bench CJ, Rabiner EA, Messa C, Meyer J, et al (2000): Brain serotonin-1A receptor binding measured by PET with 11C-Way-100635. Arch Gen Psychiatry 57: 174 –180.
Alborzian S, et al (1999): Localized orbitofrontal and subcor-tical metabolic changes and predictors of response to parox-etine treatment in OCD. Neuropsychopharmacology 21:683– 693.
Sheline YI, Wang PW, Gado MH, Csernansky JG, Vannier MW (1996): Hippocampal atrophy in recurrent major depression.
Proc Natl Acad Sci U S A 93:3908 –3913.
Smith GS, Reynolds CF, Pollock B, Derbyshire S, Nofzinger E, Dew MA, et al (1999): Cerebral glucose metabolic response to combined total sleep deprivation and antidepressant treat-ment in geriatric depression. Am J Psychiatry 156:683– 689. Sokoloff L (1983): Measurement of local glucose utilization and its use in localization of functional activity in the CNS of animal and man. Recent Prog Horm Res 39:75–126. Spitzer RL, Williams JBW, Gibbon M, First MB (1988): Manual
for the Structured Clinical Interview for DSMIIIR (SCID).
New York: New York State Psychiatric Institute, Biometrics Research.
Stassen HH, Delini-Stula A, Angst J (1993): Time course of improvement under antidepressant treatment: A survival-analytical approach. Eur Neuropsychopharmacol 3:127–135. Takahashi M, Terwilliger R, Lane C, Mezes PS, Conti M, Duman RS (1999): Chronic antidepressant administration increases the expression of cAMP-specific phosphodiesterase 4A and 4B isoforms. J Neurosci 19:610 – 618.
Talairach J, Tournoux P (1988): Co-Planar Stereotaxic Atlas of
the Brain. New York: Thieme.
Teneback CC, Nahas Z, Speer AM, Molloy M, Stallings LE, Spicer KM, et al (1999): Changes in prefrontal cortex and paralimbic activity in depression following two weeks of daily left prefrontal TMS. J Neuropsychiatry Clin Neurosci 11:426 – 435.
Thase ME, Rush AJ (1995): Treatment-resistant depression. In:
Blood FE, Kupfer DJ, editors. Psychopharmacology: The
Fourth Generation of Progress. New York: Raven, 1081–
1097.
Vaidya VA, Marek GJ, Aghajanian GK, Duman RS (1997): 5-HT2A receptor-mediated regulation of brain-derived neu-rotrophic factor mRNA in the hippocampus and the neocor-tex. J Neurosci 17:2785–2795.
Vogt BA, Nimchinsky EA, Vogt LJ, Hof PR (1995): Human cingulate cortex: Surface features, flat maps, and cytoarchi-tecture. J Comp Neurol 359:490 –506.
Vogt BA, Pandya DN (1987): Cingulate cortex of the rhesus monkey, II: Cortical afferents. J Comp Neurol 262:271–289. Whalen PJ, Bush G, McNally RJ, Wilhelm S, McInerney SC, Jenike MA, Rauch SL (1998): The emotional counting Stroop paradigm: A functional magnetic resonance imaging probe of the anterior cingulate affective division. Biol Psychiatry 44:1219 –1228.
Worsley KJ, Evans AC, Marrett S, Neelin A (1992): Three dimensional statical analysis for CBF activation studies in human brain. J Cereb Blood Flow Metab 12:900 –918. Wu J, Buchsbaum MS, Gillin JC, Tang C, Cadwell S, Wiegand
M, et al (1999): Prediction of antidepressant effects of sleep deprivation on metabolic rates in ventral anterior cingulate and medial prefrontal cortex. Am J Psychiatry 156:1149 – 1158.
Wu JC, Gilin JC, Buchsbaum MS, Hershey T, Johnson JC, Bunney WE Jr (1992): Effect of sleep deprivation on brain metabolism of depressed patients. Am J Psychiatry 149:538 – 543.
Yatham LN, Liddle PF, Dennis J, Shiah I-S, Adam MJ, Lane CJ, et al (1999): Decrease in brain serotonin 2 receptor binding in patients with major depression following desipramine treat-ment. Arch Gen Psychiatry 56:705–711.
Serial Metabolic Changes with Fluoxetine in MDD BIOL PSYCHIATRY 843