DETECTION OF CRACKS IN PAVED ROAD SURFACE
USING LASER SCAN IMAGE DATA
J. Choi *, L. Zhu, H. Kurosu
PASCO Research Institute, PASCO COPORATION, 2-8-10 Higashiyama, Meguro-ku, Tokyo, Japan - (jiaoeh1281, luihnz7801, huisdo8458)@pasco.co.jp
Commission I, ICWG I/Va
KEY WORDS: Paved Road Surface, Crack Detection, Laser Scan Image, Background Subtraction, Image Segmentation
ABSTRACT:
In the current study, we developed a methodology for detecting cracks in the surface of paved road using 3D digital surface model of road created by measuring with three-dimensional laser scanner which works on the basis of the light-section method automatically. For the detection of cracks from the imagery data of the model, the background subtraction method (Rolling Ball Background Subtraction Algorithm) was applied to the data for filtering out the background noise originating from the undulation and gradual slope and also for filtering the ruts that were caused by wearing, aging and excessive use of road and other reasons. We confirmed the influence from the difference in height (depth) caused by forgoing reasons included in a data can be reduced significantl y at this stage. Various parameters of ball radius were applied for checking how the result of data obtained with this process vary according to the change of parameter and it becomes clear that there are not important differences by the change of parameters if they are in a certain range radius. And then, image segmentation was performed by multi-resolution segmentation based on the object-based image analysis technique. The parameters for the image segmentation, scale, pixel value (height/depth) and the compactness of objects were used. For the classification of cracks in the database, the height, length and other geometric property are used and we confirmed the method is useful for the detection of cracks in a paved road surface.
1. INTRODUCTION
In order to keep the service quality of highway traffic safe, comfortable and smooth, a proper maintenance activity for the surface of paved road is very important. And for the proper and efficient maintenance of paved road surface, it is necessary to conduct a well-organized plan based on the correct understanding of existing condition. This makes it possible to repair a damaged road surfaces at the appropriate time before occurrence of any accident and lead a cost reduction by increasing the life-span of them.
Cracks in the surface of a paved road can be the cause of the vibration of the car traveling on the road, splashes of mud at waterhole, percolation of rainwater into the base layer of road which leads to shortening the in-service period of road itself by the damage of lower layer and sandy dust from the part of ditch and thereby the service quality of paved road deteriorates and also the cost of maintenance increases. For all of these reasons, the surveys on the condition of paved road surfaces (hereinafter referred to “road surface survey”) are regularly conducted since long. The traditional way of road surface survey depends on the visual observation of optical imagery by experienced investigator. But there are reports (Henrique, 2013) that visual inspection contains the following problems.
It is labor-intensive, tedious and time-consuming and a considerable effort is required from skilled technicians to manually analyze the full set of acquired images.
It is prone to subjectivity, since two inspectors can produce different analysis outputs over similar distress situations.
Dangerous situations can occur during the survey of high-speed roads, like highways, because surveying personnel often drive along the road at slow speed, often
under 10 km/h. The road traffic safety decreases further, when inspectors stop on the road shoulder and leave the vehicle to measure some distress‟ parameters over the pavement surface, for instance the width of a noticeable crack.
In consideration of the problems stated above, we propose a new methodology to detect cracks in the surface of paved road using 3D data captured by scanner equipped on a vehicle which contains the relative height of road surface based on the light-section method. The following advantages are anticipated by this methodology:
Speeding up of road surface survey by automatic detection of cracks.
Consistent result of road surface survey without dependence on operator.
Traffic stop or control for road surface survey is not necessary.
Providing a versatile road surface survey by contrast independent data format.
2. DATA COLLECTION AND UTILIZATION
2.1 Equipment for acquiring 3D image data
In the present study we developed a methodology to detect cracks in the surface of paved road with a 3D laser scan image data acquired by in-vehicle laser scanner without affecting other traffic flow and the relative height of road surface included in the 3D image data (Beverly, 2008). Experimental data was measured by a laser scanner installed in a vehicle at 2-3 m height from road surface and arranged perpendicular to the road surface as shown in Figure 1(A). Therefore the image data was acquired in the direction of traverse with the road as shown in The International Archives of the Photogrammetry, Remote Sensing and Spatial Information Sciences, Volume XLI-B1, 2016
XXIII ISPRS Congress, 12–19 July 2016, Prague, Czech Republic
This contribution has been peer-reviewed.
Figure 1(B). Due to the direction of laser irradiation, it is assumed that the cracks run in the same direction with road are easier to detect than the traverse direction.
Figure 1. 3D laser scanner vehicle
2.2 3D Laser Scan Image Data
The Figure 2 shows the 3D laser scan image data acquired for verification purpose and the Figure 3 shows the data profile. The detailed information of the data is as follows.
Image Size =1536×1536(pixel) GSD ≑ 0.55(mm/pixel)
Height Resolution ≑ 0.2(mm/number)
Figure 2. 3D laser scan image data
Figure 3. Histogram of 3D laser scanned image data
2.3 Road Surface Profile of 3D Image Data
The Figure 4 shows optical imagery and corresponding profiles of road surface created for this study. The figure on the left (A) is of normal and the right side (B) is of damaged road surface with cracks. The profile on the right side which contains cracks
has a deep slit; on the contrary, the left side of the profile is smooth.
Figure 4. Profile of paved road surface
3. METHODOLOGY
In this section, we have described the methodology to extract the cracks in the paved road surface from 3D laser image data automatically. Crack is thin and long in shape, extends around on plane surface and forms a concave lower than the neighbourhood of flat surroundings in general. For the accuracy of crack measurement by road surface survey vehicle, considering the characteristics stated above, it is defined as follows:
The width of crack is 1mm or more. (Pavement investigation/ Test Method Handbook, 2007; Airport pavement repair procedure and Design example, 2015). Cracks of which length are shorter than 20cm and exist
independently are not counted as crack. (Pavement investigation/ Test Method Handbook, 2007).
Linear cracks which can be regarded as almost one while some are discontinuous are counted as one line of crack. (Pavement investigation/ Test Method Handbook, 2007).
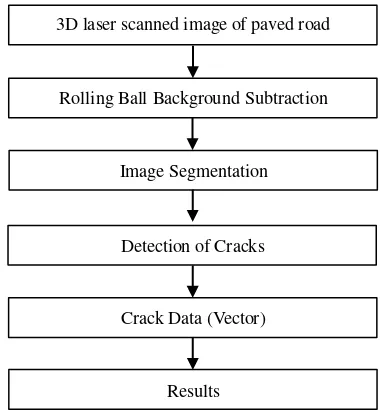
In this study, we set longer than 3cm in length and wider than 1mm in width for designating and detecting the cracks. The Figure 5 shows the work flow.
Figure 5. Work flow (B) (A)
3D laser scanned image of paved road surface
Rolling Ball Background Subtraction
Image Segmentation
Crack Data (Vector)
Results Detection of Cracks
The International Archives of the Photogrammetry, Remote Sensing and Spatial Information Sciences, Volume XLI-B1, 2016 XXIII ISPRS Congress, 12–19 July 2016, Prague, Czech Republic
This contribution has been peer-reviewed.
3.1 Subtraction of the background
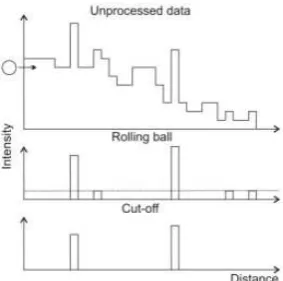
As we can see from the Figure 6 and Figure 7, by subtracting smooth continuous background from the 3D image data and excluding the spots which have a big and sharp difference in relative height, a 3D image data which consists of pixels which have high potential of crack creation. For processing as stated above, “Rolling Ball Background Subtraction” function in the ImageJ software which is based on the concept of the „rolling ball‟ algorithm (Sternberg, 1983) is adopted. Considering the pixel value of the data in use is the relative height of road surface, it is easy to understand how the function of “rolling ball background” works. The radius, 20 pixels is used for the parameter of this function. The following is a quotation of web-site for the better understanding of this function (Oliver, 2012).
“As shown schematically in Figure 8, for a one-dimensional scan of the surface, a ball of a particular radius, selected as a parameter, is rolled along the underside of the surface. The ball can invade peaks of larger width but not those of smaller size. It thereby creates a local background distribution. Regions where the ball can go are subtracted from the image. As a general rule, the smaller the ball radius, the more background is removed. Narrow peaks of low intensities, which persist after „rolling ball’
processing, are subsequently removed by applying an intensity cut-off. For this purpose, a fixed value is subtracted from each pixel's intensity. Finally the remaining intensities of a sample are summed and displayed as a bar chart”.
Figure 6. Pre-processing of Rolling Ball Background Subtraction
Figure 7. Post-processing of Rolling Ball Background Subtraction
Figure 8. Rolling Ball Background Subtraction diagram 3.2 Image Segmentation
For the image segmentation, we used the multi-resolution segmentation of eCognition software. It is an algorithm which locally minimizes the average heterogeneity of image objects with a parameter set of scale, shape/color and compactness/smoothness. The scale parameter defines the maximum allowed heterogeneity for the resulting image objects. The measure of heterogeneity used in the algorithm has a spatial component and a spectral component. The spectral heterogeneity is defined on the values of the spectral responses of the pixels contained in a segment. Spatial heterogeneity is based on two shape attributes: smoothness and compactness (Darwish, 2003; Baatz, 2000; Happ, 2010; Chen, 2005; Dey, 2010).
We adopted this process for dividing into crack areas and other areas by using a 3D laser image data here. The boundary of regions created by the image segmentation is assumed to be occurred at pixels which indicate the relative height difference is above a certain level. Further, since there are various sizes and shapes of the cracks, multilevel (three levels) segmentation was adopted for the image segmentation with the parameter set as shown in the Table 2. Figure 9 is a conceptual diagram of the structure of a three-level image segmentation which creates the 3rd level consisting of two regions (red frame), the 2nd level of 6 regions (blue frame) and the 1st level of 13 regions (black frame). And also one red frame (3rd level; left side), two blue frames (2nd level; right side) and two black frames (1st level; inner side) make one line of crack. The diagram shows regions of a crack included in different levels make a crack which means the connectedness of cracks detected can be increased by merging the results of all levels. This leads to the improvement of the accuracy of crack detection.
Level
Name Scale Shape to Value Compactness
Level1 3 0.1 0.5
Level2 6 0.1 0.3
Level3 9 0.1 0.1
Table 2. Parameter settings for image segmentation
Figure 9. Structure of regions by three-level image segmentation
3.3 Detection of the Cracks
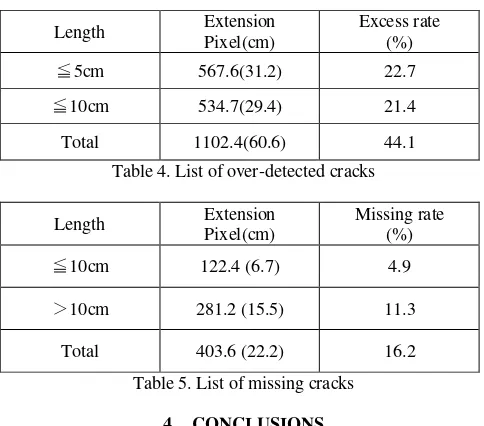
The cracks have some features such as thin and long in shape and deeper than their neighbourhood as stated above. Detection of cracks is implemented using these two characteristics. Figure 10 and Table 3 show the results of verification experiment of the proposed method in this study. The blue lines of this figure are true cracks drawn by eye observation of an expert. The red lines are the results of automatic detection as crack by the proposed methodology. Some of the red lines which exist sparsely away from blue lines are over detected cracks. However as shown in the Table 4, most of the over detected cracks are short threadlike cracks shorter than 5cm or not longer than 10cm at the longest. These short threadlike cracks are counted outside the scope of this study and the detection rate The International Archives of the Photogrammetry, Remote Sensing and Spatial Information Sciences, Volume XLI-B1, 2016
XXIII ISPRS Congress, 12–19 July 2016, Prague, Czech Republic
This contribution has been peer-reviewed.
resulted as 86.4%. When we considered more in detail with respect to detection rate, all errors were due to detection missing. Furthermore, most of detected cracks were located in parallel to the traveling direction of the mobile measurement device. As shown in Figure 10 and Table 5, there are two missing detection errors. The one in the centre of the Figure 10 is due to the short and broken line of crack and the other in the right of the figure is due to the direction which runs in a traverse mobile measurement direction.
Figure 10. Results of the crack detection
Visual Detection
Table 3. Total length of existing and Auto-detected cracks
Length Extension
Table 4. List of over-detected cracks
Length Extension
Table 5. List of missing cracks
4. CONCLUSIONS
In the present study, we proposed a methodology for detecting the cracks automatically in the surface of paved road using 3D digital relative depth data of road surface created by measuring with three-dimensional laser scanner equipped on a vehicle. The “Rolling Ball Background Subtraction” was applied to the 3D digital data for subtracting smooth continuous background of the data and by excluding the places which had a bigger and sharper difference in relative depth.
The image segmentation was performed by multi-resolution
segmentation based on the object-based image analysis technique. The parameters for the image segmentation, scale, pixel value (height/depth) and the compactness of objects were utilized.
We conducted a verification experiment for confirming the effectiveness and the detection rate of crack resulted in 86.4%. There were two errors that occurred as detection missing. The main error located in the right side of the data was caused by the direction of it running in parallel with the measurement device. We already discussed about this matter as a solvable problem by developing new measurement device arranged in x-shaped configuration with two scanners. The other error located in the middle of the data was caused by the broken line of cracks into short. The way how to connect the broken line is one of next challenges of our future studies.
REFERENCES
Baatz, M., 2000. Multi resolution segmentation-an optimization approach for high quality multi scale image segmentation. Angewandte Geographische Informations verarbeitung XII. Karlsruhe, Germany, pp. 12−23.
Beverly D., 2008. A Simple, Low Cost, 3D Scanning System Using the Laser Light-Sectioning Method. I²MTC 2008 – IEEE International Instrumentation and Measurement Technology Conference.
Chen Z., 2005. Multi-scale segmentation of the high resolution remote sensing image. Geoscience and Remote Sensing Symposium, 2005. IGARSS '05. Proceedings. 2005 IEEE International Vol. V, pp. 3682 – 3684.
Darwish A., 2003, Inage Segmentation for the Purpose of Object-Based Classification. Geoscience and Remote Sensing Symposium, 2003. IGARSS '03. Proceedings. 2003 IEEE International (Volume:3 ), pp. 2039 – 2041.
Dey V., 2010. A review on image segmentation techniques with remote sensing perspective. ISPRS TC VII Symposium, IAPRS, Vol. XXXVIII, Part 7A, pp. 31-32.
Happ P. N., 2010. MULTIRESOLUTION SEGMENTATION: A PARALLEL APPROACH FOR HIGH RESOLUTION
IMAGE SEGMENTATION IN MULTICORE
ARCHITECTURES, The International Archives of the Photogrammetry, Remote Sensing and Spatial Information Sciences, Vol. XXXVIII-4/C7.
Henrique O., 2013. Crack Detection and Characterization in Flexible Road Pavements using Digital Image Processing.
Japan Road Association, 2007. Method of Survey and test of Pavement, pp. [1]-162 – [1]-164.
Japan Service Center of Port Engineering, 2015. Pavement of Airport Maintenance Procedures and Design Example, pp. 3-4.
Oliver B., 2012. Detection of Prion Protein Particles in Blood
Plasma of Scrapie Infected Sheep.
http://journals.plos.org/plos-one/article?id=10.1371/journal.pon e.0036620 (29 Feb. 2015).
Sternberg S., 1983. Biomedical image processing. IEEE Computer. 16:22–34.
The International Archives of the Photogrammetry, Remote Sensing and Spatial Information Sciences, Volume XLI-B1, 2016 XXIII ISPRS Congress, 12–19 July 2016, Prague, Czech Republic
This contribution has been peer-reviewed.