www.elsevier.nlrlocateraqua-online
Removal of aquaculture therapeutants by carbon
adsorption
1. Equilibrium adsorption behaviour of single
components
S.J. Aitcheson, J. Arnett, K.R. Murray
), J. Zhang
Department of Mechanical and Chemical Engineering, Heriot-Watt UniÕersity, Edinburgh EH14 4AS, UK
Accepted 6 September 1999
Abstract
This paper presents data on batch equilibrium adsorption onto the coal-based activated carbon
Ž .
207EA Sutcliffe Speakman of Malachite Green, formalin, Chloramine-T and Oxytetracycline. These substances are widely used in aquaculture to control fish parasites and disease, but few data were previously available on their adsorption behaviour. In addition, equilibrium adsorption data
Ž .
for carbon 207EA are presented for the mixed dissolved organic carbon DOC typically present in the water where fish are reared, as well as forD-glucose. Together, these data permit the design of carbon adsorption treatment units that will remove both therapeutants and DOC without causing stress to the fish stock. It further removes the need for land-based recycle systems to discharge these mixed effluents untreated to the environment. q2000 Elsevier Science B.V. All rights
reserved.
Keywords: Carbon-adsorption; Aquaculture; Chloramine-T; Formalin; Malachite Green; Oxytetracycline
1. Introduction
Classical intensive recycle aquaculture systems commonly use nitrifying biological
Ž .
filtration to clean up the recirculating water Westerman et al., 1993 . These filters also
) Corresponding author. Tel. q44-131-449-5111 ext. 4719; fax: q44-131-451-3129; e-mail:
0044-8486r00r$ - see front matterq2000 Elsevier Science B.V. All rights reserved. Ž .
Ž .
effectively remove suspended solids and control dissolved organic carbon DOC levels
ŽBoller and Gujer, 1986 . Diseases are often controlled by the addition of organic.
chemical therapeutants, either directly to the water or in the fish feed. Unfortunately, these biological filters are not designed to remove therapeutants and the shock loading of the therapeutants on the filters may destroy the nitrifying bacteria and thereby lead to unacceptable stress to the fish stock. Therefore, it is common practice simply to purge recycle aquaculture systems once therapeutants have been added, and only to resume normal effluent treatment and recirculation once the therapeutants have been removed.
ŽMurray and McEvoy, 1990 ..
As a classical unit operation for the removal of DOC and colour in potable water
Ž .
treatment, activated carbon filtration Henry and Weinke, 1996; Kiely, 1997 has also been used extensively for post ozone or chlorine treatment. It is clear that it has the potential to effectively remove DOC and certain therapeutants, i.e., Malachite Green,
Ž .
from fish farm waste waters Alderman, 1985 . This would effectively prevent the release of these pollutants to the environment whether as a purge from an intensive aquaculture system or, for that matter, any land-based operations for disease treatment,
Ž
particularly as there is concern and doubt about their fate in the ecosystem Bjorkland et
.
al., 1990; Coyne et al., 1994; Kerry et al., 1994; Smith, 1996; Herwig et al., 1997 . To design carbon filters, this requires fundamental experimental data on the equilibrium adsorption behaviour with respect to activated carbon of the main components of the effluent. However, while DOC removal using carbon filters is often reasonably well characterised empirically, very few adsorption data are available for therapeutants. This paper, therefore, presents experimental data on the batch equilibrium adsorption of the following commonly used therapeutants: Oxytetracycline, Malachite Green,
formal-Ž
dehyde and Chloramine-T, onto the coal-based activated carbon 207EA supplied by
.
Sutcliffe-Speakman . Data are also presented for DOC for the same carbon. These data
can be used directly to model multicomponent adsorption of DOCqtherapeutant
mixtures onto carbon filters. They may also indicate the likely competitive adsorption behaviour of the therapeutants onto carbonaceous matter in the environment, such as might occur in sediment close to fish cages moored in natural water bodies.
2. Materials and methods
2.1. Adsorbates studied in this work
This study investigated the adsorption behaviour of the following substances.
Ž .1 Malachite GreenŽŽC H N23 25 2 2. PŽC H O2 2 4 3. ; oxalate salt; molecular weight 929.
is a triphenylmethane dye that is used extensively in aquaculture as a fungicide and as an ectoparasiticide. It is added directly to the water to give a concentration of up to
Ž .
about 2 ppm. A Malachite Greenqformalin mixture in proportions of about 1:80 is
Ž .
dosage regimes and toxic effects. It is now known to be highly toxic to mammalian cells
Ž .
and to act as a liver tumour promoter Panandiker et al., 1993 . In fish, it is absorbed rapidly through the gills and can persist for over a month in the kidneys and for several
Ž . Ž
weeks in the liver Kasuga et al., 1992 , where it is cytotoxic Zahn and Braunbeck,
.
1995 . It appears to have a strong affinity for organic matter and is adsorbed readily onto
Ž .
suspended organic matter in the water column Sagar et al., 1994 .
Ž .2 Chloramine-T C H ClNO SNa; N-chloro-p-toluene-sulfonamide sodium salt;Ž 7 7 2
. Ž .
molecular weight 227.6 is added directly to the water concentration about 2–4 ppm as a general external antibacterial treatment, but especially to treat Myxobacterial Gill Disease. It is an irritant and an oxidant. At the concentrations used in aquaculture, it has no reported carcinogenicity, but in water, its organic trihalomethane byproducts can be
Ž
carcinogenic in experimental mammals. Neurotoxic effects by the inhibition of acetyl
.
cholinesterase activity of Chloramine-T have been reported in humans and amphibians
ŽWang and Minami, 1996 ..
Ž .3 Oxytetracycline C H N OŽ 22 24 2 9P2H O, molecular weight 496.5 is widely used as2 .
an antibacterial agent and is usually administered in fish feed, from which it may leach
Ž
into the water column. It appears to persist in the environment for many months Hansen
.
et al., 1992; Pouliquen et al., 1992 , mainly in sediment where it disrupts the normal community structure of bacteria and encourages the growth of Oxytetracycline-resistant
Ž .
bacteria Kerry et al., 1994 . Oxytetracycline is also widely used as an antibiotic in other veterinary applications and in human medicine, so that its indiscriminate release to the environment could eventually reduce its efficiency in these fields by increasing the Oxytetracycline resistance of human and animal pathogens. Oxytetracycline may also
Ž .
interfere with nitrification processes Klaver and Matthews, 1994 . It appears to be
Ž .
relatively stable and thus most persistent in anoxic sediment Samuelsen, 1988 .
Ž .4 Formaldehyde CH O, molecular weight 30.03 is used in the aqueous formŽ 2 . Žformalin as a fungicide in combination with, or instead of, Malachite Green. Both.
mixtures and pure formalin therapeutants are applied directly to the water. A typical
Ž
concentration of formalin in the water would be 15–20 ppm when used alone Austin,
.
1985 . A typical mixture would be 1 part Malachite Green to 80 parts formalin by weight. Formaldehyde is classed as a probable human carcinogen. It appears to be able to denature proteins or to form crosslinkages that prevent protein unfolding, and so can be cytotoxic or damage DNA.
Ž .5 Mixed DOC. For this study an artificial effluent was created by mixing together starch, fish oil and urea to give individual DOC contributions of 5.1, 0.7 and 1.3 mg Crl, respectively. The total carbon concentration of the mixture was 7.1 mgrl. This artificial effluent composition is the same as the average composition of a real effluent from the Heriot-Watt University fish farm, except that it omits the small carbon
Ž .
contribution 0.1 mg Crl present from protein in the real effluent. The effluent was diluted to 3 and 5 ppm DOC for the adsorption experiments.
Ž .6 D-glucose C O H , molecular weight 180 . The adsorption behaviour of thisŽ 6 6 12 .
substance should indicate the behaviour of any simpler sugars present in an aquaculture effluent.
2.2. Analytical methods
The carbon used for this study was a coal-based granular activated carbon, 207EA, supplied by Sutcliffe Speakman, with a BET surface area of 1000 m2rg and bulk density of 0.46. The carbon was washed with distilled water, oven dried at 1008C for 24
Ž .
h and crushed to a mesh size of 12=40 uus 0.6–1.7 mm . Each single component
Ž .
isotherm experiment involved allowing time nominally 20–30 h for equilibration of 100"0.1 ml of bulk solution with 0.5"0.01 g of the activated carbon 207EA. Initial concentrations were 1–10 ppm for Malachite Green and Chloramine-T, 0.1–1 ppm for Oxytetracycline, 5–20 ppm forD-glucose, 3–5 ppm for DOC in the artificial effluent, and 1–20 ppm for formaldehyde. For some conditions, the Oxytetracycline data were extended to include an initial concentration of 20 ppm. This is much higher than the concentration that would occur in a real effluent, but permits comparison of its adsorption strength with that of other adsorbates at similar initial molar concentrations. Temperature was controlled to within"0.58C by immersing the experimental flask in a
thermostatically controlled shaker water bath. pH and ionic strength were controlled by means of buffer solutions comprising various mixtures of KH PO , Na HPO ,2 4 2 4 Na B O , NaCl and HCl. The experiments were done at pH values of 6, 7 and 8.5,2 4 7 temperatures of 5, 10, 20 and 308C, and ionic strengths of 0.2, 2 and 20 mM. These
experimental conditions cover most of the range of pH, temperature and ionic strength likely to occur in real aquaculture effluents.
Maximum adsorption capacities were obtained by extending single component
Ž .
isotherms for bulk solutions i.e., the substance of interest dissolved in distilled water to
Ž .
very high initial concentrations several thousands ppm . The procedure was similar to the single component isotherms experiments described above, except that no buffers were used in these experiments. The bulk solutions of the therapeutants have pH values
Žmeasured at 50 ppm as follows: Malachite Green, pH 5.3; Oxytetracycline, pH 3.9;.
Chloramine-T, pH 6.7; and formaldehyde, pH 6.1.
Concentrations of Malachite Green, Chloramine-T, Oxytetracycline and D-glucose were obtained from the UV absorbance measured by a Pye Unicam SP1700 UV
Ž
Spectrophotometer, which had previously been calibrated for each substance Arnett and
.
Zhang, 1994 . Separate calibrations for the three different pH values were used for Malachite Green measurements because the buffers had a significant effect on ab-sorbance. A single calibration line could be used for each of the other substances as the buffers had no observable effect on their UV absorbance. To obtain the D-glucose concentration, the sample was first reacted with a mixture of phenol and H SO for2 4
10–20 min at 258C and the UV absorbance of the product was measured. UV
absorbance was measured at the following wavelengths: ls615 nm for Malachite
Green; ls200 nm for Oxytetracycline and for Chloramine-T; and ls488 nm for
D-glucose. Errors in equilibrium concentrations measured by UV spectrophotometry were 0.032–0.052 ppm for Chloramine-T, 0.052 ppm for Oxytetracycline, 0.094–0.7
Ž . Ž . Ž
ppm forD-glucose, and 0.01–0.03 ppm pH 6 , 0.043 ppm pH 7 and 1.052 ppm pH
.
8.5 for Malachite Green. Errors in amounts adsorbed per kg of carbon were: 0.056–0.063
Ž . Ž . Ž .
Ž . Ž
0.053–0.057 grkg Malachite Green at pH 6 ; 0.059–0.063 grkg Malachite Green at
. Ž . Ž .
pH 7 ; and 0.260–0.264 grkg Malachite Green at pH 8.5 Arnett and Zhang . Formaldehyde was measured using a Hach DR2000 spectrophotometer and following
Ž .
the MBTH method: 3-methyl-2-benzothiazoline hydrazone MBTH was added in
excess to the sample containing formaldehyde. MBTH reacts with the formaldehyde to form an azine, then excess MBTH is oxidised by addition of a developing solution
Žsulphuric acid plus ferric chloride . The oxidised MBTH reacts with the azine to form a.
species with an intense blue colour, with intensity proportional to the original concentra-tion of formaldehyde. The method is extremely sensitive: errors in measured equilibrium concentrations of formaldehyde were 1 ppb or lower. Errors in the amount of formal-dehyde adsorbed were 0.050–0.057 grkg of carbon.
Adsorption of DOC in the artificial mixed effluent was quantified as the difference in DOC concentration of two aliquots of each sample, where both aliquots had experienced identical conditions, except that one was equilibrated with the activated carbon while the other was not exposed to the adsorbent. DOC concentrations in the artificial effluent were measured using a Shimanzu TOC-500 carbon analyser with a combustion system
Ž .
and NDIR detector. Uncertainties expressed as 2=standard error in total carbon concentration measurements were 1–1.7 ppm.
3. Results
3.1. Single component isotherm parameters
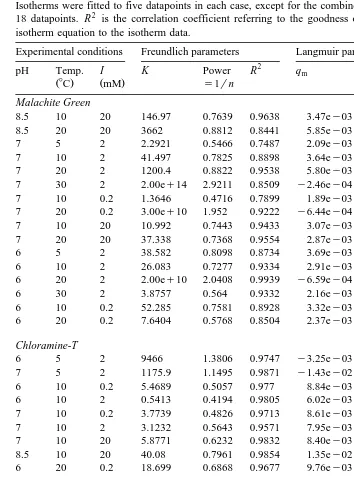
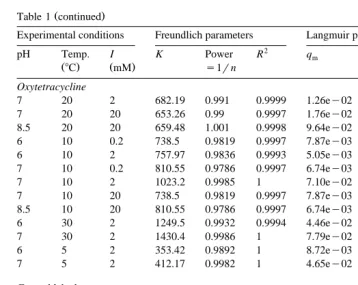
Table 1 gives the fitted Freundlich parameters for the therapeutants and forD-glucose for a range of experimental conditions. Langmuir isotherms were fitted to some of the data and the Langmuir parameters are also given in Table 1. The full list of experimental data to which these isotherms were fitted is available on request from the authors.
The Freundlich isotherm is defined as:
qsKCeq1rn,
Ž .
1where q is the number of moles adsorbed per kg of carbon, Ceq is the equilibrium molar concentration of the liquid, and K and 1rn are constants obtained empirically. For each substance, the values of K and 1rn were obtained for each set of experimental conditions by unweighted least squares linear regression of five measured ln q values on their corresponding lnCeq values. This procedure attaches greater weight to the lower concentration data.
The Langmuir isotherm is defined as:
qs
Ž
q K Cm L eq. Ž
r 1qK CL eq.
,Ž .
2where Ceq and q are defined as before and where qm and KL are empirically
Table 1
Freundlich and Langmuir parameters fitted to experimental isotherm data for single components of aquaculture effluents adsorbed onto carbon 207EA
Isotherms were fitted to five datapoints in each case, except for the combined DOC dataset, which comprised 18 datapoints. R2 is the correlation coefficient referring to the goodness of fit of the linearised Freundlich isotherm equation to the isotherm data.
Experimental conditions Freundlich parameters Langmuir parameters Adsorption efficiency
8.5 10 20 146.97 0.7639 0.9638 3.47ey03 2.67eq06 95–98
8.5 20 20 3662 0.8812 0.8441 5.85ey03 5.75eq06 99–100
7 5 2 2.2921 0.5466 0.7487 2.09ey03 1.67eq06 78–96
7 10 2 41.497 0.7825 0.8898 3.64ey03 3.05eq05 71–88
7 20 2 1200.4 0.8822 0.9538 5.80ey03 1.68eq06 97–99
7 30 2 2.00eq14 2.9211 0.8509 y2.46ey04 y6.56eq05 44–85
7 10 0.2 1.3646 0.4716 0.7899 1.89ey03 8.71eq06 85–99
7 20 0.2 3.00eq10 1.952 0.9222 y6.44ey04 y4.90eq06 96–98
7 10 20 10.992 0.7443 0.9433 3.07ey03 1.38eq05 55–76
7 20 20 37.338 0.7368 0.9554 2.87ey03 9.72eq05 83–93
6 5 2 38.582 0.8098 0.8734 3.69ey03 1.68eq05 58–79
6 10 2 26.083 0.7277 0.9334 2.91ey03 6.88eq05 81–92
6 20 2 2.00eq10 2.0408 0.9939 y6.59ey04 y2.02eq06 88–96
6 30 2 3.8757 0.564 0.9332 2.16ey03 2.76eq06 87–97
6 10 0.2 52.285 0.7581 0.8928 3.32ey03 7.84eq05 86–94
6 20 0.2 7.6404 0.5768 0.8504 2.37ey03 5.02eq06 92–99
Chloramine-T
6 5 2 9466 1.3806 0.9747 y3.25ey03 y2.38eq04 24–45
7 5 2 1175.9 1.1495 0.9871 y1.43ey02 y1.22eq04 44–51
6 10 0.2 5.4689 0.5057 0.977 8.84ey03 2.15eq06 94–99
6 10 2 0.5413 0.4194 0.9805 6.02ey03 3.59eq05 64–96
7 10 0.2 3.7739 0.4826 0.9713 8.61ey03 2.21eq06 92–99
7 10 2 3.1232 0.5643 0.9571 7.95ey03 1.68eq05 71–92
7 10 20 5.8771 0.6232 0.9832 8.40ey03 1.29eq05 67–88
8.5 10 20 40.08 0.7961 0.9854 1.35ey02 7.28eq04 73–85
6 20 0.2 18.699 0.6868 0.9677 9.76ey03 1.79eq05 76–88
6 20 2 57.495 0.7911 0.9816 1.31ey02 8.50eq04 74–84
7 20 0.2 28.09 0.7364 0.9911 1.16ey02 9.80eq04 73–86
7 20 2 26.874 0.7419 0.9866 1.07ey02 9.42eq04 71–82
7 20 20 61.746 0.8429 0.9889 1.73ey02 2.90eq04 64–72
8.5 20 20 61.459 0.819 0.9783 1.51ey02 4.87eq04 70–81
6 30 2 720.28 1.0052 0.9801 y8.59ey02 y7.52eq03 73–79
7 30 2 275.03 0.9092 0.982 5.52ey02 1.68eq04 79–85
7 10 2 9.7028 0.6479 0.9617 70–92
7 20 2 28.104 0.7458 0.9883 67–82
7 20 2 6.6835 0.6351 0.9749 55–82
Oxytetracycline
6 20 0.2 778.87 0.9985 1 6.44ey02 1.24eq04 80
6 20 2 911.82 0.9992 0.9999 y9.75ey03 y9.37eq04 82
Ž .
Table 1 continued
Experimental conditions Freundlich parameters Langmuir parameters Adsorption efficiency
7 20 2 682.19 0.991 0.9999 1.26ey02 6.36eq04 79–80
7 20 20 653.26 0.99 0.9997 1.76ey02 4.38eq04 79–80
8.5 20 20 659.48 1.001 0.9998 9.64ey02 6.75eq03 76–77
6 10 0.2 738.5 0.9819 0.9997 7.87ey03 1.28eq05 83–84
6 10 2 757.97 0.9836 0.9993 5.05ey03 2.02eq05 82–84
7 10 0.2 810.55 0.9786 0.9997 6.74ey03 1.75eq05 85–86
7 10 2 1023.2 0.9985 1 7.10ey02 1.48eq04 84
7 10 20 738.5 0.9819 0.9997 7.87ey03 1.28eq05 83–84
8.5 10 20 810.55 0.9786 0.9997 6.74ey03 1.75eq05 85–86
6 30 2 1249.5 0.9932 0.9994 4.46ey02 3.14eq04 87–88
7 30 2 1430.4 0.9986 1 7.79ey02 1.88eq04 88
6 5 2 353.42 0.9892 1 8.72ey03 4.86eq04 67–68
7 5 2 412.17 0.9982 1 4.65ey02 9.14eq03 68
Formaldehyde
6 10 0.2 86.313 0.7442 0.8305 73–92
7 20 2 2.3136 0.3849 0.4686 74–99
D-glucose
7 20 2 15225 1.4886 0.9986 44–58
All DOC data combined
6–8.5 5 to 30 0.2 to 20 6.5216 0.6426 0.6011 7–68
The mixed DOC results were rather scattered and did not define clear isotherms. However, the artificial effluent data-field straddles the D-glucose isotherm, suggesting that suitable Freundlich parameters for real effluent could be broadly similar to those for D-glucose.
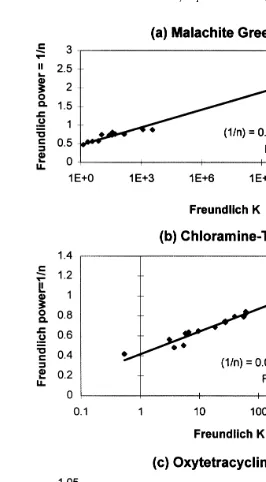
Fig. 1 shows log–linear plots of the fitted Freundlich 1rn parameters vs. their corresponding K value for three therapeutants for all of the experimental conditions. A strong linear relationship exists between ln K and 1rn for the Malachite Green data
ŽFig. 1 aŽ ..and for the Chloramine-T data Fig. 1 b .Ž Ž ..
Let this relationship be expressed as:
1rnsX ln KqY ,
Ž .
3where X and Y are constants equal to the slope and intercept of the graph, respectively. The Freundlich isotherm can be rewritten to:
w
x
1rns ln qyln K rln C .eq
Ž .
4Equating both expressions for 1rn gives:
Ž .
Fig. 1. Freundlich parameters obtained for adsorption onto carbon 207EA of Malachite Green a , Chloramine-T
Ž .b and Oxytetracycline c under a range of experimental conditions.Ž .
The Freundlich parameters fitted to the Oxytetracycline data vary little with
experi-Ž Ž ..
about 600 and 900. Thus, there is no difficulty in picking reasonable Freundlich parameters for Oxytetracycline for any conditions.
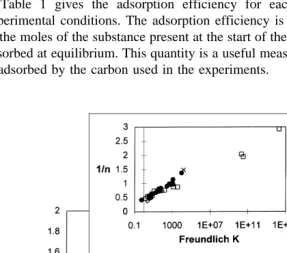
Fig. 2 plots 1rn vs. ln K for all the adsorbates together, including both therapeutants and DOC. Collectively, these parameters also define a strong linear relationship that is independent of experimental conditions.
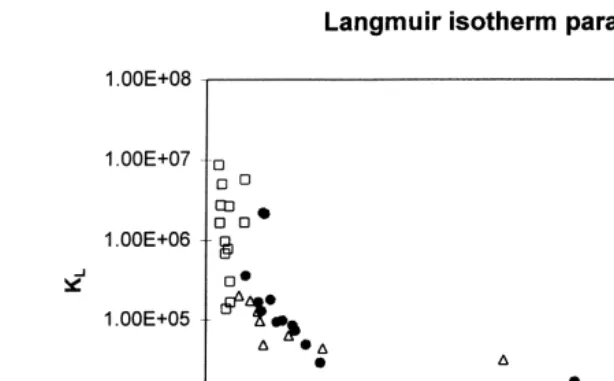
In general, the Langmuir isotherm did not fit the data as well as the Freundlich isotherm equation; but, as with the Freundlich isotherm parameters, the two empirically determined constants, KL and q , for every data set for every adsorbate all lie on am
Ž .
single correlation curve Fig. 3 . Thus, a single measurement of q and Ceq is sufficient to obtain the appropriate KL and qm values for modelling adsorption under a particular set of conditions.
3.2. Strength of adsorption
Table 1 gives the adsorption efficiency for each adsorbate under the different experimental conditions. The adsorption efficiency is expressed here as the percentage of the moles of the substance present at the start of the experiment that were found to be adsorbed at equilibrium. This quantity is a useful measure of how strongly the substance is adsorbed by the carbon used in the experiments.
Fig. 3. Langmuir isotherm parameters obtained for adsorption onto carbon 207EA for the therapeutants Malachite Green, Oxytetracycline and Chloramine-T under various experimental conditions. Like the Fre-undlich parameters, they fall on a single correlation curve for the carbon investigated.
Table 2 summarises the observed order of strength of adsorption for the substances studied under various experimental conditions. Under all conditions, the therapeutants
Table 2
Relative strength of adsorption onto carbon 207EA observed for components of aquaculture effluents I is ionic strength in mM and DOC is mixed DOC.
Ž . Ž .
Temp. 8C pH I Relative adsorbability strongest to weakest
5 6 2 Malachite GreenGOxytetracycline)Chloramine-T)DOC
5 7 2 Malachite Green)Oxytetracycline)Chloramine-T)DOC
10 6 0.2 Chloramine-T)Malachite Green)Formaldehyde)
Oxytetracycline)DOC
10 6 2 Chloramine-TGMalachite Green)Oxytetracycline)DOC
10 7 0.2 Chloramine-T)Malachite Green)Oxytetracycline)DOC
10 7 2 Malachite GreenGOxytetracyclineGChloramine-T)DOC
10 7 20 OxytetracyclineGChloramine-T)Malachite Green)DOC
10 8.5 20 Malachite Green)Oxytetracycline)Chloramine-T)DOC 20 6 0.2 Malachite Green)Chloramine-T)Oxytetracycline)DOC
20 6 2 Malachite Green)OxytetracyclinesChloramine-T)DOC
20 7 0.2 Malachite Green)Chloramine-TGOxytetracycline)DOC
20 7 2 Formaldehyde)Chloramine-TGOxytetracycline)
Malachite GreenGD-glucosesDOC
20 7 20 Malachite Green)Oxytetracycline)Chloramine-T)DOC 20 8.5 20 Malachite Green)OxytetracyclineGChloramine-T)DOC
30 6 2 Malachite Green)Oxytetracycline)Chloramine-T)DOC
were much more strongly adsorbed than the mixed DOC or D-glucose. This indicates that in mixed effluents the therapeutants are likely to be preferentially adsorbed, leading to a reduction in DOC removal. Malachite Green was usually more strongly adsorbed than Oxytetracycline, and Oxytetracycline was usually as strongly adsorbed or more strongly adsorbed than Chloramine-T, except in some of the 108C experiments at
relatively low pH and ionic strength.
Fig. 4. Isotherms for single therapeutants dissolved in water at 238C with no buffers. These isotherms extend to
Temperature was the parameter that had the largest effect on the adsorption efficiency
Ž .
of the therapeutants, with the lowest adsorption efficiencies 50% or lower only
Ž .
observed at the lowest temperature 58C . The effects of pH and ionic strength were
much smaller, although adsorption efficiency seemed to be lowered by high ionic strengths. Adsorption efficiency of the therapeutants seemed to be greatest at 10–208C,
pH 7 and an ionic strength of 0.2–2 mM.
3.3. Maximum adsorption capacities
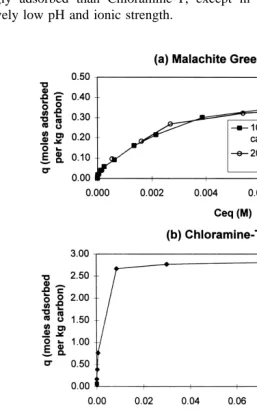
Fig. 4 shows isotherms obtained for single components for initial concentrations ranging from one to several thousand ppm. The amount adsorbed where the isotherm flattens off parallel to the concentration axis is interpreted to be the maximum monolayer adsorption capacity of the carbon for that substance. These maximum adsorption capacities differ greatly from substance to substance and are: 325 g or 0.35 molesrkg of carbon for Malachite Green; 614 g or 2.7 molesrkg carbon for Chlo-ramine-T; and 60 g or 0.12 molesrkg of carbon for Oxytetracycline.
The Oxytetracycline isotherm has a step in it, suggesting that multiple layers are forming at high concentrations. The maximum monolayer adsorption capacity reported above refers to the lower step. The upper step in the Oxytetracycline isotherm corre-sponds to a maximum adsorption capacity of about 99 g or 0.2 molesrkg carbon; this may be the ‘‘true’’ or multilayer adsorption capacity. The formation of multiple layers may indicate that the concentration is approaching the solubility of Oxytetracycline in water.
Ž .
The formaldehyde isotherm not shown in Fig. 4 shows no sign of flattening off, and indicates a formaldehyde adsorption capacity of at least 79 kgrkg carbon or 1800 molesrkg carbon.
4. Discussion
Aquaculture effluents are typically very dilute solutions of the adsorbates of interest, and so they fulfil one of the main conditions for which use of the Freundlich isotherm is
Ž .
valid Urano et al., 1981 . In practice, the Freundlich isotherm appears to fit well to most of the single component experimental data acquired in this study, and the fitted
Ž .
Freundlich parameters form an extremely coherent group of results Figs. 1 and 2 . For these reasons, and because the use of the Freundlich isotherm considerably simplifies
Ž .
some multicomponent adsorption modelling calculations Crittenden et al., 1985 , the Freundlich isotherm is preferred for describing adsorption of components of aquaculture effluents. The Langmuir isotherm equation fits the data less well, but would be more
Ž .
appropriate for those isotherms that constrain adsorption capacity e.g., Fig. 4 by extending to very high liquid concentrations of the adsorbates.
models to predict the equilibrium adsorption behaviour of any mixture. The apparent adherence of the DOC data to the linear relationship between all of the Freundlich parameters of all the adsorbates is particularly useful because it constrains which Freundlich parameters are reasonable for the DOC in real effluents, despite the fact that this DOC is usually very poorly characterised.
The linear relationships between the Freundlich parameters appear to be
manifesta-Ž .
tions of the well-known ‘‘Characteristic Curve’’ of Polanyi 1920a; b ; where, for a
Ž .
particular adsorbent, all the Freundlich K values or adsorbate volumes and the
adsorption potentials lie on a single correlation curve, irrespective of temperature or
Ž .
which components are considered. Urano et al. 1981 made more explicit the connec-tion between the Freundlich parameters and the characteristic curve by combining the following expressions relating to single component adsorption:
The Polanyi expression for the adsorption potential:
EeqsRT ln C
Ž
srC ..
Ž .
6Ž .
The expression for number of moles adsorbed Roginsky, 1948 :
Emax
Qs
H
f E d E.Ž .
Ž .
7Eeq
Ž .
The hypothetical exponential adsorption energy E distribution:
f E
Ž .
sAeya E.Ž .
8The resulting expression is analogous to the Freundlich isotherm equation:
A
In the above expressions, A and a are constants, R is the gas constant, T is absolute temperature, C is the solubility of the adsorbate, C is the equilibrium concentration ofs adsorbate in the liquid and Emax is the adsorption potential in an infinitely dilute solution.
For single component adsorption, rearranging the expression for K gives:
1rns y
Ž
1rln Cs.
ln Kyln AŽ
ra.
Ž .
10or:
T ln Css
Ž
1raR ln A. Ž
raK ..
Ž .
11To obtain the straight-line relationship between 1rn and ln K with this formulation would require the following to be true:
Ž
1. a and A are constant i.e., each molecule ‘‘sees’’ the same adsorption energy
.
2. either the solubility is approximately constant over the temperature range considered,
Ž .
or 1rlnC is a linear function of T requiring K to be approximately constant .Ins addition, this formulation implies that:
Ž .
3. The slope of the graph of 1rn vs. ln K should be y1rlnCs and the intercept
Ž .
should correspond toyln Ara .
4. The higher values of 1rn should correspond to higher temperatures.
In fact, only some of these conditions turn out to be physically true, suggesting that the Polanyi adsorption model andror the exponential energy distribution are only of limited use in describing the adsorption of aquaculture therapeutants. In particular, the observed solubilities of Malachite Green and Chloramine-T are considerably higher than those suggested by the slopes of the graphs and the relationship between 1rn and temperature is not monotonic.
Ž
The values of ‘‘a’’ in the expression for the adsorption energy distribution where
.
‘‘a’’ is the width of the distribution can be computed directly from each fitted
Ž .
Freundlich 1rn value Table 1 . In theory, the larger the value of ‘‘a’’, the narrower is the adsorption energy distribution, i.e., the fewer are the types of site that are involved in
Ž
adsorption. On a histogram with site types listed in order of their adsorption energy not
.
shown , most of the values of ‘‘a’’ for a particular therapeutant form a single narrow peak, indicating that for a particular adsorbate, ‘‘a’’ varies little with temperature. However, the computed mean values of ‘‘a’’ for different adsorbates differ by at least a factor of two, i.e., the distributions for different adsorbates cannot be strictly congruent. The Freundlich parameters presented here describe empirically the equilibrium partitioning of a substance between the adsorbed phase and the liquid. However, the
Ž
strength of adsorption of a single component expressed as a proportion of the substance
.
that is adsorbed at equilibrium is dependent on the initial concentration, C , as well as0 on the Freundlich parameters. Meaningful comparisons between the inherent adsorbabil-ity of different components require this proportion to be computed at the same initial
Ž .
molar concentration C0 for each substance and under the same conditions. In real situations, the initial concentration is usually known or assumed, but the equilibrium concentration is usually unknown.
To compare strengths of adsorption for substances at initial concentrations outside the range examined in this study, one must specify the Freundlich parameters and the initial concentration, and then solve the following two simultaneous equations for Ceq and q:
qsKC1rn
Ž
the Freundlich isotherm ,.
Ž .
ieq
qs
Ž
C0yCeq.
rload,Ž .
iiŽ Ž .. Ž Ž ..
where loads mass of activated carbon kg r volume of liquid l in the experiment. Finally, the estimate of q is used to compute the proportion of the substance that will
UŽ . be adsorbed, i.e., load qrC .0
Ž . Ž .
The aboved Eqs. i and ii are usually not soluble analytically, but they can very
Ž .
easily be solved graphically by plotting q as a function of Ceq using Eq. i and then Eq.
Ž .ii and observing where the two curves intersect. This is also true if Eq. i is theŽ Ž . .
Langmuir isotherm rather than the Freundlich isotherm . As the Freundlich power 1rn
Ž Ž . Ž Ž . . Ž
Žload K , i.e., and the graphs of C. . eq and q vs. C0 become straight lines. This is approximately true of single component Oxytetracycline behaviour.
These considerations, plus the adsorption efficiencies observed in the experiments
ŽTable 1 , indicate that for the typical concentrations of components present in aquacul-.
ture effluents, the therapeutants Malachite Green and Oxytetracycline are always, and Chloramine-T is usually, more strongly adsorbed onto the carbon than the background DOC. Thus, failure to include this feature in the design of adsorption treatment systems might result in impaired DOC removal when therapeutants are present.
The prediction of relatively strong adsorption of Oxytetracycline finds support in the
Ž . Ž .
field observations of Smith et al. 1994 that by a rough mass balance calculation most of the Oxytetracycline used on a real fish farm over a measured period was retained by the drum filter used for effluent treatment. Strong adsorption of Oxytetracycline to
Ž .
organic components in the sediment Bjorkland et al., Coyne et al., Samuelson would explain its relatively high concentration there and its relatively rapid disappearance from
Ž .
the water column. This, together with its stability Pouliquen et al., 1992 in the anoxic conditions common within organic-rich sediment, could explain its persistence in natural sediments. The relatively strong adsorption of Malachite Green indicated by our experiments is also consistent with the strong affinity of Malachite Green for organic
Ž .
matter reported by Sagar et al. 1994 .
5. Conclusions
This study has obtained a substantial body of data on the batch equilibrium adsorption behaviour of some of the commonest therapeutant components of aquaculture effluents under a wide range of conditions. The isotherm parameters reported here allow models of equilibrium multicomponent adsorption for activated carbon to account much more accurately than was hitherto possible for the presence of chemical therapeutants in aquaculture effluents. The observations show that the therapeutants are much more strongly adsorbed onto activated carbon than background DOC. Thus, accurate predic-tions of multicomponent adsorption are very important in designing adsorption units for effluent treatment that can maintain adequate DOC removal in the presence of therapeu-tants.
Acknowledgements
We gratefully acknowledge financial support from the Biology and Biotechnology
Ž .
Research Council through grant CTE01769 to J. Arnett and from Heriot-Watt Univer-sity. We thank M. Miller and E. McEvoy for technical assistance.
References
Alderman, D.J., 1985. Malachite Green: a review. J. Fish Dis. 8, 289–298.
Austin, B., 1985. Antibiotic pollution from fish farms: effects on aquatic microflora. Micro. Sci. 2, 113–117. Bjorkland, H.V., Bondestam, J., Bylund, G., 1990. Residues of oxytetracycline in wild fish and sediments
from fish farms. Aquaculture 86, 359–367.
Boller, M., Gujer, W., 1986. Nitrification in tertiary trickling filters followed by deep-bed filters. Water Res.
Ž .
20 11 , 1363–1373.
Coyne, R., Hiney, M., O’Conner, B., Kerry, J., Cazabon, D., Smith, P., 1994. Concentration and persistence of oxytetracycline in sediments under a marine salmon farm. Aquaculture 123, 31–42.
Crittenden, J.C., Luft, P., Hand, D.W., Oravitz, J.L., Loper, S.W., Arl, M., 1985. Prediction of multicompo-nent adsorption equilibria using ideal adsorbed solution theory. Environ. Sci. Technol. 19, 1037–1043. Hansen, P.K., Lunestad, B.T., Samuelsen, O.B., 1992. Effects of oxytetracycline, oxolinic acid and flumequine
on bacteria in an artificial marine fish farm sediment. J. Microbiol. 38, 1307–1312.
Henry, J.G., Weinke, G.W., 1996. Environmental Science and Engineering, 2nd edn. Prentice-Hall. Herwig, R.P., Gray, J.P., Weston, D.P., 1997. Antibacterial resistant bacteria in surficial sediments near
salmon net-cage farms in Puget Sound, Washington. Aquaculture 149, 263–283.
Kasuga, Y., Hishida, M., Tanahashi, N., Arai, M., 1992. Studies on the disappearance of Malachite Green in cultured rainbow trout. J. Food Hyg. Soc. Jpn. 33, 539–542.
Kerry, J., Hiney, M., Coyne, R., Cabazon, D., NicGabhainn, S., Smith, P., 1994. Frequency and distribution of resistance to oxytetracycline in microorganisms isolated from marine fish farm sediments. Aquaculture 123, 43–54.
Kiely, G., 1997. Environmental Engineering. McGraw-Hill, ISBN 0-07-709127-2.
Klaver, A., Matthews, R.A., 1994. Effects of oxytetracycline on nitrification in a model aquatic system. Aquaculture 123, 237–247.
Murray, K.R., McEvoy, E., 1990. Disease treatment procedures in the intensive re-cycle salmon hatchery at Heriot-Watt. COSHH Technical Report, ‘Therapeutants’, Aquaculture Group, Department of Mechanical and Chemical Engineering, Heriot-Watt University, Edinburgh.
Panandiker, A., Fernandes, C., Rao, T.K.G., Rao, K.V.K., 1993. Morphological transformation of Syrian-ham-ster embryo cells in primary culture by Malachite Green correlates well with the evidence for formation of reactive free radicals. Cancer Lett. 74, 31–36.
Polanyi, M., 1920a. Neueres uber adsorption und ursache der adsorptionskrafte. Z. Elektrochem. 26, 370–374.¨ ¨
Polanyi, M., 1920b. Adsorption aus Losungen beschrankt loslicher stoffe. Z. Phys. 2, 111–116.¨ ¨ ¨
Pouliquen, H., LeBris, H., Pinault, L., 1992. Experimental study of the therapeutic application of oxytetracy-cline, its attenuation in sediment and sea-water, and implications for farm culture of benthic organisms. Mar. Ecol.: Prog. Ser. 89, 93–98.
Roginsky, S.S., 1948. Adsorption and catalysis on heterogeneous surfaces. USSR Academy of Sciences, Moscow.
Sagar, K., Smyth, M.R., Wilson, J.G., McLaughlin, K., 1994. High-performance liquid-chromatographic determination of the triphenylmethane dye, Malachite Green, using amperometric detection at a carbon-fibre microelectrode. J. Chromatogr., A 659, 329–336.
Samuelsen, O.B., 1988. Degradation of oxytetracycline in seawater at two different temperatures and light intensities, and the persistence of oxytetracycline in the sediment from a fish farm. Aquaculture 83, 7–16. Smith, P., 1996. Is sediment deposition the dominant fate of oxytetracycline used in marine salmonid farms: a
review of available evidence. Aquaculture 146, 157–169.
Smith, P., Donlon, J., Coyne, R., Cabazon, D.J., 1994. Fate of oxytetracycline in a fresh-water fish farm — influence of effluent treatment systems. Aquaculture 120, 319–325.
Urano, K., Koichi, Y., Nakazawa, Y., 1981. Equilibria for adsorption of organic compounds on activated carbons in aqueous solutions: 1. Modified Freundlich isotherm equation and adsorption potentials of organic compounds. J. Coll. Inter. Sci. 81, 477–485.
Wang, Z.Y., Minami, M., 1996. Effects of chloramine on neuronal cholinergic factors — further case studies of toxicity mechanism suggested by an unusual case record. Biog. Amines 12, 213–223.
Westerman, P.W., Losardo, T.M., Wildhaber, M.L., 1993. Evaluation of various bilfilters in an intensive recirculating fish production facility. Techniques for Modern Aquaculture. Proceedings of an Aquacultural Engineering Conference, 21–23 June 1993, Spokane, WA. ASAE, St. Hoseph, MI, pp. 315–325. Zahn, T., Braunbeck, T., 1995. Cytotoxic effects of sublethal concentrations of Malachite Green in isolated
Ž .