The influence of dietary nitrogen and phosphorus on Cd
accumulation in the woodlouse Porcellio scaber Latr
Andrei D. Pokarzhevskii
a,∗, Nico M. van Straalen
baInstitute of Ecology and Evolution of the Russian Academy of Sciences, Leninsky prospekt 33, 117071 Moscow, Russia bInstitute of Ecological Science, Vrije Universiteit, De Boelelaan 1087, 1081 HV Amsterdam, The Netherlands
Received 11 February 1999; received in revised form 20 July 2000; accepted 20 July 2000
Abstract
Bioaccumulation of potentially toxic metals by litter-feeding invertebrates is determined not only by the concentration of metal in the diet, but also by the flux of food through the body. Nitrogen and phosphorus are the main elements regulating food consumption and so are expected to affect the bioaccumulation of trace elements such as cadmium. To test this idea, we applied a three-factor orthogonal experimental design to estimate the effects of nitrogen, phosphorus and cadmium additions to the food on cadmium accumulation by the terrestrial isopod Porcellio scaber. Cd, N and P were added to milled poplar litter in concentrations of 0, 10 and 20mg g−1 for cadmium, 0, 0.875 and 1.75% for nitrogen and 0, 0.2 and 0.4% for
phosphorus. Observations were made for daily food consumption (estimated from faecal pellet production) and weekly Cd accumulation over a period of 4 weeks. Dietary Cd decreased consumption in the first 2 weeks of the experiment, but this effect disappeared later. Phosphorus had a significant positive effect on consumption in the second and the third week of the experiment. Accumulation of Cd was determined mainly by the Cd concentration in the food, but the effect was stimulated by P and diminished by N additions. Analysis of the data by regression using response surfaces confirmed that N and P had opposite influences on both Cd accumulation and food consumption. The data underline the importance of measuring consumption and food quality when conducting bioaccumulation and ecotoxicity experiments with soil invertebrates exposed through the diet. © 2001 Elsevier Science B.V. All rights reserved.
Keywords: Bioaccumulation; Cadmium; Heavy metals; Isopoda; Nutrition; Soil invertebrates
1. Introduction
Food is an important source of contaminants as well as nutrients for soil animals. An elevated con-centration of heavy metals in food commonly leads to an increased concentration in the body (Reichle et al., 1970; Martin and Coughtrey, 1982; Pokarzhevskii, 1985; Hopkin, 1989). However, metal accumulation depends not only on the concentration in food but
∗Corresponding author. Tel.:+7-095-1359816; fax:+7-095-9545534.
E-mail address: [email protected] (A.D. Pokarzhevskii).
also on the rate of food passage through the body. Metal accumulation should be considered as a balance between input and output processes (Pokarzhevskii, 1985; Hopkin, 1989; Fågerström, 1991).
Nitrogen and phosphorus are the main elements determining animal productivity and food require-ments for animals, including invertebrates (Dunger, 1958a,b; Prosser, 1973; House, 1974; Satchell, 1983; Gunnarsson, 1987). Within certain limits, low centrations of N and P in the food will stimulate con-sumption, as is well known from livestock farming practice. We have suggested earlier (Pokarzhevskii, 1985; Pokarzhevskii and Van Straalen, 1996) that N
and P regulate the passage of food through the animal body and that hence these elements could also affect heavy metal uptake and accumulation.
To test the idea of N and P regulating trace metal accumulation it is necessary to manipulate dietary N and P concentrations at a constant level of heavy metal. In most studies these factors are considered separately. This is due to the problem of how to deter-mine the influence of more than two interacting fac-tors simultaneously in a single experiment. A suitable method for such an experiment is a multi-factorial design. This approach has been used in many fields of science especially in the determination of optimal con-ditions for technological processes including indus-trial microbiology and agrochemistry (Nalimov and Chernova, 1965; Adler et al., 1973; Mead, 1988). We have used the method for ecotoxicological and radioe-cological studies some years ago (Terytze et al., 1989; Pokarzhevskii et al., 1993). A similar approach was applied by Loch et al. (1993) to assess the influence of different factors on Cr accumulation by ryegrass. Multifactorial response surface analysis assumes that the distances between the levels of a factor are equally spaced and can be represented by codes such as −1, 0 and+1. This simplifies the construction of orthogonal regression models of interactions between factors.
Soil animals such as earthworms, woodlice and diplopods are good subjects for testing the hypothesis concerning the influence of N and P on trace metal accumulation. These invertebrates consume soil and litter and, although the attractiveness of the food de-pends on microbial infestation, they do not pick out particular species growing on the food (bacteria, mi-crofungi, etc.), as do microarthropods. This allows N and P compounds to be added directly to soil or litter without taking into account reallocations within the food, as in the case with microarthropods. In a pilot study (Pokarzhevskii et al., 1994) we found that N and P influenced Cu accumulation in the earthworm
Octolasium lacteum (Oerley).
Woodlice (Crustacea: Isopoda: Oniscoidea) are convenient animals for such ecotoxicological experi-ments as conditions for their rearing and breeding and their physiological features are well known (Sutton, 1972; Warburg, 1987; Hopkin, 1989; Van Straalen and Donker, 1994). They survive well in captivity, readily consume litter including contaminated materials and
are one of the best investigated soil invertebrates in ecotoxicology (Drobne, 1997). Hopkin et al. (1993) suggested the use of the woodlouse Porcellio scaber (Latreille) as a monitor of bioavailability of metals in terrestrial ecosystems.
Based on the hypothesis formulated above, we ex-pected that manipulation of the N and P contents in the food would affect accumulation of trace metals. We conducted a multi-factorial experiment, exposing isopods to cadmium-contaminated food at various levels of N and P, to test this expectation.
2. Materials and methods
2.1. Animals
Isopods (Porcellio scaber) were taken from the lab-oratory culture of the Department of Animal Ecology of the Vrije Universiteit, Amsterdam, which originated from the forest Spanderswoud. The size of animals varied between 30 and 70 mg fresh weight. Specimens of both sexes were used in the experiment, excluding gravid females.
2.2. Experimental design
litter (up to 3%, see Van Wensem et al., 1992). The toxicity of calcium phosphate is very low, effects on larvae of Tribolium confusum Duval being observed at a concentration of nearly 3% P in food (Chaudhary and Lemonde, 1962). Effects of Cd contamination on food consumption were marked at concentrations above 20mg g−1in food (Donker, 1992). Hence only the highest Cd concentration chosen was close to the effective limit for isopods.
2.3. Food preparation
Senescent poplar leaves from an uncontaminated reference site (measured Cd content about 0.2mg g−1 dwt) were ground in a coffee mill and sieved through a 0.5 mm mesh. The powder thus obtained was mixed with an equal volume of 1% glucose solution to im-mobilize added N by stimulation of microfloral devel-opment. After this procedure the food was dried for 2 days at 50◦C in a desiccator. After drying, part of the
food was used for acclimating the animals to the exper-imental food and the rest (240 g on a dry mass basis) was divided into three portions. The first portion was used as it was, without further additions. A solution of Cd(NO3)2·4H2O was added to the other two portions to obtain the second and third levels of cadmium. All portions were then divided into ten small portions of 8 g each. Phosphorus as a 0.244% Ca(H2PO4)2·H2O solution and nitrogen as a 0.75% NH4NO3 solution were added to every sample corresponding to the experimental design. To obtain the second and third levels, 26 or 52 ml of the corresponding solution was applied to an 8 g portion of the food. Calcium car-bonate as a 0.11% suspension was added at 52 ml per portion to the portions without and 26 ml per portion to the portions with mean addition of Ca phosphate, to equalize the Ca concentration of the food and to eliminate a possible influence of Ca added with the phosphate. Nitrogen added with cadmium nitrate was not compensated for because it did not increase the N content of the food significantly; it contributed only 0.06% to total N at the second level of N application and 0.03% to total N at the third level of N applica-tion. After adding all compounds the food was dried at 50◦C and stored at room temperature. Directly
be-fore feeding a part of the dried food was mixed with distilled water at a ratio of 1:3 to obtain a dispensable paste.
2.4. Experimental procedures
Every animal was kept individually in a small plas-tic pot (5 cm in diameter and 4 cm in height) covered by a perforated lid. The bottoms of the pots were filled with a plaster of Paris layer up to 1/3 of the depth of the pot. Animals were put into the pots and every an-imal was provided with clean food (about 0.2 g fresh mass) for acclimation. A piece of pottery or plastic sponge was put into every pot as a humid shelter for the woodlouse. Pots were placed on trays in a climate chamber (temperature 20◦C, relative humidity 75%,
light to dark periods as 12:12, light period beginning at 8.00 h a.m.). After 10 days all experimental animals were weighed, the control food was removed from the pots and the experimental food was distributed (0.1 g per pot) in accordance with the experimental plan. Ten animals were selected at that moment as the reference group to estimate the initial Cd concentration of the animals. Every experimental group initially included 20 animals and the total number of pots was 540 (=3×3×3×20).
Every pot was examined daily to check the animals, and to remove and count their faecal pellets. Faeces counting was used as an estimation of food consump-tion for each individual because for adult isopods a linear relationship holds between consumption and number of pellets (cf. Khalil et al., 1995). Faeces were removed daily to prevent coprophagy which can in-fluence Cd accumulation. Food and water were added during inspections when necessary. The duration of the experiment was 4 weeks. Every week from every experimental group three to five woodlice (depending on death or escapes) were collected. Dead animals were removed during the inspections and were not taken into account. Animals were selected by random number allocation. Before chemical analysis the ani-mals were kept without food for 12 h and then frozen.
2.5. Chemical analysis procedures
185◦C till dryness. Before Cd determination 1 ml of
0.1 N HNO3was added to every tube to dissolve the pellet. Samples with digestion mixture but without an-imals (one per 10 animal samples) and certified ref-erence material (bovine liver, BSA, ref. Material no. 185) (one per 10 animal samples) were used to check the quality of the analytical procedures. The analytical results obtained for the reference material were usually within 10% of the certified value but in a few cases de-viated up to 17%. No corrections were made for this. Food was digested in a microwave oven for 50 min in teflon tubes. Every tube contained a well ground dry sample of food (near 100 mg dwt), 4 ml concen-trated HNO3, 1 ml HCl and 1 ml demineralized water. After digestion the sample was made up to 25 ml with demineralized water.
Cadmium determinations were done by flame atomic absorption spectrophotometry (Perkin–Elmer 1100) for both isopods and food.
2.6. Statistical analysis
The experimental results were analyzed using the STATGRAPHICS 5.0, STATGRAPHICS PLUS for WINDOWS 2.1 and Lotus 1-2-3 1.0. software pack-ages. The first two packages have special options for analysis of specific experimental designs. We analyzed the data as a three factor orthogonal ex-perimental design (N, P and Cd in food as factors) and the response surface of the second order both for Cd accumulation in isopods and food consumption (faecal pellet production) was described by:
y=b0+b1x1+b2x2+b3x3+b12x1x2+b13x1x3
+b23x2x3+b11x12+b22x22+b33x32 (1) where y is Cd concentration in mg g−1 dwt or daily faecal pellet production, x1is nitrogen concentration,
x2 is phosphorus concentration and x3 is cadmium concentration (all in coded form), and the b values are coefficients estimated from the data by regression. The model allows for linear effects of N, P, and Cd (with coefficients b1, b2, and b3), two-way interac-tions between the factors (with coefficients b12, b13, and b23) and non-linear, quadratic effects of the sin-gle factors (with coefficients b11, b22, and b33). The model was considered to describe the data satisfacto-rily if the F-test for lack-of-fit hadP >0.05.
3. Results
3.1. Weight gain
Weight changes during the experiment were not significantly different between the groups. Body growth was slightly (not significantly) higher during the first week for animals fed litter without Cd than for individuals fed contaminated food, and then in-creased during the second week of the experiment in almost all groups. In other periods of the experi-ment the mean weight of the different groups varied between 95 and 105% of the initial weight.
3.2. Faecal pellet production
Faecal pellet production by individual animals fluc-tuated greatly from day to day and from week to week (Table 1). Overall, there was a trend of increasing pel-let production from the first week to the fourth week. In the first 2 weeks of the experiment, Cd had a sig-nificantly negative effect on faecal pellet production (P <0.001 in the first week,P =0.007 in the second week). In the second and the third weeks, phospho-rus had a significantly positive effect on consumption (P = 0.006 in the second week, P = 0.029 in the third week). In addition, the non-linear component of nitrogen was significant in the second (P = 0.037) and the fourth week (P <0.001). At the end of the experiment daily pellet production was quite similar in all groups. It is also important to note that uncon-taminated food after glucose addition was covered by a tuft of fungal mycelium in the beginning of the experiment while contaminated food had no visible fungal mycelium in the food.
Table 1
Average daily faecal pellet production and cadmium concentrations for isopods exposed to factorial combinations of three nitrogen, three phosphorus and three cadmium levels in the fooda
Treatments Week 1 Week 2 Week 3 Week 4
N P Cd Cons.(day−1) Cd (
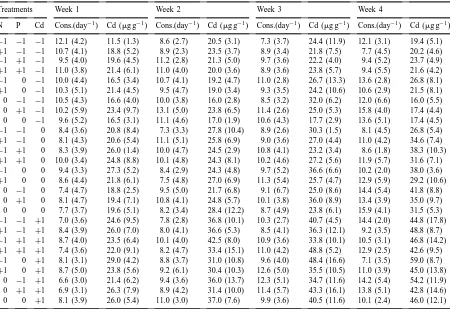
mg g−1) Cons.(day−1) Cd (mg g−1) Cons.(day−1) Cd (mg g−1) Cons.(day−1) Cd (mg g−1) −1 −1 −1 12.1 (4.2) 11.5 (1.3) 8.6 (2.7) 20.5 (3.1) 7.3 (3.7) 24.4 (11.9) 12.1 (3.1) 19.4 (5.1)
+1 −1 −1 10.7 (4.1) 18.8 (5.2) 8.9 (2.3) 23.5 (3.7) 8.9 (3.4) 21.8 (7.5) 7.7 (4.5) 20.2 (4.6)
−1 +1 −1 9.5 (4.0) 19.6 (4.5) 11.2 (2.8) 21.3 (5.0) 9.7 (3.6) 22.2 (4.0) 9.4 (5.2) 23.7 (4.9)
+1 +1 −1 11.0 (3.8) 21.4 (6.1) 11.0 (4.0) 20.0 (3.6) 8.9 (3.6) 23.8 (5.7) 9.4 (5.5) 21.6 (4.2)
−1 0 −1 10.0 (4.4) 16.5 (3.4) 10.7 (4.1) 19.2 (4.7) 11.0 (2.8) 26.7 (13.3) 13.6 (2.8) 26.8 (8.1)
+1 0 −1 10.3 (5.1) 21.4 (4.5) 9.5 (4.7) 19.0 (3.4) 9.3 (3.5) 24.2 (10.6) 10.6 (2.9) 21.5 (8.1) 0 −1 −1 10.5 (4.3) 16.6 (4.0) 10.0 (3.8) 16.0 (2.8) 8.5 (3.2) 32.0 (6.2) 12.0 (6.6) 16.0 (5.5) 0 +1 −1 10.2 (5.9) 23.4 (9.7) 13.1 (5.0) 23.8 (6.5) 11.4 (2.6) 25.0 (5.3) 15.8 (4.0) 17.4 (4.4) 0 0 −1 9.6 (5.2) 16.5 (3.1) 11.1 (4.6) 17.0 (1.9) 10.6 (4.3) 17.7 (2.9) 13.6 (5.1) 17.4 (4.5)
−1 −1 0 8.4 (3.6) 20.8 (8.4) 7.3 (3.3) 27.8 (10.4) 8.9 (2.6) 30.3 (1.5) 8.1 (4.5) 26.8 (5.4)
+1 −1 0 8.1 (4.3) 20.6 (5.4) 11.1 (5.1) 25.8 (6.9) 9.0 (3.6) 27.0 (4.4) 11.0 (4.2) 34.6 (7.4)
−1 +1 0 8.3 (3.9) 26.0 (1.4) 10.0 (4.7) 24.5 (2.9) 10.8 (4.1) 23.2 (3.4) 8.6 (1.8) 38.3 (10.3)
+1 +1 0 10.0 (3.4) 24.8 (8.8) 10.1 (4.8) 24.3 (8.1) 10.2 (4.6) 27.2 (5.6) 11.9 (5.7) 31.6 (7.1)
−1 0 0 9.4 (3.3) 27.3 (5.2) 8.4 (2.9) 24.3 (4.8) 9.7 (5.2) 36.6 (6.6) 10.2 (2.0) 38.0 (3.6)
+1 0 0 8.6 (4.4) 21.8 (6.1) 7.5 (4.8) 27.0 (6.9) 11.3 (5.4) 25.7 (4.7) 12.9 (5.9) 29.2 (10.6) 0 −1 0 7.4 (4.7) 18.8 (2.5) 9.5 (5.0) 21.7 (6.8) 9.1 (6.7) 25.0 (8.6) 14.4 (5.4) 41.8 (8.8) 0 +1 0 8.1 (4.7) 19.4 (7.1) 10.8 (4.1) 24.8 (5.7) 10.1 (3.8) 36.0 (8.9) 13.4 (3.9) 35.0 (9.7) 0 0 0 7.7 (3.7) 19.6 (5.1) 8.2 (3.4) 28.4 (12.2) 8.7 (4.9) 23.8 (6.1) 15.9 (4.1) 31.5 (5.3)
−1 −1 +1 7.0 (3.6) 24.6 (9.5) 7.8 (2.8) 36.8 (10.1) 10.3 (2.7) 40.7 (4.5) 14.4 (2.0) 44.8 (17.8)
+1 −1 +1 8.4 (3.9) 26.0 (7.0) 8.0 (4.1) 36.6 (5.3) 8.5 (4.1) 36.3 (12.1) 9.2 (3.5) 48.8 (8.7)
−1 +1 +1 8.7 (4.0) 23.5 (6.4) 10.1 (4.0) 42.5 (8.0) 10.9 (3.6) 33.8 (10.1) 10.5 (3.1) 46.8 (14.2)
+1 +1 +1 7.4 (3.6) 22.0 (9.1) 8.2 (4.7) 33.4 (15.1) 11.0 (4.2) 48.8 (5.2) 12.9 (2.5) 42.6 (9.5)
−1 0 +1 8.1 (3.1) 29.0 (4.2) 8.8 (3.7) 31.0 (10.8) 9.6 (4.0) 48.4 (16.6) 7.1 (3.5) 59.0 (8.7)
+1 0 +1 8.7 (5.0) 23.8 (5.6) 9.2 (6.1) 30.4 (10.3) 12.6 (5.0) 35.5 (10.5) 11.0 (3.9) 45.0 (13.8) 0 −1 +1 6.6 (3.0) 21.4 (6.2) 9.4 (3.6) 36.0 (13.7) 12.3 (5.1) 34.7 (11.6) 14.2 (5.4) 54.2 (11.9) 0 +1 +1 6.9 (3.1) 26.3 (7.9) 8.9 (4.2) 31.4 (10.0) 11.4 (5.7) 43.3 (16.1) 13.8 (5.1) 42.8 (14.6) 0 0 +1 8.1 (3.9) 26.0 (5.4) 11.0 (3.0) 37.0 (7.6) 9.9 (3.6) 40.5 (11.6) 10.1 (2.4) 46.0 (12.1) aMeans for faecal pellet production (Cons.) were calculated over a variable number of pots (each with one individual): 18–20 pots in the first week, decreasing to 3–5 in the last week. Means for Cd concentrations were calculated over 3–4 pots (animals). Each mean is supplemented with a standard deviation (between brackets). The treatments are: for N:−1: no addition, 0: 0.875%,+1: 1.75%; for P:
−1: no addition, 0: 0.2%,+1: 0.4%; for Cd:−1: no addition, 0: 10mg g−1,+1: 20mg g−1
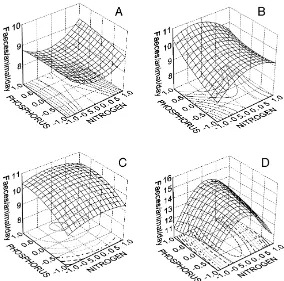
especially notable in the beginning of the experiment and disappeared later. Nitrogen and phosphorus began to play a main role in food consumption of isopods during the third and fourth week of the experiment. The effect of nitrogen included a negative nonlinear component, indicating an optimum curve rather than an overall increase or decrease; the effect of phos-phorus was generally positive (Table 2). Because the full model cannot be plotted in a graph, we used three-dimensional versions to illustrate the effects of N and P on the pellet production of isopods only for the intermediate Cd level (code 0), see Fig. 1. In accor-dance with the statistical tests, the response surfaces illustrate the overall positive effect of phosphorus and the non-linear (quadratic) effect of nitrogen.
3.3. Cadmium accumulation in isopods
Table 2
Estimated coefficients for the three dimensional response surfaces fitted to faecal pellet production or cadmium concentration in isopods as a function of cadmium, nitrogen and phosphorus concentrations in fooda
Week (d.f.) b0 b1 b2 b3 b12 b13 b23 b11 b22 b33 Lack-of-fit (P-value)
R2 (%)
R2 (adj. to d.f.) Daily faecal pellet production of isopods
1 (501) 7.98 0.01 0.11 −1.32 −0.20 0.03 0.33 0.78 −0.08 0.64 0.88 7.8 6.1 2 (377) 9.60 0.03 0.72 −0.71 −0.52 0.02 −0.47 −0.94 0.33 0.53 0.64 6.8 4.5 3 (271) 10.41 0.07 0.66 0.59 −0.11 0.15 −0.18 −0.42 −0.50 0.29 0.75 3.9 0.6 4 (127) 14.21 0.17 0.19 0.00 0.98 0.80 −0.36 −3.34 −0.32 −0.18 0.82 15.71 9.3 Cd concentrations in isopods
1 (125) 21.71 0.10 1.55 3.11 −0.80 −1.69 −1.39 1.32 −0.89 −0.42 0.76 25.0 19.1 2 (133) 23.64 −0.53 0.19 7.53 −1.06 −1.00 −0.51 1.33 1.46 1.88 0.72 42.7 38.5 3 (109) 28.64 −0.08 0.57 8.11 2.65 −0.15 1.58 0.01 −0.73 4.23 0.19 40.0 34.6 4 (125) 34.28 −1.50 −0.26 13.60 −2.35 −0.47 −1.86 0.43 −1.00 0.25 0.31 60.8 57.8
aSee Eq. (1) for the model. The interpretation of the coefficients is as follows:b
0 =effect independent of any factor,b1=linear effect of N,b2 =linear effect of P, b3 =linear effect of Cd, b12=effect due to interaction between N and P, b13= effect due to interaction between N and Cd,b23=effect due to interaction between P and Cd,b11=quadratic effect of N,b22=quadratic effect of P,
b33=quadratic effect of Cd
than the initial value. There were small, but signifi-cant, interactions between nitrogen and cadmium in the first week (P =0.039) and between phosphorus and cadmium in the third week (P =0.045). These interactions illustrate that dietary nitrogen diminished the positive trend for Cd, while phosphorus reinforced it. As in the case of faecal pellet production, the data show that phosphorus has a stimulatory effect and ni-trogen a mostly negative effect on Cd accumulation.
The coefficients of the factorial response regression are presented in Table 2. The regressions explained 24–61% of the variability of Cd accumulation in isopods and there was no significant lack of fit. The signs of the coefficients demonstrate the strongly positive effect of dietary Cd (b3 and b33), and the generally negative effect of nitrogen (b1 and b13). There were no significant residual differences be-tween experimental and model data and standard deviations commonly overlapped differences between
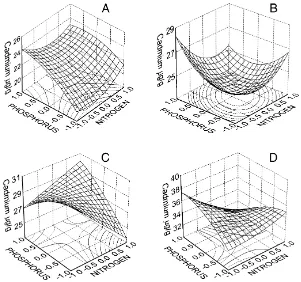
Fig. 2. Response surfaces for the effects of nitrogen and phosphorus on Cd concentrations in isopods during the experiment, for the intermediate Cd level (code 0) in week 1 (A), week 2 (B), week 3 (C) and week 4 (D). Nitrogen and phosporus are given as codes and increase from−1 to+1.
experimental and model data. This is confirmed by the non-significant P-values for the F-test for lack-of fit (Table 2). Because the full model cannot be plotted in a graph, we used three-dimensional versions for the intermediate level of Cd, to illustrate the effects of N and P on Cd in isopods (Fig. 2). The regression describes a slow increase in Cd accumulation after the first 2 weeks of the experiment and a significant increase in accumulation over the last 3 weeks.
3.4. Correlations among response variables
Table 3
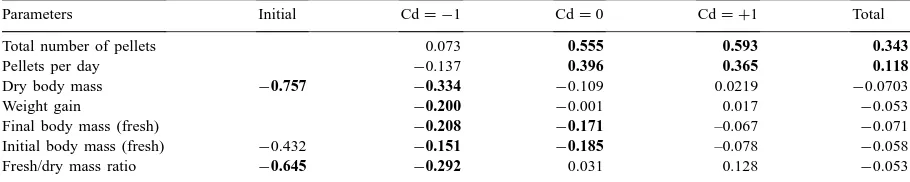
Pearson correlation coefficients for relations between internal Cd concentration and various parameters of isopods. The bold p-values indicate correlations that differ significantly from zero
Parameters Initial Cd= −1 Cd=0 Cd= +1 Total
Total number of pellets 0.073 0.555 0.593 0.343
Pellets per day −0.137 0.396 0.365 0.118
Dry body mass −0.757 −0.334 −0.109 0.0219 −0.0703
Weight gain −0.200 −0.001 0.017 −0.053
Final body mass (fresh) −0.208 −0.171 –0.067 −0.071
Initial body mass (fresh) −0.432 −0.151 −0.185 –0.078 −0.058
Fresh/dry mass ratio −0.645 −0.292 0.031 0.128 −0.053
separately (Table 3). In the groups fed contaminated litter (Cd =0, Cd = +1), animals with a high con-sumption also had a high Cd concentration. In the groups fed clean food (Cd = −1) there was no such correlation (Table 3); in these animals a weak, but sig-nificant negative correlation was present between in-ternal Cd and dry body mass, weight gain and fresh/dry mass ratio.
4. Discussion
Our experiment has demonstrated that nitrogen and phosphorous may play a role as dietary factors that affect contaminant accumulation in animals. The two nutrients appeared to have opposite effects on Cd accu-mulation. The three-dimensional response regressions showed that phosphorus addition to food stimulates Cd accumulation (except at high N in food), while ni-trogen additions decreased it. There are, however, no simple linear impacts of the nutrient additions in diet. The coefficients of the second order (b11and b22) had signs opposite to the first order coefficients (b1and b2) and this reflects the complicated nature of the effects. The effects also varied with time: interactions between nitrogen and phosphorus increased with time of expo-sure although in the last week the interaction decreased accumulation. The effects of nitrogen and phosphorus on Cd accumulation were, however, relatively small in comparison with dietary Cd itself, although this effect was small after the first week and began to increase af-ter the second week. The higher the cadmium content in food the smaller were the effects of dietary nitro-gen and phosphorus on Cd concentration in isopods. This may be explained from the physiology of Cd
in isopods and the impact of dietary quality on food consumption.
As we supposed when designing our experiment Cd accumulation in isopods is connected directly with food consumption (faecal pellet production). Cd ac-cumulation is however more strongly correlated with the accumulated food consumption over 4 weeks than with daily food consumption. The animal body acts as an integrator and so accumulation is more stable than intake rate. This is well known from radioecological and ecotoxicological practice (Pokarzhevskii, 1990; Fågerström, 1991; Pokarzhevskii and Van Straalen, 1996). In addition, Cd is hardly eliminated from iso-pod bodies (Hopkin, 1989; Crommentuijn et al., 1994; Van Straalen and Donker, 1994) and as a consequence Cd accumulates in woodlice in accordance with the total volume of food consumed (total number of pel-lets) more than with the flow of food through the gut (daily faecal pellet production).
proteins have been found to bind cadmium in isopod bodies (Donker et al., 1990; Dallinger, 1993), and the synthesis of these proteins may be alleviated by a high availability of nitrogen in the diet. Phosphorus may act as an internal immobilizing factor by precipitating metals in intracellular deposits (Prosi et al., 1983).
The effect of dietary Cd on Cd concentration in isopods increased with exposure time while the effects of nitrogen and phosphorus were relatively stable dur-ing the experiment. The significance of dietary nitro-gen and phosphorus on Cd concentration in isopods was nevertheless noticeable during the experiment, except during the second week. The direct effect of nitrogen addition increased (coefficient b1) while the effect of phosphorus decreased (coefficient b2) dur-ing the experiment (Table 2). This was apparently connected with changes of dietary nutrient impact on food consumption of isopods. Dietary Cd content had a significant negative influence on food consumption during the first 2 weeks of the experiment while nitro-gen and phosphorus effects (coefficients b11 and b2) appeared only after the second week (Table 2). There are opposing tendencies in the phosphorus impacts on food consumption and Cd accumulation in isopods whereas the nitrogen impacts partially coincided. This is reflected in the curvature of the response surfaces for faecal pellet production and Cd concentration of isopods which have different cross-sections.
The decreased Cd concentration in isopods in the first week of the experiment (in comparison to the concentration before acclimation) is possibly due to an interaction of Ca with Cd uptake. Extra calcium carbonate was added to the low calcium phosphate treatment to equalize calcium levels over all phosphate additions. As a consequence, the Ca concentration of the food during exposure to Cd was considerably higher than that during the acclimation period. The drop in Cd uptake observed in the first week of the experiment suggests that adding Ca to food lowers the availability of Cd. The influence of calcium on accumulation of heavy metals in invertebrates is well known (Hopkin, 1989; Beeby, 1990).
Cadmium in the food at 20mg g−1decreased con-sumption and Cd accumulation in isopods during the first 2 weeks although Donker and Bogert (1991) did not observed an influence on food consumption of cadmium concentration up to 20mg g−1. The reason may be due to differences in the nutritional value of
food. We used pure poplar litter while in the previous experiments the poplar leaf diet was amended with 10% dog food; this material makes the feed more attractive to isopods and effects of cadmium on food may be less evident under these conditions. It must be added that in our experiment the effect of Cd on consumption was limited to the first 2 weeks. Later in the experiment consumption converged to a value similar for all groups and phosphorus and nitrogen began to influence consumption.
The growth of the isopods in our experiment was slow, which is due to the use of adult animals. There were no effects of cadmium nor of N and P on the growth of Porcellio. This accords with the highest Cd concentration (20mg g−1) being well below the no-effect concentration for Cd effects on growth of isopods (65–95mg g−1, Van Wensem et al., 1992; Crommentuijn et al., 1995). Our results are also in agreement with Lavy (1996), who found no effect of additions of peptone (increasing the N-content of poplar leaf litter from 2.4–3.1%) on the growth of
Porcellio.
The regression models (Table 2) described the ex-perimental data satisfactory (F-tests for lack of fit were not significant), although only 4–16% of the variability of faecal pellet production and 24–61% of the variability in Cd concentration in isopods was ac-tually explained. This confirms the suggestion made above, that the impact of dietary factors on Cd con-centration in isopods is not strongly related to their impact on food consumption, but also to bioavailabil-ity of Cd in the gut and physiological interactions.
Acknowledgements
This research was granted by a short-term EERO grant, by an NWO grant (No. 0047-002-009) and by and RFBR grant (No. 99-04-48577). We thank two anonymous referees for valuable corrections and comments.
References
Adler, Ju.P., Markova, E.V., Granovskii, Ju.V., 1973. Planning of an experiment in search of optimal conditions. Nauka, Moscow. Beeby, A., 1990. Toxic metal uptake and essential metal regulation in terrestrial invertebrates: a review. In: Newman, M.C., McIntosh, A.W. (Eds.), Metal Ecotoxicology: Concepts and Applications. Lewis Publishers, Orlando, pp. 65–89. Chaudhary, K.D., Lemonde, A., 1962. Phosphorus in the nutrition
of Tribolium confusum Duval. Canad. J. Zool. 40, 375–380. Crommentuijn, T., Doodeman, C.J.A.M., Doornekamp, A., Van
der Pol, J.J.C., Bedaux, J.J.M., Van Gestel, C.A.M., 1994. Lethal body concentrations and accumulation patterns determine time-dependent toxicity of cadmium in soil arthropods. Environ. Toxicol. Chem. 13, 1781–1789.
Crommentuijn, T., Doodeman, C.J.A.M., Van der Pol, J.J.C., Doornekamp, A., Rademaker, M.C.J., Van Gestel, C.A.M., 1995. Sublethal sensitivity index as an ecotoxicity parameter measuring energy allocation under toxicant stress: application to cadmium in soil arthropods. Ecotoxicol. Environ. Safety 31, 192–200.
Dallinger, R., 1993. Strategies of metal detoxification in terrestrial invertebrates. In: Dallinger, R., Rainbow, P.S. (Eds.), Ecotoxicology of Metals in Invertebrates. Lewis Publishers, Boca Raton, pp. 245–289.
Donker, M.H., 1992. Energy reserves and distribution of metals in populations of the isopod Porcellio scaber from metal-contaminated sites. Funct. Ecol. 6, 445–454.
Donker, M., Bogert, C.G., 1991. Adaptation to cadmium in three populations of the isopod Porcellio scaber. Comp. Biochem. Physiol. 100C, 143–146.
Donker, M.H., Koevoets, P., Verkleij, J.A.C., Van Straalen, N.M., 1990. Metal binding compounds in hepatopancreas and haemolymph of Porcellio scaber (Isopoda) from contaminated and reference areas. Comp. Biochem. Physiol. 97C, 119–126. Drobne, O., 1997. Terrestrial isopods-a good choice for toxicity testing of pollutants in the terrestrial environment. Environ. Toxicol. Chem. 16, 1159–1164.
Dunger, W., 1958a. Uber die Zersetzung der Laubstreu durch Boden–Macrofauna in Auchwald. Zool. Jb. 86, 138–180. Dunger, W., 1958b. Uber die Veränderung des Fallaubes im Darm
von Bodentieren. Ztschr. Pflanzenernahr. Bodenkunde 82/127, 174–193.
Fågerström, T., 1991. Biomagnification in food chains and related concepts. Oikos 62, 257–260.
Groten, J.P., Sinkeldam, E.J., Muys, T., Luten, J.B., Van Bladeren, P.J., 1991. Interaction of dietary Ca, P, Mg, Mn, Cu, Fe, Zn and Se with the accumulation and oral toxicity of cadmium in rats. Food Chem. Toxicol. 29, 249–258.
Gunnarsson, T., 1987. Soil arthropods and their food: choice, use and consequences. Ph.D. Thesis, University of Lund. Hazardous Chemical Compounds, 1988. Compounds of elements
of I–IV groups. Khimia, Moscow.
Hopkin, S.P., 1989. Ecophysiology of Metals in Terrestrial Invertebrates. Elsevier, Amsterdam.
Hopkin, S.P., Jones, D.T., Dietrich D., 1993. The isopod Porcellio
scaber as a monitor of the bioavailability of metals in terrestrial
ecosystems: towards a global “woodloose watch” scheme. Sci. Total Environ. (Suppl. 1993), pp. 357–365.
House, H.L. (Ed.), 1974. The Physiology of Insecta., Vol. 5. Academic Press, NY.
Khalil, M.A., Donker, M.H., Van Straalen, N.M., 1995. Long-term and short-term changes in the energy budget of Porcellio scaber Latreille (Crustacea) exposed to cadmium polluted food. Eur. J. Soil Biol. 31, 163–172.
Lavy, D., 1996. Nutritional ecology of soil arthropods. Ph.D. Thesis, Vrije Universiteit, Amsterdam.
Loch, J., Gyori, Z., Vago, I., 1993. Examining of the Cr uptake of Italian ryegrass from inorganic compounds and sewage-sludge in pot experiments. Sci. Total Environ. (Suppl. 1993), 347–355. Martin, M.H., Coughtrey, P.J., 1982. Biological Monitoring of Heavy Metal Pollution: Land and Air. Applied Science Publishers, Barking.
McKenna, I.M., Chaney, R.L., Tao, S.-H., Leach Jr., R.M., Williams, F.M., 1992. Interactions of plant zinc and plant species on the bioavailability of plant cadmium to Japanese quail fed lettuce and spinach. Environ. Res. 57, 73–87. Mead, R., 1988. The Design of Experiments. Cambridge University
Press, Cambridge.
Nalimov, V.V., Chernova, N.A., 1965. Statistical Methods of Planning of Extremal Experiments. Nauka, Moscow. Pokarzhevskii, A.D., 1985. Geochemical Ecology of Terrestrial
Animals. Nauka, Moscow.
Pokarzhevskii, A.D., 1990. Bioindicational and ecotoxicological aspects of investigation into the trophic structure of animal communities. In: Krivolutsky, D.A. (Ed.), Bioindications of Chemical and Radioactive Pollution, CRC-Mir, Boca Raton-Moscow, pp. 78–106.
Pokarzhevskii, A.D., Martjushov, V.Z., Tarasov, O.V., Antonova, T.A., 1993. Quantitative characters of radionuclide mixture impacts on soil biological activity. In: Sokolov, V.E., Krivolutzkii, D.A. (Eds.), Ecological After-effects of the Radio-active Contamination at South Ural, Nauka. Moscow, pp. 96–103.
Pokarzhevskii, A., Terytze, K., Gordienko, S., 1994. Experiment design method using in animal ecotoxicology: a case study of N and P influence on Cu accumulation in earthworms. Acta Biol. Debr. Oecol. Hung. 5, 305–311.
Prosi, F., Storch, V., Janssen, H.H., 1983. Small cells in the midgut glands of terrestrial isopods: sites of heavy metal accumulation. Zoomorphol. 102, 53–64.
Prosser, C.L. (Ed.), 1973. Comparative Animal Physiology. Saunders, Philadelphia.
Reichle, D.E., Dunaway, P.B., Nelson, D.J., 1970. Turnover and concentration of radionuclides in food chains. Nucl. Safety 11, 43–55.
Satchell, J.E. (Ed.), 1983. Earthworm Ecology. Chapman & Hall, London.
Sutton, S.L., 1972. Woodlice. Pergamon Press, Oxford. Terytze, K., Mentscher, E., Pokarzhevskii, A., Gusev, A.,
Zhulidov, A., Savtschenko, L., 1989. Methodischer Ansatz für
Einschatzung der Kombinationswirkungen von Substanzen in der Umwelt. Nachrichten Mensch-Umwelt 1, 44–61. Van Straalen, N.M., Donker, M.H., 1994. Heavy metal adaptation
in terrestrial arthropods physiological and genetic aspects. Proc. Section Exp. Appl. Entomol. Netherlands Entomol. Soc. 5, 3–17.
Van Wensem, J., Krijgsman, M., Postma, J.F., Van Westrienen, R.W., Wezenbeek, J.M., 1992. A comparison of test systems for assessing effects of metals on isopod ecological functions. Ecotoxicol. Environ. Safety 24, 203–216.