I
03529,1*7+(6/803/$11,1*7+528*+*(263$7,$/'(&,6,21
6833257
6<67(0
Sulochana Shekhar
Central University of Karnataka, Gulbarga, India ([email protected])
7HFKQLFDOCommission II
KEY WORDS: Geospatial Decision Support System, Slum, Gulbarga, GIS, Community
ABSTRACT:
In India, a number of schemes and programmes have been launched from time to time in order to promote integrated city development and to enable the slum dwellers to gain access to the basic services. Despite the use of geospatial technologies in planning, the local, state and central governments have only been partially successful in dealing with these problems. The study on existing policies and programmes also proved that when the government is the sole provider or mediator, GIS can become a tool of coercion rather than participatory decision-making. It has also been observed that local level administrators who have adopted Geospatial technology for local planning continue to base decision-making on existing political processes. In this juncture, geospatial decision support system (GSDSS) can provide a framework for integrating database management systems with analytical models, graphical display, tabular reporting capabilities and the expert knowledge of decision makers. This assists decision-makers to generate and evaluate alternative solutions to spatial problems. During this process, decision-makers undertake a process of decision research - producing a large number of possible decision alternatives and provide opportunities to involve the community in decision making. The objective is to help decision makers and planners to find solutions through a quantitative spatial evaluation and verification process. The study investigates the options for slum development in a formal framework of RAY (Rajiv Awas Yojana), an ambitious program of Indian Government for slum development. The software modules for realizing the GSDSS were developed using the ArcGIS and Community -VIZ software for Gulbarga city.
1. INTRODUCTION
1.1 Slums
UN-HABITAT presented a “worst-case” slum scenario, in which growth rates were projected to continue unrelieved with the number of residents rising from nearly one billion in 2005 to 1.4 billion by 2020. Though the Millennium “slum target” has been achieved by improving the lives of 227 million people, that target of 100 million was only 10% of the global slum population. China and India alone had achieved the majority of the global slum target by improving the lives of 125 million slum dwellers. Even then, “Eradicating poverty was and is the greatest global challenge facing the world and is a core requirement for sustainable development, especially for
developing countries” (UN, Poverty, Social Policy and development division, 2008). India has undertaken this issue of utmost importance and hence launched a number of schemes and programmes from time to time in order to promote integrated city development and also to enable the slum dwellers to gain access to the basic services such as potable water, sanitation, health and educational facilities. India also planned to achieve Slum free India by 2020 through Rajiv Awas Yojana (RAY, 2011).
1.2 Slum development policies and RAY
After Independence, the Government of India initiated the slum development through “Slum Areas Act (Improvement and
Clearance), 1956”. Since then there have been many programs which include Environmental Improvement of Urban Slums, 1972; National Slum development program, 1996; Valmiki Ambedkar Awas Yojana, 2001; Nirmal Bharat Abhiyan (1999 as TSC); Integrated Housing and Slum Development Programme, 2005; Basic Services for the Urban Poor, 2005 under Jawaharlal Nehru National Urban Renewal Mission
(2005) and recently Rajiv Awas Yojana, 2011 (M/o HUPA, 2012). The objective of these programmes was the up-gradation of urban slums by providing physical amenities like water supply, storm water drains, community baths, widening and paving of existing lanes, sewers, community latrines, street lights etc. Most of these programs were only for a few select cities and they didn’t truly reach the urban poor and nor were they fully implemented.
RAY was first introduced in 2009 and formally launched in 2011. It will be implemented on a mission mode up to 2022, with the main objective of “Slum free India”. It has been refined based on the lessons learned from the short comings of previous programmes. It is necessary to have a slum free city plan of action for every municipality and to use geospatial technology in the preparation of spatial data base of slums. Community participation is an important component at every level i.e., from planning, preparing maps to implementation of RAY.
1.3 Need for GSDSS
Merely using geo spatial technology doesn’t mean that RAY has better scope for implementation. There are confusions and controversial opinions regarding the use of GIS in RAY. Local level administrators who had adopted GIS technology for local planning continued to base decision-making on existing political processes (Walsham and Sahay, 1999); GIS can become a tool of coercion rather than participatory decision-making; The guidelines recommend mapping slums through remote sensing which would mean that a government GIS specialist or a private company could have the authority to determine slum boundary locations without ever having to enter a slum or interact with its residents; How will the GIS database be shared with NGOs and CBOs to inform their decisions; How can the urban poor ensure that the information that technical professionals have collected about their settlements is accurate if they have neither access to the technical tools nor knowledge
of how to use them? (Livengood. A and Kunte. K, 2012). In order to answer these questions and build confidence among the slum dwellers, it is essential to go for GSDSS. Through GSDSS, RAY can be implemented successfully with community participation at every stage of RAY.
Spatial decision making is often complex and requires information produced from many sources and interpreted by a variety of decision makers in relation to different goals and objectives (R.Sugumaran and Degroote, 2010). Many spatial problems are semi-structured, where the decision makers fail to define the problem precisely and cannot articulate their objectives (Gorry and Marton, 1971; Alter, 1980; Hopkins, 1984 as stated in Densham, 1991). Slum development is one such semi-structured spatial problem, where the objectives of the decision-maker and the problem itself cannot be fully or precisely defined. Often solutions to semi structured problems are obtained by generating a set of alternatives and selecting from among those that appear to be viable through a spatial decision support system.
The (Geo)spatial decision support system provides a framework for integrating database management systems with analytical models, graphical display, tabular reporting capabilities and the expert knowledge of decision makers that then assists decision-makers in generating and evaluating alternative solutions to semi structured spatial problems (Densham, 1991). In this paper, a geospatial decision support system has been designed and tested at slum level in Gulbarga city, India for implementation of a slum development program.
2. MATERIALS AND METHODS RELATED
LITERATURE
2.1 Related literature
The concept of spatial decision support systems had emerged by
the end of 1980’s and literature about spatial decision support systems (SDSS) is abundant (Nafaa Jabeur et al., 2011). Since most of these spatial decisions are taken based on the activities that are happening on the geographical space, in this paper the
term “Spatial” is replaced by “Geospatial”. Otherwise, these two terms are synonymous.
Malczewski (Malczewski, 1999) defined a SDSS as “an
interactive computer based system designed to support a user or group of users in achieving a higher effectiveness of decision making while solving a semi-structured spatial decision
problem”. Spatial decision problems are often ill- or semi-structured. They are multidimensional, characterised by uncertainty, have decision objectives and factors that cannot be fully and formally specified and do not have a unique evident solution (Densham, 1991; Gao et al., 2004; Ademiluyi and Otun, 2009). Moreover, spatial decisions require the implication of several stakeholders; they are iterative, interactive and participative processes (Densham and Goodchild, 1989; Goel, 1999).
SDSS have been applied to several domains, such as urban planning, environment, natural resource management, transportation and business, which led to the use of several spatial modelling techniques and technologies (Nafaâ Jabeur et al, 2011). Examples of such application of SDSS includes rural land use planning (T V Rama Chandra et al), Rural land use, water shed management (Adhi Narayana, 2000, 2003; K V H Durga rao et al, 2004); Rural development (Anit Ghose, 2004); renewable energy (Andrew N. Arnette, 2010); malaria
elimination (Gerard C. Kelly et al, 2012); biodiversity conservation (Shirish Ravan, 2002), automated tree crop management (Aviva Peeters et al, 2012) agriculture (M.N Reddy and N H Rao, 1995; Vidya Kumbhar and T P Singh, 2013; Sreekanth P D et al, 2013); Indian Railways (Peter cook and Argha Mukerjee, 1996); ground water (A.Kumar and L B Prasad, 2002); water (Vairavamoorthy,2004); emergency management system (G K Pujara and Anjana Vyas, 2012); cyclone management (Adityam et al, 1998) Solid waste management (Ohri And Singh,2010; Yashwant B. Katpatal, 2011); Infrastructure-health and Education (K C Murty et al, 1999; Mili Ghose et al); Location planning (Iftikhar Uddin Sikder and Nagma Yasmin (1997) and land use allocation (Hbib M. Alshuwaikhat and Khaled Nasef, 1996).
2.2 GSDSS Components
Conceptually, a SDSS can be thought of as an integrated set of flexible capabilities: the implementation of such a system can be achieved using a set of linked software modules (Amstrong, Densham and Rushton 1986, Densham and Amstrong 1987). The number and exact description of components mentioned in the SDSS literature vary from three components as stated by Lolonis (1990) and Malczewski (1999); four components as designed by Densham and Good Child (1989); to five as stated by Armstrong and Densham (1990). In this paper, slum GSDSS was designed based on Armstrong et al, (1986) architecture.
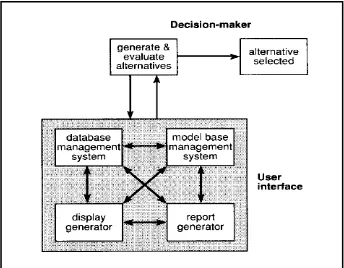
Working within Sprague’s (1980) framework, Armstrong, Densham and Rushton (1986) designed an architecture, which consists of a set of five integrated software modules. Each module provides a group of functionally related capabilities; there are modules for database and model base management systems, display and report generators and user interface. The five software modules (Figure 1) are represented by boxes. The user interface encompasses the other four modules because all interaction with the user takes place via the interface. The flows of data and information between the modules are represented by the arrows joining them.
Figure 1 - Proposed architecture for SDSS (After Armstrong, Densham and Rushton, 1986)
The decision-maker interacts with the system either directly or through the intermediary, employing an iterative solution process. The system output – including the solutions to models and database queries is presented in a graphical and tabular form to decision makers who evaluate them. A solution may be accepted by the decision makers or, if unanticipated and unacceptable characteristics are evident, it may be used to help define further analyses. The GSDSS for slum development has been designed (Figure2) by taking into account the recent
developments in information and communication technology, computer hardware and software and the general usage of high end gadgets. Hence this design has some alterations to the basic model of Armstrong et al (1986).
Figure 2 Geospatial Decision Support system designed for Slum development
The new design integrates all the three basic components of a traditional SDSS such as a Database management system (DBMS), a Model base management system (MBMS) and Graphical and tabular report generators. The new commercial software package has the capability of storing data in a required spatial format (with necessary topology and geometry), has appropriate tools to build spatial models and is easy to plug in with other customized software for graphical, tabular display in 2d and 3D format
For effective decision making, the user interface must be easy to use. It must be suitable to the graphic display of spatial information in both graphical and tabular forms. Hence the user interface needs to represent the objective space which depicts the parameters and solution space of an analytical model while the map space is a cartographic representation of the study area and the output of the model. The user must be able to view these three spaces simultaneously. Moreover, changes made in one space should be reflected automatically in other spaces. GSDSS supports these capabilities and is hence truly provides the user with a problem solving environment. Thus, the GSDSS supports the user who can adopt a variety of decision -making approaches using visual interactive modelling. So an important issue is how interactive is visual interactive modelling? How quickly can the results from an analysis be generated and presented to the decision maker? (Hurion, 1986;Alter, 1980; Vazsonyi, 1978, 1982 and Keen, 1983).
Since, the SDSS are often complex and can potentially be misapplied; the system itself should help the user to select appropriate models, data sets and modelling strategies (Armstrong et al, 1990). To act like an expert analyst, the system must have access to three types of knowledge: a problem described using environmental knowledge; procedural knowledge used to help design a solution process and determine the values of parameters in the models, and structural
knowledge (the steps of algorithms and data structures on which they operate) used to solve the problems.
2.3 Designing GSDSS
The development of a SDSS often requires that the problem be decomposed into several sub-problems, with different models being used to evaluate each sub-problem (Taylor et al. 1999). To support a decision research process, a geo processing system must facilitate the introduction of new factors into analyses. The system must also enable its users to change the relative importance of factors in analyses, both to evaluate the sensitivity of solutions and to reflect different opinions and objectives for the solutions (Densham, 1991). In the present study, RAY modules are used for designing GSDSS for slums.
2.3.1 Database management system:
The database for slum development has been stored in File geodatabase. It contains slum information in the form of point, line and polygon features. The geo referenced Geoeye satellite data provides other necessary spatial information both at slum and city level
.
Slum dwellers were involved in the preparation of slum maps and creation of slum data base.2.3.2 Model base management system:
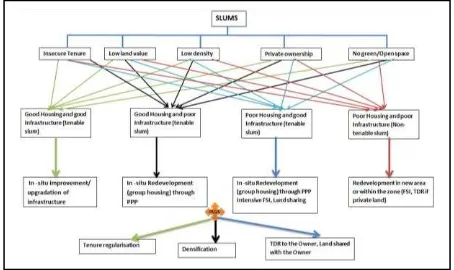
There are five major indicators used to identify the suitability of a particular slum for improvement, upgradation or relocation (Figure 3a and 3b).
Figure 3 a Slum have secured tenure for Improvement and Upgradation
Figure 3 b - Insecure tenure Slums for Improvement, Upgradation and Redevelopment
They are
Slum density: Total population of a slum/ total area of the slum
Land ownership and tenure: Government or Private, Secured or Non secured
Existing infrastructure: Availability of safe drinking water, Toilet facility, Sewage / Drainage facility, Electricity, Road, Public space/Community space.
Housing condition: Durability of house structure, Number of households in good condition
Accessibility: Closeness to amenities such as Schools, Health Centres, Working place, Bus stand, Market area.
2.3.3 Graphical display and Report generation
Based on the database created with the help of slum dwellers (Community participation), accessibility to facilities and suitability for slum redevelopment were checked through various analysis. With their input, alternative scenarios will be generated for evaluation.
The decision made will take into consideration the concern of all stake holders by evaluating alternative scenarios. Demonstrating the scenarios in 3D by using Arc Map and Community VIZ will certainly help the stake holders to decide the most suitable scenario for slum development.
2.4 Methodology
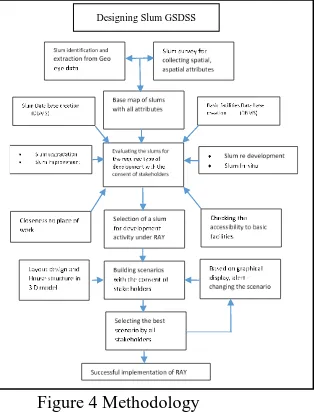
The following flow chart (Figure 4) explains the methodology followed in designing GSDSS for slums.
Figure 4 Methodology
Geoeye (2013) satellite data pertaining to Gulbarga was used to create base map of Gulbarga city and for extraction of slums. Feature extraction was done by using ENVI EX4.7. Two sample slum areas were taken for this present study.
2.5 Study area
Gulbarga is a city in the Indian state of Karnataka (Figure 5), and is the administrative headquarters of Gulbarga District. The city is undergoing rapid changes in terms of population growth as well as in the degree of urbanisation. Since the city is located in the economically under developed region i.e., Hyderabad Karnataka region, it became a nodal centre for many
developmental activities. Hence, Gulbarga started attracting the rural folk from neighbouring districts and the slum population is slowly increasing. Thus, slums became an integral part of rapid urbanisation. Currently 11% of its population are living in slums and there are 55 notified slum pockets and 17 are chosen for slum development activities under RAY.
Figure 5 Gulbarga city – slum case studies
3. RESULTS AND DISCUSSIONS
3.1 Selection of slum
In general, earlier slum development programs planned for new residential set up in open lands located in the outskirts of the city. Most of these new housing structures are away from the basic facilities and the place of work of the residents. This is one of the main reasons for the failure of earlier programs.
3.2 Footnotes
Figure6 Checking the accessibility of school and health centres to a selected slum
INDIA - KARNATAKA GULBARGA CITY
Designing Slum GSDSS
Therefore, based on the spatial database created with the help of slum dwellers (Community participation), the slum development method was first decided (Figure 3a and 3b).
Once the slum development method (slum upgradation, slum improvement, slum redevelopment and In-situ development) was decided based on the ownership of land, housing structure, population density, availability of open space and land value, then accessibility to facilities such as schools and hospitals and distance to transportation facilities were checked through various analysis. In the present case, In-situ development was recommended based on the open area available, land value, ownership, density of slum population and accessibility to basic facilities.
The buffer analysis and spatial query analysis (Figure 5) helped to understand the availability of schools, hospitals and closeness of transport facilities (Bus stand, Railway station). Most of the residents of this particular slum are engaged in informal trade activities and work as labourers and coolies in and around Bus stands and the Railway station.
3.2 Selection of households and housing structure
After deciding the slum development method, in this case, in-situ development, the next step is selecting the housing structure with the consent of slum dwellers. The slum details such as availability of open space, number of households needing upgradation/improvement/ complete renovation / reconstruction in new site are decided with the help of all stakeholders (Slum board, Municipal body, Corporator, NGOs, slum dweller association, residents).
The housing structure such as single floor or double storey structure are also decided as per the residents need. The structure of housing lay out and house structure for the particular slum can be created in Arc MAP with the help of Community Viz. They are developed in different scenarios and a 3D model of the same can be displayed for their visual understanding. This will help them to feel and analyse the advantage of each scenario of development and in deciding the best possible development suitable for them.
The following figure shows the three possible scenarios generated (Just for study purpose not with the consent of slum dwellers) for the particular slum with the help of Community Viz along with their graphical display in the form of bar charts.
Figure 7 Sample Scenarios Generated in CommunityViz
Any changes in the scenario will immediately be reflected in the graphical display. If it crosses the described limit for open space or number of houses, it will also create “alerts”, so that planning is done as per the prescribed limit of households, housing structure and so on.
The housing structure shown in figure 7 also includes sample structures for demonstration purpose. Actually all these activities should be done with the consent of all stakeholders during the implementation of RAY for best results.
Figure 8 3D Scenarios Generated in CommunityViz
Availability of large number of options for generating housing structures will help to build housing structures very close to reality in community Viz. When these models are shown to the stake holders, they can realize and feel the real structures and layout of their plan throughmanoeuvre option in scenario 3D viewer. This will help them to select the best scenario for their future.
If the slum development program is implemented with their involvement and decisions then it will surely be successful in achieving its target.
4. CONCLUSION
RAY program is an improved slum development program by Government of India by considering failures and weaknesses of earlier policies and planning programs. RAY emphasise the use of spatial technologies like GPS survey, GIS data base, remote sensing data and participatory GIS. But it lacks in decision support system for better implementation.
The GSDSS can help in a decision making process for semi structured spatial problems. The slum development is one such spatial problem that requires a system to store large amounts of spatial data, to create analytical models and to provide viable solutions in the form of many alternatives. Therefore, Geospatial Decision support system is the need of the hour to improve slum planning. The present case study demonstrates the strength of GSDSS and gives hope for successful implementation of RAY.
5. ACKNOWLEDGEMENTS
I am grateful to Prof Paul Densham, Department of Geography, University College of London for his continuous support; encouragement and wonderful guidance during my three months Commonwealth Fellowship period at UCL and for this work. I am also thankful to HUDCO/HSMI for the financial support they provided for this study. This is a part of the
Number of Houses
Available open space
HUDCO sponsored Project work. My thanks are due to Brahmpur Slum people for their input in designing the GSDSS.
References
Ademiluyi IA, Otun WO .2009. Spatial Decision Support Systems (SDSS) and Sustainable Development of the Third World. J. Sustainable Dev. Afr. 10(4)
Adinarayana, Jagarlapudi. 2003. “Spatial Decision Support
System for Identifying Priority Sites for Watershed
Management Schemes.” In First Interagency Conference on Research in the Watersheds (ICRW), 405–8.
Adinarayana, J., Maitra, S. and Dent, D.L. .2000. “Development of a spatial decision support system for land use planning at district level in India”, The Land, 4.2 : 111- 130. Adityam.K V and Debashish Sarkar. 1998. Development of a
GIS-Based Decision Support System for Indian Cities Affected by Cyclones, INCEDE rep 239–50.
Alter S L.1980." Decision Support Sytems: current practice and continuing challenges" Addision-Wesley, Reading Massachusetts
Armstrong M P, Densham P J, Rushton G.1986. “Architecture for a microcomputer based decision support system” , Proceedings of the 2nd International Symposium on Spatial Data Handling. International Geographical Union, Williamsville New York, PP.120-31
Armstrong,M.P., and P.J. Densham.1990 Database organisation strategies for spatial decision support systems, International Journal of Geospgraphic Information Science 4(1):3-20
Armstrong M P,DeS, Densham P J, Lolonis P, Rushton G, Tewari V K. 1990. “A knowledge- based approach for supporting locational decision making”, Environment and Planning B17: 341-64
Arnette Andrew N, Cliff T Ragsdale, and Loren P Rees. 2010.
“A Spatial Decision Support System for the Development of Multi-Source Renewable Energy Systems A Spatial Decision Support System for the Development of
Multi-Source Renewable Energy Systems.”
Avery Livengood and Keya Kunte.2012“Enabling participatory planning with GIS: a case study of settlement
mapping in Cuttack, India” Environment & Urbanization, International Institute for Environment and Development (IIED). Vol 24, No1, April, Pages 77–97.
Cook, P, and A Mukerjee. 1996. “INDIA RAILWAYS
GIS-BASED DECISION-SUPPORT SYSTEM.” 1996 ESRI User Conference.
http://trid.trb.org/view.aspx?id=677255.
Densham P J, Armstrong M P.1987. A spatial decision support system for locational planning: design, implementation and operation.Proceedings of AUTOCARTO 8.ACSM/ASPRS, Bethesda Maryland pp.112-21 Densham, P. J., Goodchild, M. F. (1989). Spatial Decision
Support System: A Research Agenda. Proceedings of
GIS/LIS ’89, Florida, pp. 707-716.
Densham, P.1991. "Spatial Decision Support Systems", in eds. Maguire, D.J., Goodchild, M.F.,
and Rhind, D.W., "Geographical Information Systems: principles and applications", Longman,
London.
Densham, Paul J. 1994. “NATIONAL CENTER FOR
GEOGRAPHIC INFORMATION AND ANALYSIS
Research Initiative 6 : Spatial Decision Support Systems
Closing Report”, no. November.
Gao, S., D. Sundaram, and J. Paynter. (2004). Flexible support for spatial decision making.
Paper presented at the 37th Annual Hawaii International Conference on System
Sciences, Honolulu, Hawaii.
Ghose, Anit. 2004. “AN INTEGRATED SPATIAL DECISION
SUPPORT SYSTEM ( SDSS ) FOR RURAL
DEVELOPMENT DEPARTMENT OF ORISSA”, 1–5.
Ghosh, Mili; Shantanu Lal and M. S. Nathawat. 2002. “Spatial
Decision Support System Using GIS Based Infrastructure: Planning in Health & Education for
Ranchi District.” In Map India.
Goel, R. K. 1999. Suggested framework (along with prototype) for realizing spatial decision support systems (SDSS). Paper presented at Map India 1999 Natural Resources Information System Conference, New Delhi, India Gorry G A, Mortan M S.1971."A framework for management
information systems" Sloan Management Review13: 56-70
Hbib M. Alshuwaikhat and Khaled Nasef. 1996. “A GIS-Based Spatial Decision Support System for Suitability
Assessment and Land Use Allocation.” The Arabian Journal for Science 21 (4): 525–43.
Hopkins L.1984. " Evaluation methods for exploring ill defined problems",Environment and Planning B11: 339-48 Hurion R D. 1986. Visual interactive modelling. European
Journal of Operational Research23:281-7.
Jabeur, Nafaâ, Nabil Sahli, and Hedi Haddad. 2011. “Sensor Network and GeoSimulation : Keystones for Spatial Decision Support Systems.” Edited by Chiang Jao, ISBN 978-953-307-441-2, 478 Pages, Publisher: InTech, Chapters Published September 06, 2011 under CC BY-NC-SA 3.0 License.
Katpatal, Yashwant B, and B V S Rama Rao. 2011. “Urban
Spatial Decision Support System for Municipal Solid Waste Management of Nagpur Urban Area Using High-Resolution Satellite Data and Geographic Information
System.” Journal of Urban Planning and Development, no. March: 65–76. doi:10.1061/(ASCE)UP.1943-5444.0000043.
Kelly, Gerard C, Marcel Tanner, Andrew Vallely, and Archie Clements. 2012. “Malaria Elimination: Moving Forward
with Spatial Decision Support Systems.” Trends in Parasitology 28 (7): 297–304.
http://www.ncbi.nlm.nih.gov/pubmed/22607693.
Kumar, Ashok, and Lal Bihari Prasad. 2002. “Development of Spatial Decision Support System for Groundwater Using
GIS Based Numerical Modelling Technique- Margajo Watershed , Hazaribagh Development of Spatial Decision Support System for Groundwater Using GIS Based Numerical Modelling Technique- Marg.” In 3. Hydrology And Watershed Management : Proceedings Of International Conference: With A Focal Theme On Water Quality And Conservation For Sustainable Development.
Lolonis, P(1990) Methodologies for supporting location decision making: State of the art and research directions. Working paper, Department of Geography, the University of Iowa
Malczewski,J. 1999. “GIS and multi criteria decision analysis”,
Newyork: John Wiley & Sons, Inc
M/o HUPA, 2012. “Slum development programs and Policies , Ministry of Housing and Urban Poverty alleviation,” 2012) http://mhupa.gov.in/
Murty KCS, Raheja J L and Ranjan Pushilal. 1999. “Spatial Decision Support Systems for GIS Based Infrastructure
Planning.” In Map India, 1999.
Narayana Reddy. M and Rao. N.H 1995. “GIS Based Decision
Support Systems in Agriculture National Academy of Agricultural Research Management Ragendranagar, Hyderabad –500 030”
Peeters, Aviva, Alon Ben-gal, Amots Hetzroni, and Manuela
Zude. 2012. “Developing a GIS-Based Spatial Decision Support System for Automated Tree Crop Management
to Optimize Irrigation Inputs.”
Pujara, Goral K, and Anjana Vyas. 2007. “Open Source GIS Software to Improve Decision Support System of
Emergency Management System”, no. Unisdr: 1–20. http://www.urisa.org/clientuploads/directory/Documents/ Journal/Under
Review/Pujara_Vyas_GIS_in_emergency_management.p df.
Ramachandra T V and Uttam Kumar. 2008. “Spatial Decision
Support System for Land Use Planning.” The Icfai University Journal of Environmental Sciences II (3). Ramanathan Sugumaran and John Degroote. 2010. "Spatial
Decision Support Systems: Principles and Practices ", CRC Press, 507 pages
Rao, K. H. V. Durga, and D. Satish Kumar. 2004. “Spatial Decision Support System for Watershed Management.”
Water Resources Management 18 (5): 407–23. http://link.springer.com/10.1023/B:WARM.0000049135. 79227.f9.
RAY. (2011). Rajiv Awas Yojana, M/o HUPA, Government of India.
Shirish Ravan. 2002. “Spatial Decision Support System for Biodiversity Conservation.” GIS@Development.
Sikder, Iftikhar Uddin, and Nagma Yasmin. 1997. “Spatial
Decision Support System for Location Planning.”
International Journal of Aerospace Survey and Earth Sciences 3 (4): 1–10.
Sreekanth, P D, S K Soam, and K V Kumar. 2013. “Spatial
Decision Support System for Managing Agricultural Experimental Farms” 105 (11).
Sprague R H.1980.A framework for the development decision support systems. Management Information Sciences Quarterly 4:1-26
Taylor K Walker G and Abel D. 1999. A framework for model integration in spatial decision support systems. International Journal of Geographical Information Science, 13, 533–555.
UN, Poverty, S. P. and C. D. 2008. Department of Economic and Social Affairs (DESA) - Economic and Social Council (ECOSOC). http://undesadspd.org/Poverty.aspx.
Vairavamoorthy, K, J M Yan, H Galgale Uk, S Mohan, and S D
Gorantiwar. 2004. “PEOPLE-CENTRED
APPROACHES TO WATER AND ENVIRONMENTAL SANITATION A GIS Based Spatial Decision Support System for Modelling Contaminant Intrusion into Water
Distribution Systems.” In 30th WEDC International Conference, Vientiana, LaoPDR, 513–20.
Vazsonyi A. 1978. Decision support systems:the new technology of decision making? Interfaces9:74-8
Vazsonyi A.1982. Decision support systems, computer literacy and electronic models.Interfaces 12: 74-8
Walsham and Sahay. 1999. "GIS for District level administration in India: problems and opportunities". http://www.uio.no/studier/emner/matnat/ifi/INF5220/h09 /undervisningsmateriale/Walsham_Sahay_presentation.p df.