A DATA DRIVEN METHOD FOR BUILDING RECONSTRUCTION FROM LiDAR
POINT CLOUDS
M. Sajadian1,*, H. Arefi1
1 Dept. of Surveying and Geomatics Engineering, Faculty of Engineering, University of Tehran, Tehran, Iran {m.sajadian, hossein.arefi}@ut.ac.ir
KEY WORDS: 3D building model, Building extraction, Segmentation, Edge points detection, Line approximation
ABSTRACT:
Airborne laser scanning, commonly referred to as LiDAR, is a superior technology for three-dimensional data acquisition from Earth’s surface with high speed and density. Building reconstruction is one of the main applications of LiDAR system which is considered in this study. For a 3D reconstruction of the buildings, the buildings points should be first separated from the other points such as; ground and vegetation. In this paper, a multi-agent strategy has been proposed for simultaneous extraction and segmentation of buildings from LiDAR point clouds. Height values, number of returned pulse, length of triangles, direction of normal vectors, and area are five criteria which have been utilized in this step. Next, the building edge points are detected using a new method named ‘Grid Erosion’. A RANSAC based technique has been employed for edge line extraction. Regularization constraints are performed to achieve the final lines. Finally, by modelling of the roofs and walls, 3D building model is reconstructed. The results indicate that the proposed method could successfully extract the building from LiDAR data and generate the building models automatically. A qualitative and quantitative assessment of the proposed method is then provided.
1. INTRODUCTION
Three-dimensional city modelling is one of the main applications of the LiDAR system. Reconstruction of buildings as main elements of 3D city models using manual, automatic, and semi-automatic techniques can be utilized. However, some problems such as, massive amount of data, time consuming processing, costly and low precision of manual digitizing techniques caused the researchers to look for automatic or semi-automatic methods. It is worth to mention that the success of automatic methods depend on density and accuracy of point clouds. Today’s LiDAR systems produce density of 4 to 10 points per square meters, with helicopters higher resolution of up to 80 points per square meter can be achieved. Unlike photogrametry, LiDAR does not record exact position of the edges of buildings. The increase of data density reduces the Concern due to the low accuracy of LiDAR at the edges. LiDAR point clouds are included features such as ground, buildings, roads, cars, trees, vegetation and other topographic 3D objects. Due to the variety of 3D objects and massive amount of points, extraction of valuable information from 3D LiDAR data is difficult and time consuming (Zari and et al., 2011). The first step in building reconstruction is the separation of building point clouds from others points. Next, using the building data, the three-dimensional building model can be reconstructed with different methods. According to the literature (Maas and Vosselman, 1999), there are two principal approaches of building modelling starting from airborne laser scanner data: the model-driven or parametric approach and the data-driven or non-parametric approach. The model-driven approach searches for the most appropriate model among primitive building models inside a predefined model library. On the other hand, the data-driven approach models a building regardless of its predefined form. So it attempts to model a primitive or a complex building by using the point clouds as initial data (Tarsha-Kurdi et al., 2007). Maas and Vosselman (1999) proposed a model-driven method by derivation of house
model parameters from invariant moments. Alharthy and Bethel (2002) proposed a method for reconstruction of prismatic model of buildings. Alharthy and Bethel (2004) based on estimated geometric surface parameters have been separated planar roof facets and reconstructed the building model. A projection based approach for 3D model generation of the buildings from LiDAR data was proposed by (Arefi et al. 2008). Kabolizadeh et al. (2012) proposed a model-driven approach for 3D building reconstruction from LiDAR data based on genetic algorithm (GA). Sattari et al. (2012) used a combinatory data-driven and model-driven method for reconstruction of cardinal planes and appended parts on roof. Many studies have been attempted to combine LiDAR data and images for building reconstruction such as Yu et al. 2010, Awrangjeb et al. 2013, and Li et al. 2013. Arefi and Reinartz (2012) employed extracted edge information from orthorectified Worldview–2 image as additional source of information for precise 3D building reconstruction. The use of cadastre maps as additional resource usually is used for separation of building points from other data points (e.g. Haala and Brenner 1999; Alexander et al. 2009; Kada and Mckinley 2009).
In this paper a new method is proposed for the reconstruction of 3D building model using irregular LiDAR point clouds. First, a multi-agent strategy for extraction of building from LiDAR data and segmentation of roof plane is proposed. For extraction of points of building edges, a new method used which named “grid erosion”. A RANSAC based algorithm has been applied to approximate building boundaries. Finally by modelling and integrating of roofs and walls 3D model of buildings are reconstructed.
2. PROPOSED METHOD
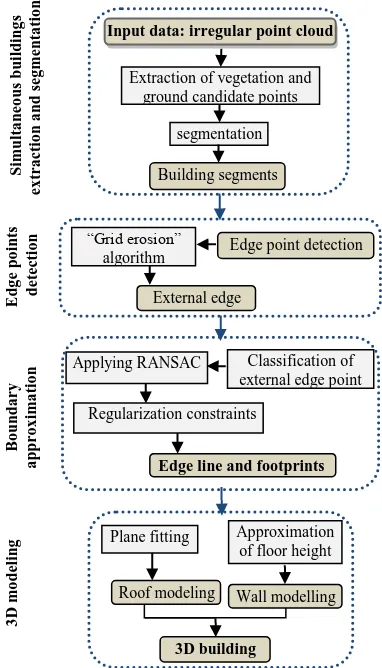
Figure 1. Workflow of proposed method
edge point detection, boundary approximation, and 3D modelling are the major steps in this algorithm. Detailed explanations are given in the following sections.
2.1 Simultaneous building extraction and segmentation
Point clouds are containing features such as ground, tree, vegetation, building and other 3D objects. First step for 3D building reconstruction is to separate building from other points. For this purpose, five criteria of height, number of returned pulse, length, normal vector direction and area are used which are described in more detail in the following sections.
The main features in the data that must be separated from the buildings are ground, trees and vegetation. Ground candidate points have lowest height among all data. We therefore use a ground or objects under vegetation. In these situations, two (or more) pulses are recorded; first and last pulse. It sometimes occurs on the edges of the targets such as buildings (green points inside red circle in Figure 2). This property can be used for the extraction of vegetations or tree points. One should also consider that the high density vegetation prevent from reaching
all pulses to the ground. In the next steps with analyzing the normal vector direction and area, remaining vegetation and tree points will be separated from building points. The ground candidate points extracted and vegetation candidate points extracted are shown in Figure 2.
Figure 2. Extraction of ground candidate points (black), vegetation candidate points (green), remaining
points (blue)
After extraction of ground and vegetation candidate points, these are removed from original data. Then, the neighbourhood connection is established using triangulation on remaining points. Here, a constrain is taken into account to remove some triangles connecting the edges between different objects or multi-layer structures. Removing these triangles has a key role in the segmentation process. Accordingly, if at least one of the sides of a triangle having the length larger than (Mian et al. 2004), it is classified as the triangle connecting the edges and must be removed (cf. Figure 3). The threshold is calculated by equation (1).
= standard deviation of the length of the triangle's sides.Figure 3. Constrained triangulation
(2)
First, for each triangle three neighbouring triangles according to its three sides are determined. A region growing algorithm starts working with a random triangle ( ) .Three neighbouring triangles of this triangle are considered and angle between unit normal vector of them ( ) and random triangles ( ) by internal multiplication is calculated:
(3)
If
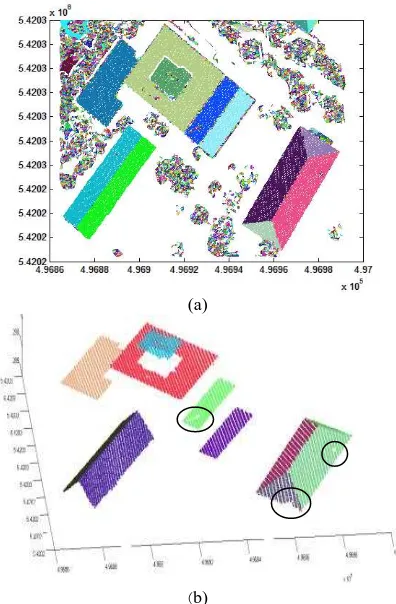
be smaller than defined angle threshold, related triangle (c.t) added to segment of random triangle and neighbouring triangles of this triangle (c.t) are considered. This process continues until all triangles that satisfy this limitation set to be same segment. Then, region growing algorithm continues by another random triangle which is selected among remaining triangles until all triangles are segmented (cf. Figure 4a). After that, many segments are generated; large segments, having an area larger than defined threshold, are related to the buildings because buildings are usually formed by simple planes with equal normal vectors for same planes. But vegetation regions and most artificial regions create small segments with high variation on normal vector changes due to their nature shapes. In consequence, simultaneously with the removal of non-building points, non-building points are extracted and segmented. Segmentation results are shown in Figure 4.(a)
(b)
Figure 4. a) Segmented triangles, b) Building segments points
2.2 Edge point detection
Next to extraction of building segments, edge points of each segment can be detected. Points of triangles having no neighbouring triangles are extracted as edge points. As it can be seen in Figure 4b (black circles), during the extraction process noises, external objects and tree points on roof building have been removed. It is an advantage of our proposed methods, but leading to create the undesired edge points. About of segments are placed on each other, there is the same problem. These undesired edge points as internal points are known and must be removed. In this paper, a method named ‘Grid Erosion’ is employed for removal of these internal points and therefore finding real edge points.
Grid Erosion: this process named ‘Grid Erosion’ because of using the morphological erosion operation which is applied on a regular grid. Each segment in 3D space is considered, imaginary grid is laid over it and 3D coordinate of grid points with nearest neighbour method are determined. So, segments are converted from vector to raster space and accordingly image processing techniques can be employed. Gaps must be filed and then erosion operation is applied on every grid. By using this process, the grids will be shrunk or compressed. Then, edge of eroded grid is detected. These edge points as a boundary are used for separating internal and external edge points. So, that all points in the vector space that are inside this closed boundary is known as internal or undesired edge points which will be removed. As shown in Figure 5, ‘grid erosion’ could successfully extract external edge points in vector space. Green points related to edge of eroded grid, red points related to internal edge or undesired edge points and final edge points are shown in blue colour.
Figure 5. Edge points of: eroded grid (green), internal (red), final (blue)
2.3 Line approximation
After detection of final edge points, we have used RANSAC algorithm to approximate building lines. RANSAC is a powerful technique in line fitting. In this technique, parameter selection plays very important role to reach correct results. In order to reduce the sensitivity of RANSAC to select parameters and no need for heavy post-processing, edge points are grouped by considering the angle among two consecutive connecting convex points. In the first step, convex point of each segment is determined and arranged in a certain direction e.g., clockwise. By connecting any two consecutive convex points a line is
t s
N
.t s.
t c
N
.)
(
cos
1 Ns.t
Nc.t
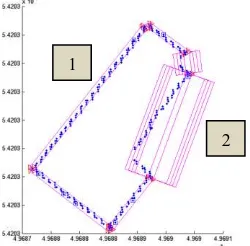
created. Angle between these lines is calculated. If angle is smaller than the defined threshold, it shows that it belongs to a unit segment lines. Usually, a threshold of about 13-17 degrees is appropriate. This process is repeated for all lines in order to detect all convex points belonging to the same line. Next step is determination of all edge points belonging to the each classified line. For this purpose, first and last convex points of every line segment are determined. A rectangle is placed around these points. The inner edge points of this triangle known as edge point of each line segment (cf. Figure 6). If number of edge points of each line segment be (n) and length of corresponding line be (l), while the ratio of n to l be smaller than predefined threshold is known as non-convex line segment. In this case, line segment consists of several lines (cf. Figure 6 region 2). After identifying the non-convex parts, threshold (width of rectangle) in certain steps, such as one meter increase until all the edges of the segments line are identified.
Figure 6. Convex (1) and non-convex (2) line segments
After Classification of edge points, a RANSAC method is separately applied on each classified edge-points group. For non-convex lines segment the process must be repeated until all lines are extracted. After applying the RANSAC algorithm, primary lines are generated (cf. Figure 7a). For accessing final lines, regularization constraints must be performed. The main regularization constraints are: (1) removal of the small lines, (2) forcing approximately parallel lines to being exactly parallel by turning around weighted azimuth average, (3) merging of lines close to each other, (4) connecting two consecutive parallel lines with an orthogonal line and (5) intersection of crossover lines. In buildings with tilted roofs, segments buildings are intersect to reconstruction of internal lines. Results are shown in Figure 7b.
(a)
(b)
Figure 7. Polylines approximation a) primary lines by using RANSAC algorithm, b) Final lines after applying regularization
constraints
2.4 3D modelling
After extraction of building edges, we can reconstruct the 3D building models. This can be employed in two steps; roof and wall modelling. All points of each building segment in 3D space are considered. Using least square technique, a plane is fitted to these points. The height of the start and end points of each line is measured according to the equation of plane fitted. Using this information, roof models can be reconstructed. Approximation of floor height is necessary for reconstruction of wall models. We used morphological dilation operation for finding points around building. All original points around building except vegetation and building extracted points are detected. The average value of minimums of these points is determined as floor height. At the end, roof points projected on floor building. Using wall and floor points, wall models are reconstructed.
3. RESULTS AND DISSCUSION
The proposed algorithm for 3D reconstruction of building models has been tested in an area located at Vaihingen city of Germany. The average point density is about 4 pts/m2.
(a) 1
(b)
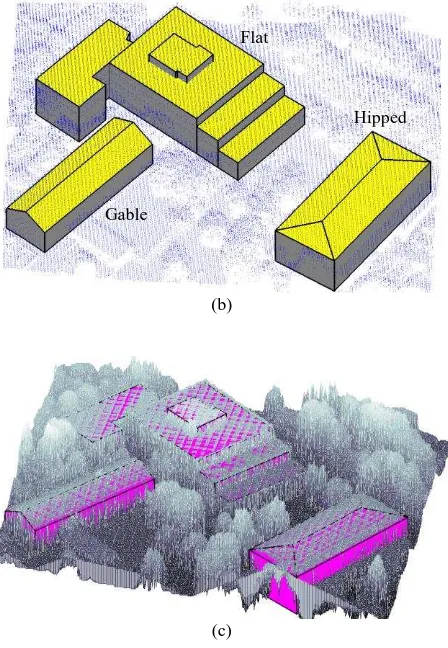
(c)
Figure 8. a) Aerial image, b) building models on DSM, c) building models on point clouds
The visual interpretations of the models with the DSM (Figure 8 b), shows that building’s planes have been successfully estimated by least square method and located on correct locations. In proposed methods by removing external objects on building roof and noises (cf. Figure 4b), plane fitting process have been done with high precision. Figure 8(c) shows that 3D building models are laid over original point clouds. Proposed methods could identify all segments of multi-level flat building. In this type of buildings, segmentation is difficult due to existing same normal vector direction. In this case, using equation 1 we could separate parallel building segments. Eliminating big triangles by using equation 1 have a key role in correct segmentation process. Because, triangles between two parallel segments are removed and consequently neighboring relation are removed. Two main factors in separation of building roof planes (segments) are variance factor
t
and the angle threshed. If a large t is selected, the triangle between two planes of building might be remained. Experimentally the appropriatet
is selected between 0.3-0.7. The angle threshold is very important, if we want to exactly separate planes from each other, an appropriate angle threshold of about 13-18 degree has been experimentally selected.In addition to visual interpretation, a quantitative assessment is performed. Due to the lack of a ground truth, building roof model is manually digitized from LiDAR point clouds and compared with building roof models that reconstructed using proposed method. The differences between the corner points have been compared and the results are given in table 1.
Std. hipped buildings is better than flat building. Thin walls in edge of flat building act as a noise which will be removed in segmentation process. However it increases height accuracy but decreases horizontal accuracy. Because by removing thin wall, precision of fitted plane to roof points increase. Errors yield from all phases of building extraction, edge points detection, line estimation and others. So, it proves that the methodology leads to very good results. After all, as Table 1 shows, all edges are compressed inward; adding positive values to the edges to triangle neighbourhood have contributed to the correct segmentation. The sensitivity of RANSAC algorithm to determine the appropriate parameters has reduced by pre-classification of edge points. Another advantage of proposed method is the removal of interpolation effects since the algorithm is applied on the original point clouds. Finally, a number of important limitations needed to be considered. As previously mentioned, LiDAR might not record exact position of the building edges. Many researchers have attempted to combine LiDAR data and images to compensate these shortcomings and problems which cause increasing the precision of reconstructed three-dimensional models of building.
REFERENCES
Alexander, C. Smith-Voysey, S., Jarvis, J. and Tansey, k., 2009. Integrating building footprints and LiDAR elevation data to classify roof structures and visualise buildings Computers, Environment and Urban Systems 33. 285–292.
Alharthy, A. and Bethel, J., 2002. Heuristic filtering and 3d feature extraction from liDAR data. International Archives of Photogrammetry Remote Sensing and Spatial Information Sciences, vol. 34(3/A), pp. 29-34.
Alharty, A. and Bethel, J., 2004. Detailed building reconstruction from airborne laser data using a moving surface method. IAPRS international archive of photogrammetry and remote sensing, vol.34, part 3 b3, pp. 213-219.
Flat
Gable
Arefi, H., Engels, J., Hahn, M. and Mayer, H., 2008. Levels of detail in 3d building reconstruction from LiDAR data. International archives of the photogrammetry, Remote sensing and spatial information sciences. vol. xxxvii, part b3b., pp. 485-190.
Arefi, H., and Reinartz, P., 2013.Building Reconstruction Using DSM and Orthorectified Images. Remote Sensing. 5(4), pp. 1681-1703.
Awrangjeb, M., Fraser, C. S., & Lua, G., 2013. Integration of LiDAR data and orthoimage for automatic 3D building roof plane extraction. In Multimedia and Expo (ICME), 2013 IEEE International Conference on (pp. 1-6). IEEE.
Haala, n., and Brenner, c., 1999. Extraction of buildings and trees in urban environments, ISPRS Journal of Photogrammetry and Remote Sensing, volume 54, 130-137.
Kada, M., McKinley, M., 2009. 3d building reconstruction from LiDAR based on a cell decomposition approach. Stilla U, Rottensteiner F, Paparoditis N (Eds) CMRT09. IAPRS, Vol. XXXVIII, Part 3/W4 Paris, France, 3-4.
Kabolizade, M., Ebadi, H. and Mohammadzadeh, A., 2012. Design and implementation of an algorithm for automatic 3d reconstruction of building models using genetic algorithm international. International Journal of Applied Earth Observation and Geoinformation. Vol. 19, pp.104–114.
Li, H., Zhong, C., Hu, X., Xiao, L., and Huang, X., 2013. New methodologies for precise building boundary extraction from LiDAR data and high resolution image. Sensor Review, 33(2), 157-165.
Maas, H.G. and Vosselman, G., 1999. Two algorithms for extracting building models from raw laser altimetry data. ISPRS Journal of Photogrammetry & Remote Sensing 54 153–163.
Mian, A.S., Bennamoun, M, and Owens, R. A., 2004. Automatic Multiview Coarse Registration of Range Images for 3D Modeling. Proceedings of the 2004 IEEE Conference on Cybernetics and Intelligent Systems Singapore, 1-3 December, pp.158-163.
Satari, M., Samadzadegan, F., Azizi, A., and Maas, H. G., 2012. A Multi‐Resolution Hybrid Approach for Building Model Reconstruction from LiDAR Data. The Photogrammetric Record, 27(139), 330-359.
Tarsha-Kurdi, F., Landes, T., Grussenmeyer, P. and Koeh, M., 2007. Stilla U et al (Eds) PIA07. International Archives of Photogrammetry, Remote Sensing and Spatial Information Sciences, 36 (3/W49A).
Yu, Y., Liu, X. and P.Buckles, B., . 2010. A Cue Line based method for Building Modeling from LiDAR and Satellite imagery. Second International conference on Computing, Communication and Networking Technologies