CREATION OF A WEB MAP AND MOBILE APPLICATION BASED ON A PRINTED
BOOK
V. Holubec a*, T. Valáškováa, L. Halounová a
aDept. of Geomatics, Faculty of Civil Engineering, Czech Technical University in Prague, Thákurova 7, 166 29, Prague 6, The Czech Republic, [email protected], [email protected], [email protected]
Commission VI, WG VI/4
KEY WORDS: GIS, ArcGIS, History, Web Application, Nazi Occupation 1938-1945, Protectorate of Bohemia and Moravia, Book Conversion
ABSTRACT:
The project describes a process of conversion of printed books into a web map and mobile application. The goal of the project is to make spatial data in the book accessible to wide public using GIS especially on web in order to spread the information about this topic. Moreover, as a result of the analysis and of the new perspectives gained from the data context, historians will be able to find new connections.
The books that serve as sources of the project (two books with the scope of about 1400 pages featuring hundreds of locations where each location is associated with more events of different types) refer to places with many addresses in Prague and some villages in the Czech Republic which are related to events that took place during the World War II.
The paper describes the steps of conversion, the design of the data model in Esri geodatabase and examples of outputs. The historical data are connected to actual addresses and thanks to such a combination of historical and actual locations, the project will help to discover a part of the history of the Czech Republic and it will show new context in data via GIS capabilities. This project is a continuation of a project which recorded a march of death on a map.
This is a unique project created in cooperation with Academia Publishing. The outputs of the project will serve as a core resource for a multimedia history portal. The author of the book is currently writing sequels from the post-war period and at least two other books are envisioned, so the future of the project is ensured.
1. INTRODUCTION
In the last couple of years, two books were published by the Academia publishing house: Guide to Protectorate Prague and Bloody Finale –both by author Jiří Padevět (Padevět, 2013, 2015) which remind us of period in the Czech history between 1939-1945 when the area of the Czech Republic was occupied by the Nazi forces and the land was called the Protectorate of Bohemia and Moravia. Both books (featuring together about 1400 pages of text) refer to thousands of places in Prague (in the first mentioned book) and some villages in the Czech Republic (in the second book). The places were related to several event types which were important in this period. The book features many events such as the imprisonment of many students after the 17th November 1939 (nowadays known as the Student Day, the annihilation of a village called Ploština during the final period of WW II, and places where members of the resistance lived, where occupation forces had their institutions or places related to death marches. Both books contain precious historical data with spatial information concerning these places.
These books have strong potential impact on many readers (the book Guide to Protectorate Prague was announced the
book of the year 2014 in the Czech Republic) and also on historians. However, they are still printed books – which presents some difficulties if you want to use them as guides to explore places described here and to attain a spatial overview of all events mentioned by the author.
The creation of the GIS project was motivated by several reasons. The first one is educational – to highlight places and events in a more user-friendly way – digital maps, which are, in our case, upgraded to GIS. It is even more important for raising the historical awareness. Therefore, the educational reason coincides with a large-scale spreading of knowledge using internet and e-media.
Conversion of these books is a great opportunity to get this information closer to the “e-generation.”
It provides the historian with a framework to analyze this event from a new point of view.
The third reason is also scientific, but is specially aimed at GIS and designated for spatial data experts. The conversion of the book to GIS in a usable form is a challenge with respect to the creation of a data model, which can be used in web map and aweb and mobile application.
This paper will discuss the last mentioned objective – the conversion. The data model and its limitation in web map/mobile application and its solution will be analyzed. The last chapter is dedicated to mobile and web applications.
The Esri platform was used for the data processing and publishing outputs – ArcGIS Desktop together with ArcGIS Web Solution (ArcGIS for Server and ArcGIS Online) for publishing on the internet.
Another objective was to explore WYSWYG solutions of Esri for creating a Web and native mobile application. The authors avoided direct code-writing solutions such as Esri JavaScript API for creating web application or programming languages for creating mobile application (Java, Objective-C, .NET).
The conversion process was also consulted with the author of the books.
2. THE CURRENT STATE OF RESEARCH ON THE SIMILAR TOPIC
The conversion between a book and a web or mobile application is not a popular topic. Nowadays we are using web applications or mobile applications more often than classic tourist maps. Guide books are replaced by e-books. Therefore, we expect there will be more papers focusing on this topic in the future (Valášková, 2016).
One interesting paper dealing with this topic is a bachelor thesis called Web application of events in Prague in time of the Protectorate Bohemia and Moravia (Pražák, 2014). It was the first attempt to convert one of two books processed in this paper (Padevět, 2013). In this thesis, address points with attributes, which contain all details from the book are related to their appropriate address. The symbology is based on quarters of the city of Prague, but there are no additional attributes. The author also used an old map of Prague (from the period of World War II) as a background, however, in quite a coarse resolution. The map does not cover the whole city of Prague. A map in Esri ArcGIS Online and simple web application based on Esri SpyGlass template for web application are the outputs of the thesis. The project described by this paper was in principle based on the thesis, but due to many limitations and not the most suitable database model, the entire GIS model was created from scratch. Thus, the comparison between this topic and the mentioned thesis is not relevant.
Another interesting project is a web application based on Esri JavaScript API with a similar topic – the air bombing of the city of Brno by the USAAF and the Red Army between 1944-1945 (T-MAPY, 2014). This commercial project was not based on a book but stemmed directly from the information from archives, which were also the main source of information for the book we further processed. The application shows the points of bomb explosions. The user
can filter the explosions by date and army. The attributes also contain figures. The imagery basemap was chosen as a basemap and the Historical map of Brno represents the basemap of the GIS application.
This project combines a similar approach for the project design as the one set up in the diploma thesis and a functionality of the system based on principles of a commercial project.
3. DATA SOURCES
This chapter describes the books in more detail, which is necessary for better understanding the geodatabase data-model. The second part is dedicated to the data which were used to locate points in the map and data sources of thematic raster layers which served as context layers for events related to particular points.
3.1 Guide of the protectorate Prague
The first book Guide to Protectorate Prague: Locations – Events – People) describes individual address locations within the city of Prague in the period of the Protectorate Bohemia and Moravia (March 1939 – May 1945). The points described in the book are divided to chapters by the current quarters of the city (except for the part of Prague 1 – which was divided into two chapters) and distinguished by colors. Each address comprises collaborators, Nazis, members of resistance or victims of the regime (especially Jews) at this particular address. There are descriptions of bigger events (for example The Prague Uprising) where the story can be composed from partial events of individual addresses.
The Fig. 1 shows an example of a record of a particular address in the book.
Figure 1. Address: Badeniho 290/1 (Padevět 2013).
The street Badeniho 290/1 is located in Prague 6 (part of chapter about Prague 1 in the book). The number 290/1 is the ID of the address location in the chapter. The temporal street name in the particular years is in the parenthesis. It provides optional information of the object. The German name of the street is in the third row. In the Protectorate all streets had two names –a German one and a Czech one). The paragraph depicts the events related to the place. The text above states:
Defence of the Nation – including Colonel Josef Churavý. Josef Srstka was executed in Berlin Plötzensee on 10th March 1943.”
The format of described places (address, streets, crossings of streets, etc.) is almost the same for all places. Sometimes there is also a historical image of the place or of people connected to the place. To easily locate a particular address, a basemap is provided with each place in the current chapter – see Fig. 2. on the next page.
3.1.1 Types of Events: After the analysis of all texts in the books, it was decided to classify individual records of the book according to the classes mentioned below.
Collaboration and fascism class describes places related to a place where for example quislings resided or to places which were connected to occupiers, Czech Nazis and fascist organizations
Resistance class – places connected to Czech resistance – hidden flats, meeting points, places of action or places where members of resistance were arrested
Uprising class – places connected to the uprising at the end of the WW II – here especially the May Uprising in Prague
Jews and the holocaust class – places connected to Jewish inhabitants, synagogues and places connected to Shoah
Life in Protectorate class – places connected to common life in the period of the Protectorate, for example culture, sports events, etc.
Figure 2. Overview of places of Prague 1 (Padevět, 2013)
3.2 Bloody Finale
The second book is called Bloody Finale (Krvavé finale in Czech) was also written by Jíří Padevět and published by Academia Publishing House in 2015.
This book shows locations within the area of the Czech Republic connected with the final days of WW II. The book is divided into chapters according to countries. The points in the book contain information about the massacres of retreating Nazi forces, about the Czech uprising, transports and death marches and about the Nazi anti-guerrilla operations.
The book processing could be divided into two parts. Places located in the area of Prague are distinguished by the Prague quarters. Particular addresses, streets or places defined by crossings of streets are described there. In this type of places, the description is almost the same as it was in the first book – Czech and German names of streets, names of the house (if it still exists), types of events for the whole address (this is the main difference in spite of the first book).
In case of places outside Prague, the location is determined by the part of the village or village itself. In these types of records, the Czech name of the village, the district, the type of events in the whole village and particular events themselves are provided.
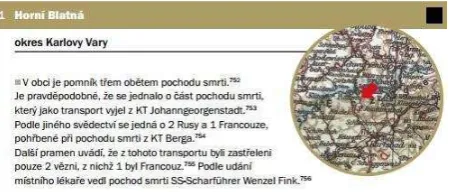
Figure 3. Horní Blatná (Padevět, 2011)
Fig. 3 describes a record of Horní Blatná (ID = 11 in the chapter), including information about the district – Karlovy Vary. Right next to Fig. 3 an approximate location is indicated in an old German map. The following text describes the event.
“In the village, there is a memorial to the victims of a death march. It was probably a part of a death march which was commenced as a transport from the Johanngeor genstadt concentration camp. The statue of two Russians and one French buried here within a death march from the concentration camp Berga provides another testimony. Another source stated that from this transport only two prisoners were shot and one of them was French. According to the testimony of a local doctor the SS-Scharführer Wenzel Fink was in charge of this march.”
Preceding the chapter, there is a historical map with all places in the chapter displayed in the same way as it is described for the first book in chapter 3.1
3.2.1 Types of Events:
Massacres of retreating Nazi force class – describes violent actions of army units (Wehrmatch, SS, Sipo, Volksturm) against the civilians who were in the proximity of these units or actively trying to slow down the enemies.
Czech uprising class – describes acts of violence against prisoners and real/assumed civilians involved in uprising. showing these types of events was developed in the previous project.
Nazi anti-guerrilla operation class – with the advancing front, the guerrilla groups were on the increase. These groups were operating mainly in Moravia. With the forthcoming end of the war, the police and army force brutalized (Mallmann and Paul, 2010), which led to mass murders of whole villages –for instance Ploština.
Several places are of a combined type, which consist of the maximum of two above mentioned types. For example – Suppression of uprising & Transports and Marches of Death classes– see Figure 5. Symbols for the.
3.3 Positioning Data
The feature layer with georeferenced points had to be used for the positioning of records from the book. For this purpose, the address points from the Czech Register of Land Identification –(RÚIAN) in CSV format in JTKS1 coordinate system was used (ČÚZK, 2016). The Register data are free for use. The data was downloaded on 2nd February 2016.
The address in the Czech Republic consists of the street name, city quarter house number / orientation house number, ZIP Code and City or quarter of the City (in our case quarter of Prague). All these attributes were in the CSV file. Additional attributes were added such as ID address code, ID of the city as well as the Y and X coordinates.
Since the book Bloody Finale refers mostly to villages, a villages, ID of part of villages, ID of district and ID of region and also coordinates in JTSKChyba! Záložka není and by multiplying the coordinates by -1.
3.4 Other Data
Furthermore, several other types of data were used such as the city plan of Prague and the map of Bohemia and Moravia from 40s (Brichta 2016). These city plans were just scanned grids, which were georeferenced to JSTK in Esri ArcMap. The plans were used as operational layers, which help the user compare the historical and current state of the area.
As the main basemap served the Basemap of the Czech Republic and the aerial images map of the Czech Republic, which is available at ArcGIS Server of COSMC on the url: http://ags.cuzk.cz/arcgis/rest. Both map services were used as basemaps in the web-map (see chapter 75.4).
4. CREATION OF THE DATA MODEL Chapters 3.1 a 3.2 present the core of the conversion process. The whole conversion was the real challenge, especially when it came to the question of how to define the main point layer and how to interlink all attributes. There were 3 approaches.
The first scenario was based on a premise that the point layer will be created from address/village locations, to which the non-graphic table with events/records from the book and other attributes will be related in 1:M relation. This scenario cannot be used because there is no option of dividing layers based on the event type in ArcMap table of content or in map service.
The second scenario was based on such a premise that each event/record in a book will be represented as a separate point. This scenario is very useful due to the finest filtration options. The relation between point layer and other attributes is 1:1 or M:1. We rejected this scenario since there are several records connected to the same address, so this would lead to the multiplicity of points at one location. It would lower the level of useful visualization.
The last scenario was a compromise. We created a separate layer for each event type. This scenario was the most suitable one for this project, because it allowed the division of event types. There is a point feature provided in the geodatabase of a particular event type for each village/address point. There could be a maximum of five points at one location (five types of events for the book Guide to Protectorate Prague. Bloody Finale has just one type of event for one village/address. The problem with multiplicity was solved by symbology – see chapter 6. The non-graphic tables with particular events were related to the feature layers depicting event in 1:M relation.
4.1 Structure of Geodatabase
The Esri geodatabase was used for preparation. Esri Enterprise Geodatabase (hosted on Microsoft SQL Server 2014) was used as data source for publishing for map service (due to the future availability of the utilization of Feature Access Service on ArcGIS Server, which requires data to be stored in the Enterprise geodatabase). The structure of feature class and tables and relation is the same for both. Data were also prepared for offline application of Feature Access Service so the Esri Global ID was added as an attribute to all layers and tables and the archive option was enabled for all layers and tables because the geodatabase is non-versioned.
parts of Prague, used villages, parts of these villages and streets.
The geodatabase consists of two datasets (typy_udalosti_PPP, typy_udalosti_KF). Each dataset represents one book. Datasets are in the S-JTSK East North coordinate system as all feature classes. Each DataSet contains feature layers named by event type for the given book. For example: kolaborace_fasismus and zivot_v_protektoratu in case of Guide to Protectorate Prague (see 3.1.1 or Figure 4).
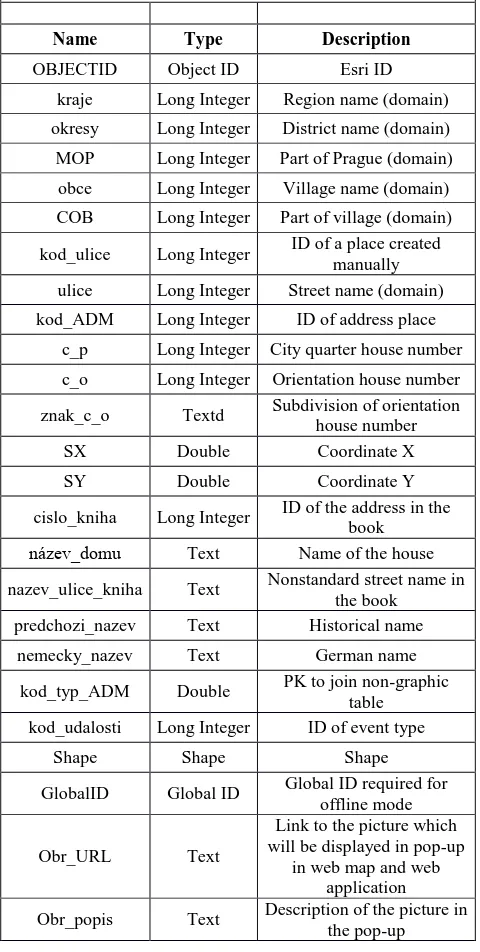
Table 1. Attributes of feature class for Guide to Protectorate Prague
Attributes of feature class for Guide to Protectorate Prague
Name Type Description
OBJECTID Object ID Esri ID
kraje Long Integer Region name (domain)
okresy Long Integer District name (domain)
MOP Long Integer Part of Prague (domain)
obce Long Integer Village name (domain)
COB Long Integer Part of village (domain)
kod_ulice Long Integer ID of a place created manually ulice Long Integer Street name (domain)
kod_ADM Long Integer ID of address place
c_p Long Integer City quarter house number
c_o Long Integer Orientation house number
znak_c_o Textd Subdivision of orientation house number
SX Double Coordinate X
SY Double Coordinate Y
cislo_kniha Long Integer ID of the address in the book
název_domu Text Name of the house
nazev_ulice_kniha Text Nonstandard street name in the book predchozi_nazev Text Historical name
nemecky_nazev Text German name
kod_typ_ADM Double PK to join non-graphic table kod_udalosti Long Integer ID of event type
Shape Shape Shape
GlobalID Global ID Global ID required for offline mode
Obr_URL Text
Link to the picture which will be displayed in pop-up
in web map and web application
Obr_popis Text Description of the picture in the pop-up
The example of types/feature layers for Bloody Finale are typ1_potlaceni_ceskeho_povstani or typy_1_2 (for the
combined type – see 3.2.1 and Figure 5. Symbols for the) for the DataSet for Bloody Finale.
Attributes of feature class for Bloody Finale
Name Type Description
OBJECTID Object ID Esri ID
kraje Long Integer Region name (domain)
okresy Long Integer District name (domain)
MOP Long Integer Part of Prague (domain)
kod_obce Long Integer ID of the village
obce Long Integer Name of the village (domain) kod_COB Long Integer ID of the part of village
COB Long Integer Village part name (domain) kod_ulice Long Integer ID of the street
ulice Long Integer Street name (domain)
c_p Long Integer City quarter house number
c_o Long Integer Orientation house number
SX Double Coordinate X
SY Double Coordinate Y
cislo_kniha Long Integer ID of the address in the book
nazev_obce_kniha Text Nonstandard street name in the book predchozi_nazev Text Historical name
nemecky_nazev Text German name
nazev_domu Text Name of the house
kod_udalosti Long Integer ID of the event type
kod_typ_obce Double PK to join non-graphic table
Shape Shape Shape
GlobalID Global ID Global ID required for offline mode
Obr_URL Text
Link to the picture which will be displayed in pop-up
in web map and web application
Obr_popis Text Description of the picture in the pop-up Table 2. Attributes of feature class for Bloody Finale
A non-graphic table with particular events was provided for each book. Between feature classes and non-graphic tables, the connection was implemented by the relationship classes with the simplest settings – original table is a feature class, destination table is the non-graphic table, the relation was always 1: M, the propagation of changes was set to none, as the relation attribute was chosen attribute kod_typ_ADM for Guide to Protectorate Prague and kod_typ_obce for Bloody Finale.
<Name of feature class>_attach (non-graphic table for entering attachments).
<Name of feature class>_attachrel (relationship class – 1:M between point feature class and table Name of feature class – attach)
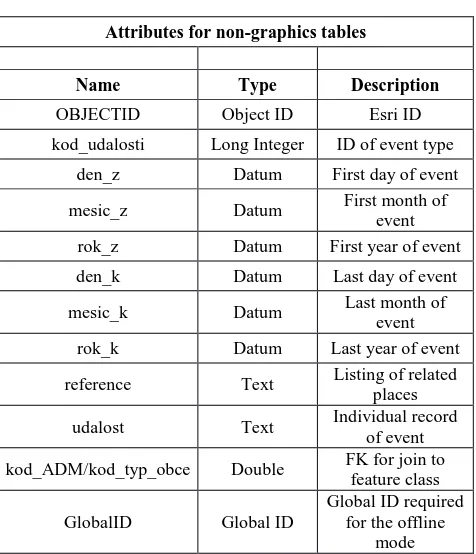
Attributes for non-graphics tables
Name Type Description
OBJECTID Object ID Esri ID
kod_udalosti Long Integer ID of event type
den_z Datum First day of event
mesic_z Datum First month of
event rok_z Datum First year of event
den_k Datum Last day of event
mesic_k Datum Last month of
event
rok_k Datum Last year of event
reference Text Listing of related places
udalost Text Individual record
of event
kod_ADM/kod_typ_obce Double FK for join to feature class
GlobalID Global ID
Global ID required for the offline
mode
Table 3: Attributes for non-graphics tables
4.2 Simplified data model
When processing of data and creating the web application and mobile application we ran into issues with displaying the 1:M relation records – see chapter 5.7. It was found that the template for the mobile app does not support coded domain values. A workaround was created for these issues – individual events was merged to just one record of event per type per location – data from relation 1:M was simplified to relation 1:1 and for attributes the domain were converted to plain text attributes. Thus for each location type and location there was a single point containing all attributes in its attribute table.
5. DATA PROCESSING 5.1 Used software
The project covers a wide area from Desktop to Cloud software. Because the authors planned to avoid combinations of several software platforms, the Esri platform was chosen since it covers almost all that is needed. Only two parts were managed by the Microsoft Software. The geodatabase had to be filled with some dataset. It was a set of tables which were created in Microsoft Excel. The ArcGIS for Desktop was used for the geodatabase creation, data cleaning and symbology creation. The publication of data on the internet was performed using ArcGIS for Server. Data which are used by the ArcGIS Server are taken from Esri Enterprise geodatabase (so called SDE database) on Microsoft SQL
Server. The presentation on the web, i.e. the web map, web application and mobile application was performed using Esri ArcGIS Online (namely in this order – ArcGIS Online WebMap, Web AppBuilder on ArcGIS Online, AppStudio Online).
The secondary output of the project consisted in the test of suitability of ArcGIS platform for these kinds of complex projects.
5.2 Desktop processing
Before the creation of the geodatabase itself, it was necessary to edit data to the form appropriate for their import to the geodatabase, thus at first all tables were created in Excel. There was a column created and named udalost and the data of events from the book was copied one by one to Excel. Each event was analyzed and assigned to the particular event type. This part was very time-consuming and resulted in more than 4000 rows/records/events which had to be manually recorded in the table. The linguistic correctness of the event descriptions was also checked. In Excel there were three types of tables. One table, which became a feature class, contains, among other, coordinates and address/village location information. The second table type contains (among other) individual event record, with information about the type of event and address related to the event. The third table types featured tables with domain values.
The file geodatabase was created in ArcMap. Excel tables were converted into ArcMap to Geodatabase via the tool Excel to Table. From the tables with domain values, the domains of geodatabase were filled by the tool Table to Domain. Point Feature class was created from tables which contained X, Y coordinates, by the combination of tools Display X, Y data and Export data. The domains were assigned to particular attributes in the attribute table.
The locations of villages downloaded to Esri File Geodatabase (ArcData Praha, 2016) were adjusted manually to correct the positions of several locations. The places which were defined only by street name, or as a location on the crossings of streets, or only by location description were processed manually. The position correction and completion of points was carried out in the Editor mode.
After that the relationship class was created from the context menu from the file geodatabase, the Global ID as well as the attachments and archive were enabled. The file geodatabase was completed through these steps. Afterwards, all features in the file geodatabase were copied to the Enterprise geodatabase at the SQL Server, whereby the 1:1 copy was created.
5.3 Creation of themap service
The new MXD in ArcMap was created. The JTSK East North coordinate system was set in the Data Frame, as well as a Date Transformation between JTSK East North and WGS-84 (this step is needed for the correction transformation on the web map).
way (see Figure 4 for the service structure).After that, the service editor was called up through the following steps: 1) File -> 2) Share As -> 3) Service -> 4) Enter the service name and select folder on the server. In the Service editor window only the map service was kept selected at the time because only the map service was published. The MS SQL database was registered on ArcGIS for server and the map service was created.
Figure 4. Scheme for MXD, for the Map Service, the left side represents a dataset forGuide to Protectorate Prague, including eventtables outside the dataset and the right side
represents the dataset for Bloody Finale
After that two rasters (one with the historical map of Prague, the second with the historical map of the Protectorate) (Brichta, 2016) were added to table of content of the empty MXD and the process of publishing the service was repeated. Eventually, these steps lead to the creation of two map services, each representing one book and one service with supporting raster information.
5.4 Creation of the web-map
The basemap in ArcGIS Online consists of a basemap and operational layers. The basemap from ArcGIS server of COSMC (AGS ČÚZK, 2016) was used as a basemap. The two above mentioned ArcGIS Server map services were added to the map – as layers from the web. Because in Prague the density of points is huge, two auxiliary map services were added. Each service contains one layer. One service contains polygons of districts of Prague, and the second one polygons with parts of Prague. The scale restriction for displaying was set to these polygon layers as well as to points from Guide to Protectorate Prague. In this web map, the pop-ups were created based on custom definitions. If the user clicks on the map, the information about the point from the point feature layer appears. If the user wants to display individual records from the event table, he needs to click on the option show related records and these records appear in the attribute table.
5.5 Creation of the web-application
The web map was shared through the Web Application option and the Web AppBuilder window appeared.
Two widgets were added. For better setting multiple basemaps, the Basemap widget was used (all Esri Basemaps are available). The Swipe widget was used to enable covering of basemap by map service with historical maps. The bookmark widget was used for better navigation. The application is available on the link: http://arcg.is/1W0t0Xv
5.6 Creation of the mobile application
Esri offers a new app – AppStudio which enables users to create a native mobile application from WebMap (Holubec, 2016). The authors tested its online version, in which the user
simply enters the map, enters the name and description and checks the selected platform. The cloud system of Esri will create mobile apps for the requested platforms. Because the authors do not have accounts on the application stores Google Play or iStore, only an app for Android stored in FCE CTU ArcGIS Online organization was created. The APK file is
available in ZIP archive at:
geo103.fsv.cvut.cz/padevet/aplikace.zip.
5.7 Known issues
The related records in the attribute table in webmap and webapp are returned in random order. Due the system limitations, the related record must be sorted manually. The related records and coded domains values are not yet supported in the AppStudio templates. Therefore, the simplified database was used.
6. SYMBOLOGY
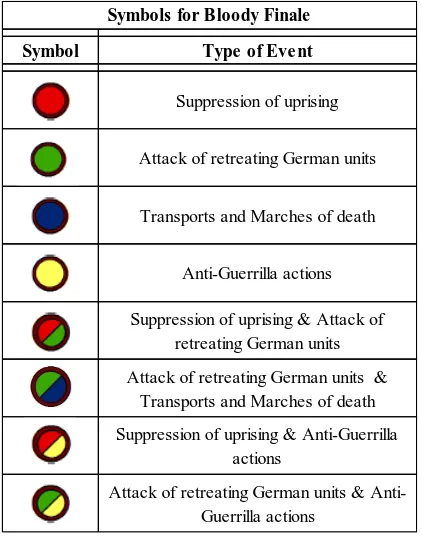
Symbology represented yet another challenging part, especially in case of Guide to Protectorate Prague. The situation was simpler in case of Bloody Finale. There were four individual event types and another four were formed as a result of combinations of the individual ones. The circular shape filled with color was chosen for the individual types. Half-circle for each individual type was used for the combined types which merged in one circle. The list of used symbols for Bloody Finale is shown in Fig. 5.
Figure 5. Symbols for the layers of Bloody Finale
The situation was more complicated when it came to the layers of events from the book Guide to Protectorate Prague. As was already mentioned, the points were based on the particular event type. There can be more than one event type associated with one address which leads to the multiplicity of points at one location.
To solve the issue of clearly displaying all event types at the particular address, a triangle symbol with a circular point at
Symbol Type of Event
Suppression of uprising
Attack of retreating German units
Transports and Marches of death
Anti-Guerrilla actions
Suppression of uprising & Attack of retreating German units
Attack of retreating German units & Transports and Marches of death
Suppression of uprising & Anti-Guerrilla actions
Attack of retreating German units & Anti-Guerrilla actions
the peak was chosen for each event type from this book. The point has the same color for all event types. Nevertheless, this does not matter, because the point at the peak of one type of event will be probably overlapping by the point at the peak of another type of event. The peak with a circle is located on the real location of the address/village point, thus creating a homogenous image of the marker at the exact location regardless of the number of event types in the location. The real marker of the event type is the triangle in particular color. To clearly indicate the position of points with several event types on the same address, each event type has a triangle rotated at 72°, 18°,90°, -162° -234° and 306°.
Figure 6: Comparison of points with a different number of event types on the address displayed. An Esri Imagery
basemap is used as a basemap here.
The exact address point seems to be still the same, and only the triangles with the event types appear or disappear. This symbology was used in all web outputs – web map service, web map, web application and mobile application.
Figure 7: Symbols for layers of Guide to Protectorate Prague
7. CONCLUSION
This paper described the conversion of a printed book to GIS – to geodatabase, map service, web map, map application and mobile application. The amount of processed data is enormous. More than 1400 pages had to be read several times and more than 4000 records were created from them.The whole conversion has brought new opportunities to historians and new perspective on the data since it enables the user to access the data using GIS. Therefore, now it is up to the historians to use this data in their research. We offer them data for further analysis.
Thanks to the web application and the mobile application, we are now able to bring the data also to the wider public. The people who are interested in these information can access
them on their smart-devices, moreover, we can also bring this topic to people who know nothing about it, but they use smart-devices, and as a result of that, they may become interested. Therefore, there is a strong educational potential in the project.
Apart from the above mentioned achievement, there was yet another one – the data quality check. Thanks to this process, we were able to correct several grammar mistakes and also, and maybe more importantly, the errors in facts or in dates – for example 36 addresses of Guide to Protectorate Prague – were analyzed in detail, because the address in the book does not match addresses in the register of addresses of the Czech Republic and 24 addresses do not even exist. As for Bloody Finale, 13 places were corrected with regard to their factual existence. We also found a few inconsistencies in data (the errors in causality). Therefore, in general the conversion represents yet another step in proofreading. This is an additional benefit of GIS and this project.
BIBLIOGRAPHY
Padevět, J., 2013. Guide to Protectorate Prague: Places – events – People (in Czech). Academia, Prague, the Czech Republic, pp. 7 -724.
Padevět, J., 2015. Bloody Finale (in Czech). Academia, Prague, the Czech Republic, pp. 7-631.
Pražák Z., 2014. Web application of events from the Protectorate period in the Prague area. CTU in Prague, Prague, the Czech Republic., pp. 1-28.
Valášková, T., 2016. Digitalization of Books for Application in GIS. Master thesis, CTU in Prague, Prague, the Czech Republic, pp. 1 – 74.
T-MAPY spol., 2014. Bombing of Brno [online]. T-MAPY spol., Brno, the Czech Republic, available at: https://www.tmapy.cz/bombardovani-brna.
Paul, G., Mallmann, K-M., 2010. Gestapo. Academia, Prague, the Czech Republic, pp. 21-698.
ČÚZK, 2016. Open access to the cadastre: Address points RÚIAN in the CSV format [online]. Prague, the Czech Republic, available at:
http://nahlizenidokn.cuzk.cz/StahniAdresniMistaRUIAN.asp x.
ArcData Praha, 2016. ArcČR 500 [online], Esri FGDB format, Prague, the Czech Republic. available at: https://www.arcdata.cz/produkty/geograficka-data/arccr-500.
AGS ČÚZK, 2016. Service of ArcGIS for Server [format]. Esri ArcGIS Server format, Prague, the Czech Republic, available at: http://ags.cuzk.cz/arcgis/rest/.
Brichta, R., 2016, Personal map archive. Non-published map. Prague, the Czech Republic.
Holubec, V., 2016. First stpes in AppStudio for ArcGIS. ArcRevue, 2016 (1), pp. 40-41.
Symbol Type of Eve nt
Collaboration and fascism
Resistance
Uprising
Jews and the holocaust