TRAFFIC SIGN INVENTORY FROM GOOGLE STREET VIEW IMAGES
Victor J. D. Tsai*, Jyun-Han Chen, Hsun-Sheng Huang
Department of Civil Engineering, National Chung Hsing University, Taichung 40227, Taiwan - [email protected]
KEY WORDS: Google Maps API, Google Street View, Traffic Sign Detection
ABSTRACT:
Traffic sign detection and recognition (TSDR) has drawn considerable attention on developing intelligent transportation systems (ITS) and autonomous vehicle driving systems (AVDS) since 1980’s. Unlikely to the general TSDR systems that deal with real-time images captured by the in-vehicle cameras, this research aims on developing techniques for detecting, extracting, and positioning of traffic signs from Google Street View (GSV) images along user-selected routes for low-cost, volumetric and quick establishment of the traffic sign infrastructural database that may be associated with Google Maps. The framework and techniques employed in the proposed system are described.
* Corresponding author
1. MANUSCRIPT
Traffic sign detection and recognition (TSDR) has drawn considerable attention on developing intelligent transportation systems (ITS) and autonomous vehicle driving systems (AVDS) since 1980’s. A TSDR system is normally composed in two specific phases: detection and recognition for identifying traffic signs from road images taken from the in-vehicle camera (Nguwi & Kouzani, 2006; Huang et al., 2008; Sallah et al., 2011; Escalera et al., 2011; Chen et al., 2013). In the traffic sign detection (TSD) phase, the system searches for a region of interest (ROI) that may contain traffic signs within a road image by applying color segmentation or shape classification techniques. In the traffic sign recognition (TSR) phase, the system identifies the category and content of the signs by applying neural network learning, template matching, image classification, or genetic algorithms. Many literatures gave a brief review and comparison on color-based, shape-based, and other approaches for TSDR upon the properties of traffic signs in color, shape, and inner content (Zakir et al., 2011; Johansson, 2002; Nguwi & Kouzani, 2006; Fu & Huang, 2010; Escalera et al., 2011; Feng, 2014). In practice, both TSD and TSR phases involve intensive work on image processing and analysis of a single image/video frame captured by the in-vehicle cameras. There remain a number of important issues in handling these images in real-time environment: lighting conditions, blurring effects, non-ideal orientations, paint deterioration, shape distortions, scale variations, occlusion, and confusion with other similar man-made objects (Nguwi & Kouzani, 2006). These unavoidable issues make the development of TSDR systems an interesting and challenging topic in computer vision community. On the other hand, many researches have been reported on various applications over Google Street View (GSV) images since GSV Service was launched in 2007 and opened to internet communities (Vincent, 2007; Anguelov et al., 2010). Among these applications, Peng et al. (2010) developed a tour guiding video from GSV images on intelligent mobile phones for interactive route recognition to car drivers. Similarly, Wu (2013) developed a panoramic image navigation system that integrates Google Maps routing and GSV images for virtual touring on the Internet based on JavaScript and Ruby on Rails. Tsai & Chang
(2012, 2013) developed an internet platform for accessing the orientation parameters of GSV panoramas in order to determine the global position of interested features by intersection from two overlapping GSV panoramas, which is suitable for volumetric data collection in establishing Location-Based Services (LBS) applications, in which the positional accuracy is not primarily concerned.
Unlikely to the general TSDR systems that deal with real-time images captured by the in-vehicle cameras, this research aims on developing techniques for detecting, extracting, and positioning of traffic signs from GSV images along user-selected routes for low-cost, volumetric and quick establishment of the traffic sign infrastructural database that may be associated with Google Maps. The framework and processes of the system is described in the remaining of this article.
2. TRAFFIC SIGN INVENTORY IN GSV IMAGES
2.1 GSV Image Streamline and Cropping
Google has provided several application program interfaces (API) for developers to access its services associated with Google Maps. The Google Directions API makes it easy to plan a route on Google Maps from selected start location to end location, returning in a JSON routes array with intermediate legs and steps or in an XML <DirectionsResponse> element. These steps and legs can be used to access available GSV images along the route from which intermediate locations were interpolated from the connecting steps within a legs segment. Each available GSV 360° panorama along the route can be requested in an HTTP URL form using Google Maps JavaScript API, along with the projection type, the geodetic position of the street view car and its moving direction with respect to the North at the time of image capture. User-defined parameters, including the size, location, heading, pitch and scale, can also be used to access particular portion of a 360° panorama using Google Street View Image API.
However, a GSV panorama may include severe distortions and ghost image in the upper and lower portions. Meanwhile, the
The International Archives of the Photogrammetry, Remote Sensing and Spatial Information Sciences, Volume XLI-B4, 2016 XXIII ISPRS Congress, 12–19 July 2016, Prague, Czech Republic
This contribution has been peer-reviewed.
tiled GSV image accessed from the GSV server is not truly 360° surrounded, but with overlapped portion in both ends in the horizontal direction. Therefore, the overlapped portion and the empty block in the last row of image tiles shall be cropped as shown in Figure 1. Then, it would be good to locate ROIs only on the central portions of ±30° in the vertical field of view of the camera lens (Tsai & Chang, 2012, 2013). The cropped GSV panorama, whose size depends on the zoom level, and its associated geodetic position and heading were used for further determination of the position of the ROIs by intersection.
(a) Tiled panorama (size: 2048×1024)
(b) Cropped 360° panorama (size: 1664×832)
(c) Cropped central portion (size: 1664×277) Figure 1. GSV 360° panorama cropping (zoom level=3)
2.2 Color Segmentation
Color tone is the most important and significant descriptor that dominates feature identification and extraction in interpretation applications using color images. Color segmentation is the most common method applied for the initial detection of red, blue, green, and yellow or orange traffic signs (Sallah et al., 2011; Benallal & Menuier, 2003). Transformations from RGB color space into many other color spaces like HSI, HSL, HSV/HSB, IHLS, YUV, YCbCr, CIELAB, CIECAM, and CIELUV have been adopted in the literatures in color-based TSD. Among them, the HSI color model is adopted in this research for manipulating images with the transformation from the RGB space in the following relations (Gonzalez & Woods, 1992):
R G B
Transformed S, H components are then segmented with certain threshold values for traffic signs in different colors, resulting in a binary image in which traffic signs object pixels are represented by 1’s, and the background (non-traffic-sign) pixels by 0’s as in Eq. (5) for the red signs and blue signs, respectively (Lin & Tsai, 2011). Resulted binary image was analyzed and labeled for connected regions. The bounding box of each connected region is set to extract the candidate ROI block for filling holes within its internal boundary.
(5)
Shape is also important in traffic sign detection. Depending on the regulations in different countries, traffic signs are usually categorized as prohibitory, restrictive, mandatory, regulatory, and warning signs with regular shapes of circle, triangle, diamond, square or rectangle, and hexagon. Shape classification of each candidate ROI is carried out by evaluating the ROI’s Extent (MathWorks, 2013), which is a ratio of the pixels in the ROI to the pixels of its bounding box as in Eq. (6), for candidate traffic signs in different shape patterns by setting appropriate thresholds (Sallah et al., 2011).
(6)
2.4 ROI Extraction and Normalization
Once a region was classified as traffic sign candidate, the image block within the bounding box of the ROI will be extracted from the cropped GSV image. Meanwhile, the background image will be filtered using the area within the internal boundary as a mask. The ROI image was then normalized into a fixed dimension of 32×32 pixels by applying affine transformation for triangular signs and projective transformation (Wolf & Dewitt, 2000) for circular and rectangular signs, respectively followed by bi-linear interpolation resampling (Huang, 2011; Huang & Tsai, 2011): (a) For triangular signs: corners of a triangle.
(b) For circular and rectangular signs:
(8) from the four corners of the bounding box of rectangular
The International Archives of the Photogrammetry, Remote Sensing and Spatial Information Sciences, Volume XLI-B4, 2016 XXIII ISPRS Congress, 12–19 July 2016, Prague, Czech Republic
This contribution has been peer-reviewed.
signs or the vertices of the semi-major and semi-minor axes of circular signs,
(u', v') is the transformed coordinate of the pixel, (u, v) is the coordinate of the pixel in the original ROI image.
Figure 2 illustrates examples of normalization on triangular and circular traffic signs.
2.5 Sign Content Recognition
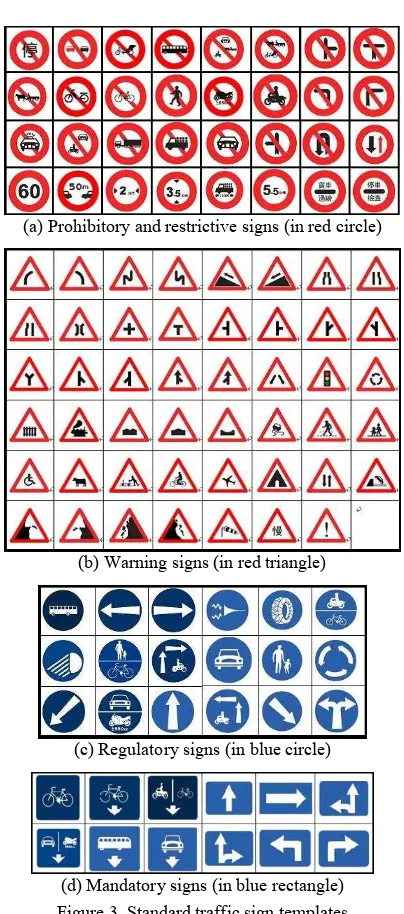
As shown in Figure 3, the standard image templates of traffic signs in the Taiwan Road Traffic Safety Portal Site (http://168.motc.gov.tw) were used as reference for recognizing the content of normalized image of extracted ROIs. The normalized cross-correlation (NCC) matching is considered due to its simplicity on similarity measure, robustness to varying lighting conditions, and the ease of finding a statistical interpretation, although it may suffer from the presence of non-informative ROI pixels (Escalera et al., 2011). Working on the intensity component, the correlation coefficients of the normalized ROI block among the reference templates are computed using Eq. (9) (Wolf & Dewitt, 2000):
(9) ) ( )
(
) )( (
32
1 32
1 2 32
1 32
1 2 32
1 32
1
i j
ij
i j
ij
i j
ij ij
g g f
f
g g f f r
where f is the normalized ROI image block, f is the mean value of f,
g is the reference template of a standard traffic sign, and g is the mean value of g.
2.6 Sign Positioning
Once the normalized ROI block has been recognized as a traffic sign, the original ROI templates from a pair of nearby GSV images will be used to compute their corresponding centroids and to detect conjugate targets. Meanwhile, centroids of the conjugate ROI templates are used to compute the position of the target traffic sign by applying intersection from the known positions of the two GSV images as shown in Figure 4 (Tsai & Chang, 2012, 2013). The positional and non-spatial information about the identified traffic signs will be stored in XML formats for import into a road-network infrastructural database for value-added Location-Based Services based on Google Maps, as demonstrated in Figure 5 (Huang, 2011).
3. SUMMARIES
This article describes the framework and processes of an on-going research that employs traffic sign detection and recognition (TSDR) and positioning from Google Street View (GSV) images. The proposed system is divided into two major components: (1) an internet platform that employs Google Directions API, Google Maps JavaScript API and Web Service, CSS and HTML5 for accessing GSV images and associated orientation parameters along user-selected routes; (2) TSDR core routines using OpenCV and Visual C++ that deal with identifying traffic signs and determining their positions by intersection from two overlapping cropped GSV images. The system is under optimization for real-time operations.
Figure 2. Normalization of extracted ROI image blocks
(a) Prohibitory and restrictive signs (in red circle)
(b) Warning signs (in red triangle)
(c) Regulatory signs (in blue circle)
(d) Mandatory signs (in blue rectangle) Figure 3. Standard traffic sign templates
Figure 4. Positioning by intersection from two GSV images (after Tsai & Chang, 2012, 2013)
The International Archives of the Photogrammetry, Remote Sensing and Spatial Information Sciences, Volume XLI-B4, 2016 XXIII ISPRS Congress, 12–19 July 2016, Prague, Czech Republic
This contribution has been peer-reviewed.
Figure 5. Traffic sign database associated with the Google Maps (after Huang, 2011)
ACKNOWLEDGEMENTS
The support from the Ministry of Science and Technology, Taiwan, under Grants NSC 99-2211-E-005-084 and MOST 104-2219-M-005-008, was appreciated.
REFERENCES
Anguelov, D., C. Dulong, D. Filip, C. Frueh, S. Lafon, R. Lyon, A. Ogale, L. Vincent, and J. Weave, 2010. Google Street View: Capturing the World at Street Level, Computer, vol. 43, no. 6, pp. 32-38.
Benallal, M. and J. Meunier, 2003. Real-time color segmentation of road signs, In: Canadian Conference on Electrical and Computer Engineering, Montreal, Canada, May 4-7, 2003, vol. 3, pp. 1823-1826.
Chen, Y., Y. Xie, and Y. Wang, 2013. Detection and recognition of traffic signs based on HSV vision model and shape features, Journal of Computers, vol. 8, no. 5, pp. 1366-1370.
Escalera, S., X. Baro, O. Pujol, J. Vitria, and P. Radeva, 2011. Background on traffic Sign Detection and Recognition, Traffic-Sign Recognition Systems, Escalera et al., Springer, pp. 5-13. Feng, J., 2014. Traffic Sign Detection and Recognition System for Intelligent Vehicles, Master thesis, School of Electrical Engineering and Computer Science, University of Ottawa, Ottawa, Canada.
Fu, H. and Y. S. Huang, 2010. A survey of traffic sign recognition, In: International Conference on Wavelet Analysis and Pattern Recognition, Qingdao, China, Jul. 11-14, 2010, pp. 119-124.
Gonzalez, R. C. and R. E. Woods, 1992. Digital Image Processing, 2nd ed., Addison-Wesley.
Huang, S. M., 2011. Traffic Sign Detection and Target Image Normalization, Master thesis, Department of Civil Engineering, National Chung Hsing University, Taiwan.
Huang, S. M. and V. J. D. Tsai, 2011. Traffic Sign Detection and Target Image Normalization, In: The 30th Symposium on Surveying and Geomatics, Sept. 1-2, 2011, Taichung, Taiwan, 10 p.
Huang, H., C. Chen, Y. Jia, and S. Tang, 2008. Automatic detection and recognition of circular road sign, In: IEEE/ASME International Conference on Mechtronic and Embedded Systems and Applications (MESA 2008), Beijing, China, Oct. 12-15, 2008, pp. 626-630.
Johansson, B., 2002. Road Sign Recognition from a Moving Vehicle, Master’s thesis, Center for Image Analysis, Uppsala University, Uppsala, Sweden, 72 p.
Lin, Y. J. and V. J. D. Tsai, 2011. Image Processing and Neural Network Techniques in Traffic Sign Recognition, In: The 30th Symposium on Surveying and Geomatics, Sept. 1-2, 2011, Taichung, Taiwan, 9 p.
MathWorks, Inc., 2013. Region and Image Properties, MATLAB Image Processing Toolbox Help Documentation. Nguwi, Y. Y. and A. Z. Kouzani, 2006. A study on automatic recognition of road signs, In: IEEE Conference on Cybernetics and Intelligent Systems, Bangkok, Thailand, Jun. 7-9, 2006, pp. 1-6.
Peng, C., B. Y. Chen, and C. H. Tsai, 2010. Integrated Google Maps and smooth Street View videos for route planning, In: 2010 International Computer Symposium (ICS 2010), Tainan, Taiwan, Dec. 16-18, 2010, pp. 319-324.
Sallah, S. S. M., F. A. Hussin, and M. Z. Yusoff, 2011. Road sign detection and recognition system for real-time embedded applications, In: International Conference on Electrical, Control and Computer Engineering, Pahang, Malaysia, Jun. 21-22, 2011, pp. 213-218.
Tsai, V. J. D. and C. T. Chang, 2012. Feature Positioning on Google Street View panoramas, In: ISPRS Annals of the Photogrammetry, Remote Sensing and Spatial Information Sciences, vol. I-4, pp. 305-309, XXII ISPRS Congress, Melbourne, Australia, Aug. 25-Sep. 1, 2012.
Tsai, V. J. D. and C. T. Chang, 2013. Three-dimensional positioning from Google street view panoramas. IET Image Processing, vol. 7, no. 3, pp. 229-239.
Vincent, L., 2007. Taking online maps down to street level, Computer, vol. 40, no. 12, pp. 118-120.
Wolf, P. R. and B. A. Dewitt, 2000. Elements of Photogrammetry with Applications in GIS, 3rd ed., McGraw Hill. Wu, H. P., 2013. Integrating Google Street Views into Panoramic Navigation System, Master thesis, Department of Civil Engineering, National Chung Hsing University, Taichung, Taiwan.
Zakir, U., I. Zafar, and E. A. Edirisinghe, 2011. Road Sign Detection and Recognition by Using Local Energy based Shape Histogram (LESH), International Journal of Image Processing (JIIP), vol. 4, no. 6, pp. 567-583.
The International Archives of the Photogrammetry, Remote Sensing and Spatial Information Sciences, Volume XLI-B4, 2016 XXIII ISPRS Congress, 12–19 July 2016, Prague, Czech Republic
This contribution has been peer-reviewed.