CITY-WIDE TOTAL ENERGY DEMAND ESTIMATION OF BUILDINGS USING
SEMANTIC 3D CITY MODELS AND STATISTICAL DATA
R. Kaden*, T. H. Kolbe
Chair of Geoinformatics, Technische Universität München, Germany - (robert.kaden, thomas.kolbe)@tum.de
KEY WORDS: Semantic 3D City Models, Geobase Data, Energy Demand Estimation, CityGML
ABSTRACT:
The present climate and environmental policy efforts require comprehensive planning regarding the modification of the energy supply and infrastructures in cities. The strategic planning of the different measures requires a holistic approach and the combination of extensive and complex information. Within this paper, current developments in the context of the project Energy Atlas Berlin are presented. The Energy Atlas Berlin is based on the semantic information model of CityGML and provides an integrative data backbone for the common spatio-semantic representation of the city structure including energy related information of different themes. The virtual 3D city model of Berlin (mainly LOD2 building models) is used as data basis and has been enriched by information of different stakeholders and disciplines. In order to ensure the energy supply, the knowledge about the energy demands of buildings during the planning and optimization of measures is of great strategic importance. Therefore, this paper focuses on the city-wide estimation of the energy demands of buildings including heating, electricity and warm water energy in the city of Berlin using available official geobase and statistical data integrated within the Energy Atlas Berlin. It is explained in detail how the spatial and semantic properties of the 3D building models are being used to estimate these energy demands on an individual building level for the entire city.
* Corresponding author.
1. INTRODUCTION
1.1 Motivation “Energy Turnaround”
In order meet the climate and environmental policy objectives in Germany, various measures are being discussed, which lead to major challenges regarding the planning of energy related urban infrastructures. Planning comprises e.g. the determination of locations for new power generating facilities like photovoltaic, geothermal and decentralized combined heat and power stations, the widespread introduction of e-mobility solutions and hence the grid development as well as large-scale energetic building rehabilitations. Typically, the possible measures and the climate and environmental policy objectives contradict each other, e.g. the introduction of coal-fired power plants or combined heat and power stations lead to an increase in CO2 and particulate emissions and the propagation of e-mobility leads to an increasing electricity demand in the inner cities, which again might be partially compensated by introducing renewable energies, i.e. photovoltaic. These examples illustrate that environmental and energy planning must be holistic in order to allow an optimisation of all measures concerning the overall balance of energy demand, production, and pollution reduction. In addition, further aspects such as the securing of energy supply, urban planning regulations, building codes, acceptance by citizens, forecasts about the urban development and the relationship between costs and benefits have to be considered during the planning phase [Kaden et al., 2012].
One major goal of the climate policy of the city of Berlin is the reduction of CO2 emissions by 40 percent by the year 2020. The official Berlin Environmental Relief Program [SENGUV, 2011] focuses on the building stock and their heating energy demand,
which has a share of up to 80% of the total energy consumption of a building and up to 40% of the total urban energy consumption in Berlin [AGEB, 2012]. Therefore, the aim is to increase the energy efficiency of buildings and thus the reduction of CO2 emissions by comprehensive energetic retrofitting measures. Furthermore, the efficiency of the electrical power and space heating production shall be increased by introducing renewable energy sources, in order to reduce the current CO2 emissions.
One major requirement for the modification of energy related urban infrastructures is to ensure the energy supply of the buildings. Thus, knowledge about the specific energy demands of all buildings during the planning phase of measures is of great strategic importance, as the energy production and distribution infrastructure must be designed for the current and future consumptions and peak loads. Although actual consumption values are available within the different energy companies, these data are often not available due to privacy regulations and economic interests. However, in order to facilitate demand-optimized planning of measures, a number of approaches for the estimation of energy demands have been developed and published in the past.
1.2 Related Work and Discussion
The following approaches for the estimation of the heating energy demand are based on the hypothesis that there is a strong correlation between specific building and socio-economic characteristics and the heating energy consumptions. However, the approaches comprise different calculation methods and input data and have been developed for different purposes and scales. Whereas in the past estimations about energy demands have often been done on a smaller scale, e.g. for blocks,
ISPRS Annals of the Photogrammetry, Remote Sensing and Spatial Information Sciences,
districts, or the entire city, present approaches address the building scale, to allow demand-optimised energy planning.
Strzalka et al. [2010, 2011] describe a method for estimating the heating energy demand using building footprints and LIDAR data, as well as other building information and weather conditions. Based on the building footprints and the height information, a 3D model of the buildings has been derived, which has been used to estimate the heated volume of the building as well as the ratio of the outer wall surface and the building volume, the so called A/V-Ratio. Using the heat transfer coefficients (U-Values) of the constructive components based on the building age, e.g. for walls, windows, and roofs, and the climate data, the heating energy demands for a test area in Stuttgart was estimated with an error of about 14%. Neidhart [2007] and Neidhart et al. [2006] describe a method for deriving a digital heat demand map. Through a building reconstruction method, the building volumes have been determined from LIDAR data and by using a building typology of the settlement structure, the heating energy demands for buildings and for whole settlements have been determined and presented in a heat demand map.
Carrión [2010] and Carrión et al. [2010] describe a method to estimate the heating energy demand of buildings using the semantic 3D city model of Berlin, which is enriched by comprehensive semantic information about the building coming from the official cadastre. From the virtual 3D city model represented in CityGML, the heated volume and the energy reference area has been calculated. Using the building geometry and additional semantic information about the building age and usage, the building typology has been derived for each building. Based on the building typology and the energy reference area, the heating energy demand has been calculated using an appropriate energy characteristic value [kWh/m2a]. For a test area in Berlin, the heating energy demands could be estimated with an average error of about 19%.
A major problem of these methods is that the actual building rehabilitation state is generally not citywide known, so that the estimates mostly are based on energy characteristic values or heat transfer coefficients of the construction, i.e. walls or windows, for its time of construction. Often, however, elements such as windows or exterior walls have been insulated, which drastically reduces the heating energy demand especially of older buildings and the estimated demand values may differ strongly from the actual heating energy consumptions. In addition, the energy characteristic values for the calculation of the heating energy demand are mostly based on simple building typologies under the assumption of non-specific building geometries and with average enveloping wall surfaces per square meter of the energy reference area. The exact enveloping surface values, however, have a significant influence on the specific transmission heat loss of a building, and thereby on the estimated heating energy demands.
2. ENERGY ATLAS BERLIN
The strategic planning of the various measures requires a holistic approach and the combination of extensive and complex information in a common information model. For this purpose, the "Energy Atlas Berlin" initiative was initiated by representatives of science, energy companies and administration and funded by the Knowledge and Innovation Centre for
Climate Change and Mitigation (Climate KIC) of the European Institute of Innovation and Technology (EIT).
Based on the semantic information model of CityGML [Kolbe, 2008; Gröger et al., 2012], the Energy Atlas Berlin allows the design of an integrated, shared ontology for the spatio-semantic representation of the urban structure including energy-related information from different disciplines. The virtual 3D city model of Berlin (mainly LOD2 building models) is used as a database, which is enriched with thematic information of the stakeholders and disciplines (see Figure 1, left). In addition, a virtual 3D city model for a test area in London was created as part of the sister project Neighbourhood Demonstrator where the developed concepts from the Energy Atlas Berlin are about to be adopted (see Figure 1, right) [Kaden et al., 2012 Kaden et al., 2013].
Figure 1. Virtual 3D city models as database for the Energy Atlas Berlin (left) and London (right)
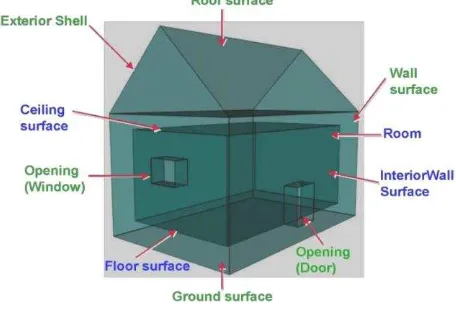
The thematic model of CityGML provides already a large number of required classes and attributes, e.g. for the semantically decomposed representation of the buildings with their thematic surfaces WallSurface, GroundSurface, and RoofSurface (see figure 2) as well as for the description of the roof shape, usage type, number of storeys, construction year, and building height.
Figure 2. Thematic decomposition of a building in CityGML [Gröger et al., 2012]
Subject-specific entities, which are not pre-defined in CityGML by classes and attributes, are integrated into the Energy Atlas using the CityGML extension mechanisms Application Domain Extension (ADE) and GenericCityObjects and GenericAttributes [Krüger and Kolbe, 2012]. Due to the flexibility of the thematic representation of nearly any object with a spatial reference and the provided Levels of Detail (LOD), CityGML proves to be an ideal information model for a
ISPRS Annals of the Photogrammetry, Remote Sensing and Spatial Information Sciences,
common engineering data backbone for environmental and energy planning [Kaden et al. 2013]. This information backbone is stored and managed in the project using the 3DCityDB [3DCityDB, 2012], which is an Open Source 3D geodatabase structured according to a CityGML compliant relational database schema and which has been developed by representation of the actual state of the environment and energy-related objects and parameters in the sense of an urban inventory and on the other hand the investigation and representation of options for measures such as the comparison of the estimated energy demands and the production and savings potential, e.g. by renewable energy sources and energetic retrofitting of buildings, including the balancing of economic measures. The options for measures are based on analyses and simulations using geometric and semantic information in the Energy Atlas Berlin and include, amongst others, the estimation of electricity and heating energy demands of buildings and energetic building characteristics as well as retrofitting potentials, the design of an optimal energy grid expansion taking into account the electricity demand and load peaks, the estimation of the energy demand and CO2 emissions due to traffic, and the use of geothermal energy and solar energy potentials. By the subsequent aggregation of the parameters determined in the Energy Atlas Berlin at different spatial regions, e.g. blocks, neighbourhoods and districts, but also supply regions of different infrastructures, the Energy Atlas is used for planning and decision-making of measures at different scales and levels of decision, from the building level to the city level [Kaden et al. 2013; Krüger and Kolbe, 2012].
The presented approaches of Strzalka and Carrión have shown calculation of the transmission heat losses of each enveloping surface at various stages of rehabilitation and the heat gains through solar irradiation and inner heat sources. Additionally, the energy demand for the production of warm water has been estimated and a new approach to estimate the electric power demands of the buildings has been developed, in order to estimate the total effective energy (net energy) demands of buildings within the city of Berlin.
3. ESTIMATION OF HEATING ENERGY DEMANDS
The heating energy demand of a building is affected by a number of parameters, which have to be considered within the calculation. These parameters can be grouped into the six categories 1.) climate influence, 2.) building geometry, 3.) building usage, 4.) user behaviour, 5.) building construction and 5.) building utilities. Information about the building utilities, i.e. boiler and heating system, is needed to calculate the total energy of a particular energy source. Since this information is not available for the city of Berlin, only the effective energy (net energy) demand for space heating has been calculated on the basis of the approach "energy pass heating/hot water",
published by the Institute for Housing and Environment (IWU) [Loga and Imkeller-Benjes, 1997].
3.1 Estimation and Definition of Input Values
3.1.1 Climate Conditions: For the definition of the climate conditions average temperature values of the previous years or real weather data for a specific region can be used. One input parameter is the so-called degree-day number, which represents the temperature difference between outside and inside for a certain time, according to VDI 2067 [VDI, 2000]. For the estimation of the energy demand in kWh, the degree-day number has to be converted into degree-hour Θ [kKh/a]. For the city of Berlin, a degree-hour number of 79 kKh/a and a heating period tH [d/a] of 212 d/a were calculated with a temperature limit for heating of 12 °C and an average desired room temperature of 20 °C.
3.1.2 Building Geometry: The building geometry values are calculated from the virtual 3D city model of Berlin. First the energy reference area AEB is estimated, which describes the heated space of a building. Since the virtual 3D city model of Berlin mainly consists of LOD2 buildings, no information about the interior structure of the buildings is available. Thus, the energy reference area can be estimated as follows:
AEB= 0,75 ∙ nG∙ AFB [m2] (1)
where 0,75 = factor for estimating used space from ground nG = number of heated storeys
AFB = building footprint area
The number of heated storeys nG includes the full storeys and the heated portions of the cellar and attic. Since there is no city-wide information whether certain cellars or attics are heated or not, assumptions have been made for the following estimations. The inner-city buildings of Berlin are primarily multi-storey apartment buildings, where the cellars are mostly unheated and also the attic storeys are often not heated. The number of heated storeys thus corresponds to the number of full storeys of a building. However, the number of storeys of the buildings is not represented within the virtual 3D city model of Berlin and was estimated using the 3D building geometry and average storey heights for the different construction epochs. In Carrion [2010], another method for calculating the energy reference area is presented, published in the Energieeinsparverordnung (Energy Saving Ordinance) 2007 (EnEV). This method is based on the volume of the building and the storey height and can also be used, depending on the available data.
For the calculation of the transmission heat losses, the surface numbers of the thermal hull Ai of the individual components i {roof, exterior wall, window, cellar wall} of the buildings are needed. Due to the simplification that the cellars and attics are considered to be unheated, the calculation of roof and cellar surfaces can be omitted. Instead, the ground surface of the building serves as the thermal hull surface number for the ground floor to the unheated cellar as well as for the top floor to the unheated attic. The surface numbers of the required ground surface and the outer wall surface were calculated from the semantic 3D city model. The outer wall surface includes only the surface portions, which are adjacent to the air, but not adjacent to buildings. Since the virtual 3D city model of Berlin mainly includes LOD2 building models, the exact window area of a building cannot directly be calculated from the Energy Atlas Berlin. The window area number can be estimated
ISPRS Annals of the Photogrammetry, Remote Sensing and Spatial Information Sciences,
according to a mean window to wall surface ratio based on the building classes, presented in the following chapter.
3.1.3 Building Construction: As a reference for the building construction, especially for the physical and thus energetic properties of the building hull, the building age classes have been used. The building age classes for each building within a large region of Berlin have been extracted from a map served by a WMS and integrated into the Energy Atlas Berlin. For the calculation of the transmission heat losses, the heat transfer coefficient Ui (U-values) of the individual components is required. The U-value is a measure of the heat transfer through a component, e.g. a window or wall, in W/(m²K) and expresses how much rated power per square meter of a component is needed on one side to maintain a temperature difference of one Kelvin to the other side. Expressing the rated power as energy per unit of time, it can be simplified that the U-value indicates the amount of energy that passes a component per unit of time.
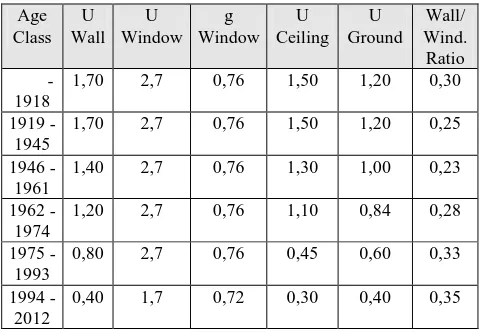
For the building envelope a distinction is made between opaque and transparent surfaces. The components of opaque surfaces usually have a lower heat transfer coefficient than transparent components but the transparency allows in turn for heat gains, which need to be considered in the heat balance. Since the Energy Atlas Berlin does not include information about the window surfaces, the average window to wall surface ratio is needed in order to estimate the window surface number of the buildings. For this purpose, several building representatives of the different building age classes were investigated and the average window-wall surface ratios have been determined (see Table 1). Based on the building age classes average heat transfer coefficients (U-values) for the components wall and window as well as for the ceiling of the top floor to the unheated roof and for the ground floor to the unheated cellar have been defined for the Energy Atlas Berlin. The definition of the specific values was done in close collaboration with the project partners from the Institute of Architecture at TU Berlin and is based on analyses from [Loga et al, 2005; Jagnow, 2005; BMVBS, 2009; Loga et al, 2012; Ebel et al., 1991]. In order to calculate the heat gain of transparent surfaces an overall energy transmittance (g-value) was defined for the windows (see Table 1). related U-Values, g-Value and the window-wall area ratio
Within the Atlas Energy Berlin, the transmission heat loss of the individual components of a building is initially estimated by
its hull surface number and the corresponding heat transfer coefficients w.r.t. the time of construction. In case of maintenance and rehabilitation measures, especially for older buildings, the energy efficiency of building components has been increased, which significantly reduces the transmission heat loss. Therefore, different rehabilitation states have been defined for each building age class including improved U-Values w.r.t. the energetic characteristics of new components.
3.2 Calculation of net energy demand for space heating
The effective energy demand of buildings for space heating is calculated for all defined rehabilitation stages of a building, based on the approach "energy pass heating/hot water" published by the Institute for Housing and Environment (IWU) [Loga and Imkeller-Benjes, 1997]. The definition and pre-computation of several energy-saving renovation stages flows back into the Energy Atlas Berlin and allows analysing energy saving potentials of different measures within the Energy Atlas Berlin.
The calculation method of IWU is based on a detailed consideration of the heat loss through the building envelope and through regular airing for a specific outdoor temperature and the heat gains by solar radiation and through the internal heat sources.
The net energy demand QH of a building is calculated from the difference between the heat loss and heat gain as follows:
QH = QV - QG [kWh/a] (2)
where QV = Heat loss QG = Usable heat gain
The heat loss QV is the sum of the transmission heat losses and the heat loss by regular airing, which is multiplied by a factor for the night and weekend reduction. Default values for the night and the combined night and weekend reduction can be found in the documentation of the IWU. The correction factors are determined by dynamic simulations. For buildings with predominantly residential use, the night reduction is applied and for buildings with commercial or public use, the night and weekend reduction can be used. The building usage was taken from the Energy Atlas Berlin, where it is stored in the CityGML attribute “usage” of the building features.
QV = (QT + QL) ∙ fAbs [kWh/a] (3)
where QT = Transmission heat loss QL = Heat losses by airing fAbs = Night and weekend reduction
The transmission heat loss QT results from the sum of the heat losses of all enveloping building component surfaces i. These are the outer wall surface, the window surface, the surface of the ground floor to the unheated cellar and the top-level ceiling to
ISPRS Annals of the Photogrammetry, Remote Sensing and Spatial Information Sciences,
According to IWU, the reduction factor fi is 1.0 for all components, which are adjacent to the outside air. For all components, which are adjacent to unheated but well-insulated space (from the outside air), i.e. a cellar or the soil, the reduction factor is 0.5.
The ventilation heat loss QL is caused by the natural airflow on different building uses. The building usage is taken from the Energy Atlas Berlin and is used to select a standard value for the energy effective air exchange n from the IWU documentation. A mechanical air exchange through a ventilation system is not considered in the Energy Atlas Berlin.
Q L = 0,34 ∙ n ∙ V L∙ Θ [kWh/ a] (5)
where n = Energy effective air exchange [1/h] VL = Building volume [m³]
After calculating the heat loss, the usable heat gain QG is determined. The usable heat gain is the usable portion F of the free heat QF.
QG = F∙ QF [ kWh/a] (6)
where F = Usable portion of the free heat QF = Free heat
The free heat QF consists of the inner building heat sources QI and the solar irradiation QS.
QF = QS + QI [kWh/a] (7)
where QS = Solar irradiation
QI = Inner building heat sources
The utilization efficiency F of the free heat represents the portion of the free heat that is used for space heating. It depends on the relationship between the available free heat and the heat loss of the building.
F = 1 - 0,3 ∙ (QF/QV) (8)
The solar heat input QS of the window surfaces is calculated depending on its direction i {East, Southeast, South, Southwest, West, Northwest, North, Northeast}. For the global radiation Gi, standard values for specific regions and for the heating period are available e.g. in the IWU documentation.
QS= r ∙ gs∙ ∑ (Gi∙ AF,i) [kWh/a] (9)
where Gi = Global radiation during the heating period on a surface with orientation i [kWh/(m²a)]
AF,i = Window surface number with orientation i [m²] gs = Overall energy transmittance of the glass surface r = Reduction factor for solar irradiation by windows (standard value: 0.36)
Since the windows of buildings are not represented within the virtual 3D city model of Berlin (LOD2), a simplification of the calculation is made within the Energy Atlas Berlin. The direction-dependent window surface numbers AF,i are replaced by the total window surface AF and the direction-dependent global radiation values are replaced by an average value of 240 kWh/(m²a) for the vertical window surfaces. The previous
formula for calculating the solar heat output is simplified as follows:
QS= r ∙ gs∙ 240 ∙ AF [kWh/a] (10)
The reduction factor r (default: 0.36, for unshaded location: 0.48) results from the multiplication of the individual reduction factors:
proportion of non-transparent window parts (default: 0.70)
shading from neighbouring buildings, trees, etc. (default is 0.63, for unshaded Location: 0.84)
pollution (default: 0.95)
reduced transmission by non-vertical radiation (default: 0.85)
The calculation of the inner heat sources QI is based on standard values for the specific heat capacity of the inner building heat sources for different building uses. Standard values depending on the building usage can be taken from the IWU documentation.
QI= 0,024 ∙ q˙i∙ tH∙ AEB [kWh/a] (11)
where 0,024 = Factor for the conversion of Watt to Kilo-Watt and day to hours
q˙i = Specific Heat output of internal heat sources [W/m²]
tH = Heating period [d/a] AEB = Energy reference area
The algorithms for calculating the energy demand for space heating and the geometric calculations of the input values are implemented in Java. As input file, a CityGML LOD2 building model is required, including the age class and the usage type of the buildings. The building constructive characteristics and rehabilitation stages of the different building age classes and the climate data of the Berlin region is provided using an additional CSV file. The calculated heating energy demands of the individual rehabilitation stages are integrated to the virtual 3D city model as CityGML attributes and are thus available for further analysis in an interoperable manner. Figure 3 shows a 3D visualization of the estimated annual heating energy demands of specific buildings within a statistical block in the district Berlin Moabit.
Figure 3. 3D visualisation of coloured buildings regarding the estimated annual heating energy demand [kWh/a]
ISPRS Annals of the Photogrammetry, Remote Sensing and Spatial Information Sciences,
4. ESTIMATION OF ELECTRIC POWER DEMANDS
As for the estimation of the heating energy demand, the electrical power demand also depends on a large number of parameters. In contrast to the heating energy demand, however, the electrical power demand mainly depends on the individual users and appliances and not manly on physical building characteristics. The energy company Vattenfall has published empirical values representing the mean electricity consumption of different household sizes. Under the assumption of the availability and regular use of certain appliances, mean electric power consumption values for residentially used apartments, w.r.t. the number of residents, are published. Using these values for the estimation of electric power demands of buildings, three important input parameters are needed: 1.) the number of households per building, 2.) the number of inhabitants per household, and 3.) the building usage. Analogue to the previous calculation, the building usage is taken from the virtual 3D city model of the Energy Atlas Berlin.
4.1 Estimation and Definition of Input Values
4.1.1 Apartments per Building: The official geobase data in Germany already provides a wide range of geographic but also thematic information; however, there is no available data source including the number of apartments per building. The following approach is based on the hypothesis, that there is a strong correlation between the building volumes of the different building age classes and the number of apartments within a residential building. The building age classes and the building volumes have been derived from the virtual 3D city model of Berlin.
To estimate the number of apartments per building, an indicator representing the number of units per building volume has been introduced and empirically estimated. Therefore, a field survey in Berlin has been done counting the number of units for more than 300 building representatives of the six different building age classes. In order to increase the reliability of the indicator, the field data and the virtual 3D city model have been carefully matched and manually checked, e.g. whether the bounded volume of the building model is identical to the composed building parts in the reality and thus if the counted units relate to the building model. A selection of 20 general building representatives per age class has been made to estimate the indicator as follows:
IU/V= ∑ (nU/B) / ∑ (VL) [unit/m3] (12)
where VL = Building volume [m³] nU/B = Counted units per building
Table 2 shows the estimated indicator unit per m3 building volume for the individual building age classes in Berlin Mitte.
Class Period of Construction Indicator [unit/m3] 1 - 1918 0.0023247637 2 1919 - 1945 0.0025399709 3 1946 - 1961 0.0035708397 4 1962 - 1974 0.0032491869 5 1975 - 1993 0.0026467066 6 1994 - 2012 0.0026363702
Table 2. Estimated indicators unit per building volume for the six building age classes
The estimated indicators illustrated in figure 4 reflect the German history very well. The first building age class includes the so-called “Gründerzeit” buildings, which are characterised by large apartments with high ceilings. Also within the second construction period, during the WW II era, apartments have been built amply. After the Second World War, due to destroyed cities and massive housing shortage, apartments were built smaller with lower ceilings in order to obtain more units within a building. This situation eased with time and the sizes of apartments increased again.
Figure 4. Visualisation of the estimated indicators unit per building volume for the six building age classes
Using the estimated indicator, the number of apartments per building has been calculated for the remaining buildings within the test area in Berlin Moabit/Mitte by multiplying the indicator with the calculated building volume.
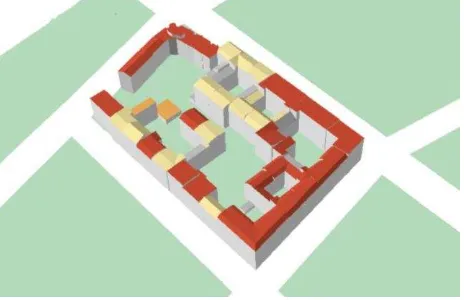
4.1.2 Number of residents per apartment: As for the number of apartments per building, the number of residents per apartment has been estimated as well, since there is no official data available in Berlin. The estimation has been done within two steps: 1.) estimating the number of residents within a building and 2.) distributing the residents of a building to the estimated apartments. For the first step, official census data of the so-called statistical blocks has been used, which includes the number of residents within the block. Figure 5 shows the integrated statistical blocks (green) with the virtual 3D city model within one block.
Figure 5. Statistical blocks with integrated building models
The number of residents has been distributed to the buildings with residential use according to the calculated building volumes. Thus, the number of residents per building nR/B has been estimated as follows:
nR/B = nR/SB / VSB∙ VL [res./building] (13)
…-1918 1919-1945 1946-1961 1962-1974 1975-1993 1994-2012 ,004
,0035 ,003 ,0025 ,002 ,0015 ,001 ,0005 0
ISPRS Annals of the Photogrammetry, Remote Sensing and Spatial Information Sciences,
where VL = Building volume [m³]
VSB = Total building volume of a statistical block nR/SB = Number of residents of a statistical block
Within the second step, the building residents have been distributed to the apartments. The official census data of Berlin includes information about the share of one, two, three, and four or more person households per district [Statistik BB, 2012], shown in figure 6 for the district Berlin Mitte. According to that share, the number of residents per building has been distributed and a number for one, two, three, and four or more person households within a building has been estimated.
Figure 6. Share of one, two, three, and four or more person households in the district Berlin Mitte
4.1.3 Validation: The estimated number of apartments per building and the number of residents have been validated before estimating the electrical power demands. Therefore, the mean number of residents per apartment for the test area Berlin Moabit/Mitte has been calculated by dividing the total number of residents by the total number of the estimated apartments in that area. The validation result can be seen in table 3.
Own Estimation Official Census Mean Number of
Residents per Apartment
1.58 1.65
Table 3. Validation via the mean number of residents per apartment based on the estimated apartments and the given number of residents per statistical block and the official census value for the district Berlin Mitte [Statistik BB, 2012]
4.2 Calculation of Electrical Power Demand
Using the estimated number of households with one, two, three, and four or more residents, the electrical power demand is simply calculated by summing up the mean annual electrical power consumption of the different households. Table 4 shows the used values for the different types of households, published by the energy company Vattenfall.
Number of Residents per Household
1 2 3 4
Annual Electrical Power
Consumption [kWh/a] 2050 3440 4050 4750
Table 4. Annual electric power consumption of a household in Berlin w.r.t the number of residents [Vattenfall, 2012]
Figure 7 shows a map visualisation of the estimated annual electrical power demand of specific buildings within the district Berlin Moabit. The map only includes buildings with residential usage.
Figure 7. Map representation of coloured buildings regarding the estimated annual electric power demand [kWh/a]
5. ESTIMATION OF WARM WATER ENERGY
DEMANDS
The estimation of the energy demand for the warm water production QW of a building mainly depends on the number of residents of a building. For the estimation within the Energy Atlas Berlin, a mean consumption value per person, published by the IWU, is used to estimate the energy demand for the warm water production as follows:
QW = QW/P∙ nR/B [kWh/a] (14)
where QW/P = Annual warm water consumption per person [kWh/(P∙a)] (Standard value: 600 kWh/(P∙a))
nR/B = Number of residents per building
The number of residents per building with residential use nR/B has been estimated in section 4. Figure 8 shows a 3D visualization of the estimated annual energy demands for warm water production of specific buildings within a statistical block in the district Berlin Moabit.
Figure 8. 3D visualisation of coloured buildings regarding the estimated annual warm water demand [kWh/a]
ISPRS Annals of the Photogrammetry, Remote Sensing and Spatial Information Sciences,
6. CONCLUSION AND FURTHER WORK
Within this paper, methods for the city-wide total energy demand estimation of buildings have been presented using semantic 3D city models and statistical data. The estimations have been done within the Energy Atlas Berlin initiative and have been realised in strong cooperation with the Institute for Architecture at TU Berlin, which has defined the energetic conditions of the building constructions. The paper has shown the suitability of semantic 3D city models as the basis for a city-wide energy demand calculation on the building scale. Therefore, the available official LOD2 building model of Berlin has been used for the direct calculation of the thematic hull surfaces, the building volume, and the storey height. Additional semantic information like the building age classes, building height and building usage has been integrated and is available for the energy demand calculation. However, the window area number for the calculation of the window transmission heat loss was just estimated based on mean wall to window ratios. Using a LOD3 building model would facilitate the calculation of the exact window area number as well as the orientation of the windows which increase the reliability of the estimated window transmission heat loss and the solar heat gain. Using a LOD4 interoperable manner, e.g. for spatial aggregations, for balancing with production potentials of renewable energies, and for the planning of optimal smart grids. Further work will include a more detailed validation of the results and the estimation of energy demand for further building rehabilitation states. Also the impact of assumptions to the estimated energy demands will be analysed and discussed in detail.
7. REFERENCES
3DCityDB, 2012. 3DCityDB Home - The CityGML Database 3DCityDB, URL: http://www.3dcitydb.net/ (29.05.2012).
AGEB, 2012. Auswertungstabellen zur Energiebilanz für die Bundesrepublik Deutschland 1990 bis 2011. Berechnungen auf Basis des Wirkungsgradansatzes. Stand: September 2012. Arbeitsgemeinschaft Energiebilanzen e.V., URL: http://www.ag-energiebilanzen.de/viewpage.php?idpage=139 (10.01.2013).
BMVBS, 2009. Bekanntmachung der Regeln zur Datenaufnahme und Datenverwendung im Wohngebäudebestand vom 30. Juli 2009. Bundesministerium für Verkehr, Bau und Stadtentwicklung, URL: http://www.bbsr-energieeinsparung.de/cln_033/nn_1025012/EnEVPortal/DE/En EV/Bekanntmachungen/Download/NWGDatenaufnahme, templateId=raw,property=publicationFile.pdf/NWGDatenaufna hme.pdf (10.01.2013).
Carrión, D., 2010. Estimation of the energetic rehabilitation state of buildings for the city of Berlin using a 3D city model represented in CityGML. Master Thesis, Technische Universität Berlin, Germany. Photogrammetry, Remote Sensing and Spatial Information Sciences, XXXVIII-4/W15, S. 31-36.
Ebel, W., Eicke, W., Feist, W., Gabler, W., 1991. Dokumentation der Referenzgebäude, Wärmetechnische Gebäudetypologie für die Bundesrepublik Deutschland (alte Bundesländer). BMFT-Projekt: Instrumente für die Entwicklung von Strategien zur Reduktion energiebedingter Klimagasemissionen in Deutschland, Institut Wohnen und Umwelt GmbH (IWU) Darmstadt.
Gröger, G., Kolbe, T., Nagel, C., Häfele, K.-H., 2012. OGC City Geography Markup Language (CityGML) Encoding Standard, v2.0, OGC Doc. No. 12-019. URL: http://www.opengeospatial.org/standards/citygml (13.01.2013).
Jagnow, K., 2005. Energetisch relevante Kennwerte eines Gebäudes. Kenwerte Außenbauteile. Weiterbildungskurs "Energieberater TGA" in Wolfenbüttel, URL: http://www.energieberaterkurs.de/export/sites/default/de/Dateie n_Kennwerte/kennwerte_aussenbauteile.pdf (10.01.2013).
Kaden, R., Krüger, A., Kolbe, T. H., 2012. Integratives Entscheidungswerkzeug für die ganzheitliche Planung in Städten auf der Basis von semantischen 3D-Stadtmodellen am Beispiel des Energieatlasses Berlin. In: Seyfert, E. (Hrsg.), Publikationen der Deutschen Gesellschaft für Photogrammetrie, Fernerkundung und Geoinformation e.V. Band 21, 32. Wissenschaftlich-Technische Jahrestagung der DGPF, 14.-17. March, Potsdam, Germany.
Kaden, R., Prytula, M., Krüger, A., Kolbe, T. H., 2013. Energieatlas Berlin: Vom Gebäude zur Stadt – Am Beispiel zur Abschätzung der Wärmeenergiebedarfe von Gebäuden. In: Koch, A., Bill, R., Donaubauer, A. (Hrsg.) Geoinformationssysteme, Proceedings of the 18. Münchner Fortbildungsseminar 2013, 18.-11. April, Munich, Germany.
Kolbe, T. H., 2008. Representing and Exchanging 3D City Models with CityGML. In: Lee, J., Zlatanova, S. (Hrsg.), Lecture Notes in Geoinformation & Cartography, 20, Springer Verlag.
Krüger, A., Kolbe, T. H., 2012. Building Analysis for Urban Energy Planning using Key Indicators on Virtual 3D City Models – the Energy Atlas of Berlin. International Archive Photogrammetry, Remote Sensing and Spatial Information Science, XXXIX-B2, 145-150.
Loga, T., Imkeller-Benjes, U., 1997. Energiepass Heizung/ Warmwasser. Institut Wohnen und Umwelt (IWU), URL: http://www.iwu.de/fileadmin/user_upload/dateien/energie/werk zeuge/ephw-1.pdf (25.01.2013).
Loga, T., Diefenbach, N., Knissel, J., Born, R., 2005. Kurzverfahren Energieprofil. Ein vereinfachtes, statistisch abgesichertes Verfahren zur Erhebung von Gebäudedaten für die energetische Bewertung von Gebäuden. Bauforschung für die Praxis, Band 72, Stuttgart: Fraunhofer IRB-Verlag.
Loga, T., Diefenbach, N., Stein, B., 2012a. Typology Approach for Building Stock Energy Assessment. Main Results of the
ISPRS Annals of the Photogrammetry, Remote Sensing and Spatial Information Sciences,
TABULA project. TABULA Project Team, 43 S., URL: http://www.building-typology.eu/downloads/public/docs/report/ TABULA_FinalReport.pdf (10.01.2013).
Loga, T., Müller, K., 2012b. Evaluation of the TABULA Database Comparison of Typical Buildings and Heat Supply Systems from 12 European Countries. TABULA Project Team, October 2012, URL: http://www.building-typology.eu/downloads/public/docs/report/TABULA_WorkRep ort_EvaluationDatabase.pdf (10.01.2013).
Neidhart, H., 2007. Digitale Wärmebedarfskarte aus Laserscanning. Dreiländertagung der SGPBF, DGPF und OVG: Von der Medizintechnik bis zur Planetenforschung – Photo-grammetrie und Fernerkundung für das 21. Jahrhundert, DGPF Tagungsband Nr. 16, S. 339-345.
Neidhart H., Sester, M., 2006. Creating a digital thermal map using laser scanning and GIS. Proceedings of the 10th International Symposium on District Heating and Cooling, Hanover, Germany.
SenGUV, 2011. Klimaschutz in Berlin. Broschüre, Senatsverwaltung für Gesundheit, Umwelt und Verbraucherschutz, Berlin, URL: http://www.stadtentwicklung. berlin.de/umwelt/klimaschutz/publikationen/infoblatt/index.sht ml (24.01.2012).
Stadler, A., Nagel, C., König, G., Kolbe, T.H., 2009. Making interoperability persistent: A 3D geo database based on CityGML. In: Lee, Zlatanova (Eds.): Proceedings of the 3rd International Workshop on 3D Geo-Information, Seoul, Korea. LNG & C, Springer.
Statistik BB, 2012. Ergebisse des Mikrozensus im Land Berlin 2011. Amt für Statistik Berlin-Brandenburg, Potsdam.
Strzalka, A., Bogdahn, J.,Coors, V., Eicker, U., 2011. 3D City modeling for urban scale heating energy demand forecasting. In: HVAC&R Research, Jg. 17, H. 4, S. 526–539.
Strzalka A., Eicker U., Coors V., Schumacher J., 2010. Modeling Energy Demand for Heating at City Scale. In: Proceedings of SimBuild 2010, 4th National Conference of IBPSA-USA, New York, USA.
Vattenfall, 2012. Energie sparen – Stromverbrauch prüfen. URL: http://www.vattenfall.de/de/infowelt-energie/file/ Stromverbrauch-pr_fen_22159646.pdf (03.06.1013).
VDI, 2000. VDI 2067: Wirtschaftlichkeit gebäudetechnischer Anlagen - Energieaufwand der Nutzenübergabe bei Warmwasserheizungen, URL: http://www.vdi.de/technik/ fachthemen/bauen-und-gebaeudetechnik/fachbereiche/
technischegebaeudeausruestung/richtlinienarbeit/vdi-2067/ (15.01.2013).
ISPRS Annals of the Photogrammetry, Remote Sensing and Spatial Information Sciences,
![Figure 3. 3D visualisation of coloured buildings regarding the estimated annual heating energy demand [kWh/a]](https://thumb-ap.123doks.com/thumbv2/123dok/3197676.1392162/5.595.306.541.561.715/figure-visualisation-coloured-buildings-regarding-estimated-annual-heating.webp)
![Figure 7. Map representation of coloured buildings regarding the estimated annual electric power demand [kWh/a]](https://thumb-ap.123doks.com/thumbv2/123dok/3197676.1392162/7.595.97.253.213.306/figure-representation-coloured-buildings-regarding-estimated-annual-electric.webp)
